2025 Q2 Dapp Market Report: AI Agent Applications Rise to the Top, RWA and Gaming Drive NFT Recovery
TechFlow Selected TechFlow Selected
2025 Q2 Dapp Market Report: AI Agent Applications Rise to the Top, RWA and Gaming Drive NFT Recovery
AI agents top the market, RWA redefines NFT value, DeFi attracts capital but loses momentum, while $6.3 billion in hacks during the second quarter exposed the industry's fragility.
Author: Sara Gherghelas, DappRadar
Translation: Tim, PANews
Despite a rebound in crypto prices and improved market sentiment, the DApp ecosystem presents a different picture: AI agents are experiencing explosive growth, NFTs are shifting from status symbols to functional utility, while DeFi navigates between rising TVL and shrinking funding. These data points not only reflect market activity but also reveal real user flows, underperforming sectors, and key trends reshaping the future of DApps.
We now live in an era where hype alone can no longer drive market movements. Users are increasingly seeking genuine value—be it AI agents capable of performing tasks, NFTs linked to RWAs, or DeFi platforms offering sustainable yields. Yet risks remain high: losses from exploits have surged dramatically, underscoring how fragile trust is and how even minor oversights can be exploited by malicious actors.
This report provides an in-depth analysis of industry dynamics, examining data trends across DeFi, NFTs, gaming, and AI. From wallet activity and transaction volumes to application adoption and capital flows, we track critical signals and focus on the core narratives shaping the cryptocurrency sector in Q2 2025.
Key Takeaways:
-
In Q2 2025, daily active unique wallets for DApps averaged 24.3 million, down 2.5% quarter-on-quarter, yet still up 247% compared to early 2024.
-
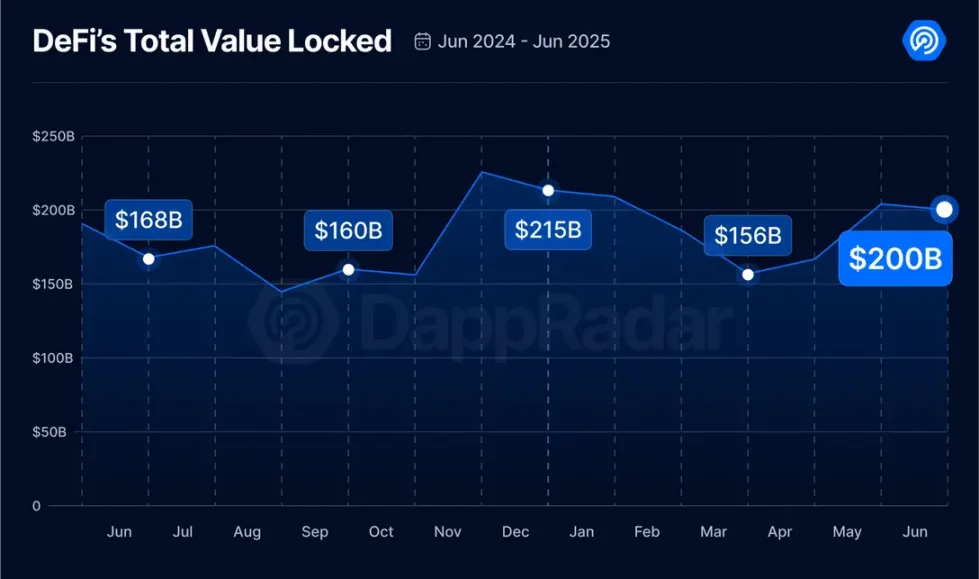
DeFi’s total value locked (TVL) reached $200 billion, a 28% increase quarter-on-quarter, driven largely by Ethereum's 36% price recovery. However, DeFi funding dropped 50% quarter-on-quarter to just $483 million in Q2, bringing total funding for the first half of 2025 to $1.4 billion.
-
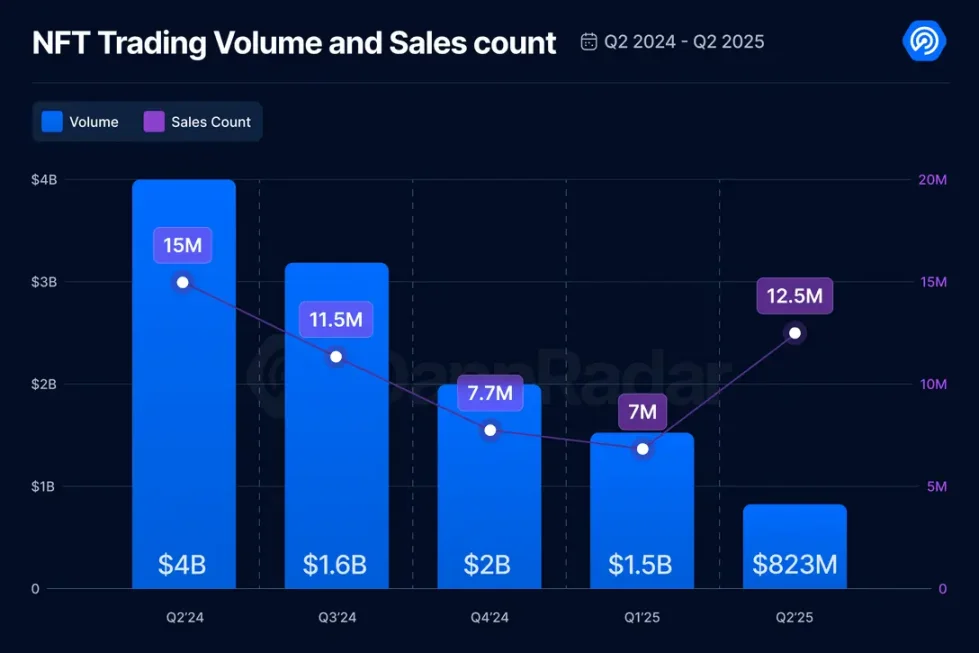
NFT trading volume plummeted 45% to $867 million, while the number of transactions surged 78% to 14.9 million, reflecting a sharp decline in average prices. Meanwhile, trader count grew by 20%.
-
RWA-related NFT trading volume increased by 29%, ranking second among categories, with Courtyard emerging as the second-largest NFT marketplace by trading volume this quarter.
-
Guild of Guardians NFTs ranked first and fourth in trading volume, surpassing BAYC and CryptoPunks—a turning point signaling growing momentum for gaming NFTs.
-
Web3 lost $6.3 billion due to security incidents, a 215% increase quarter-on-quarter. The Mantra exploit alone accounted for $5.5 billion in losses, making it the second-largest crypto security incident since FTX’s collapse in 2022 ($8 billion lost).
1. Daily Active Unique Wallets Stabilize Around 24 Million; AI and Social Domains Show Strong Growth
DApp activity declined slightly by 2.5% this quarter, with daily active unique wallets averaging 24.3 million. Nevertheless, this level indicates that the ecosystem has stabilized—a sign of increasing maturity and sustained user engagement across multiple DApp categories. It's important to note that many users operate multiple wallets, so the number of unique wallets does not equate directly to actual user counts. Still, it remains a strong indicator of user participation. Just a few quarters ago, daily active unique wallets hovered around 5 million, highlighting the remarkable pace of growth.
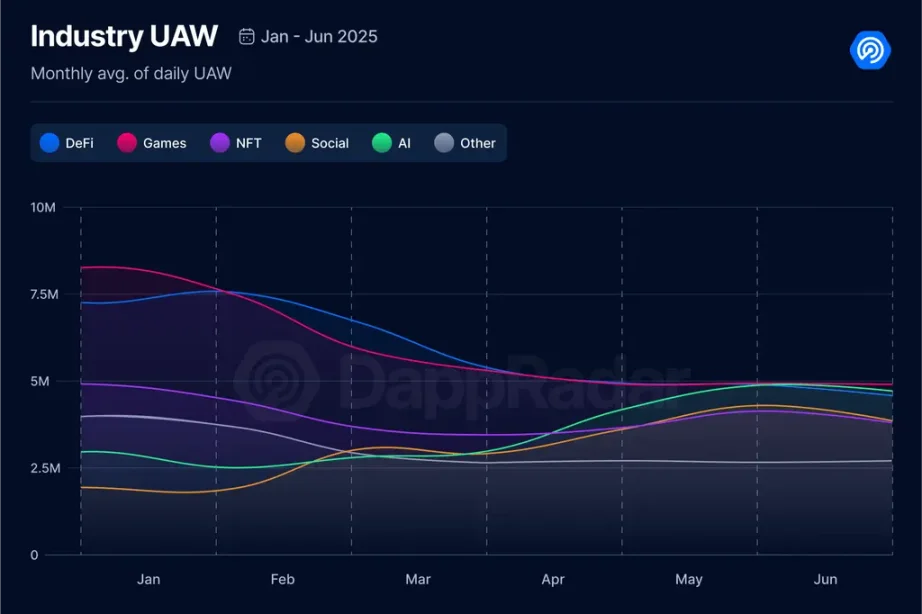
Both DeFi and GameFi saw declines in active wallet numbers, dropping 33% and 17% respectively. In contrast, Social and AI DApps achieved growth, aligning with broader industry trends.
In the Social space, InfoFi gained notable traction, led by platforms such as Kaito and Cookie DAO. In AI, agent-based DApps showed strong momentum, with Virtuals Protocol standing out.
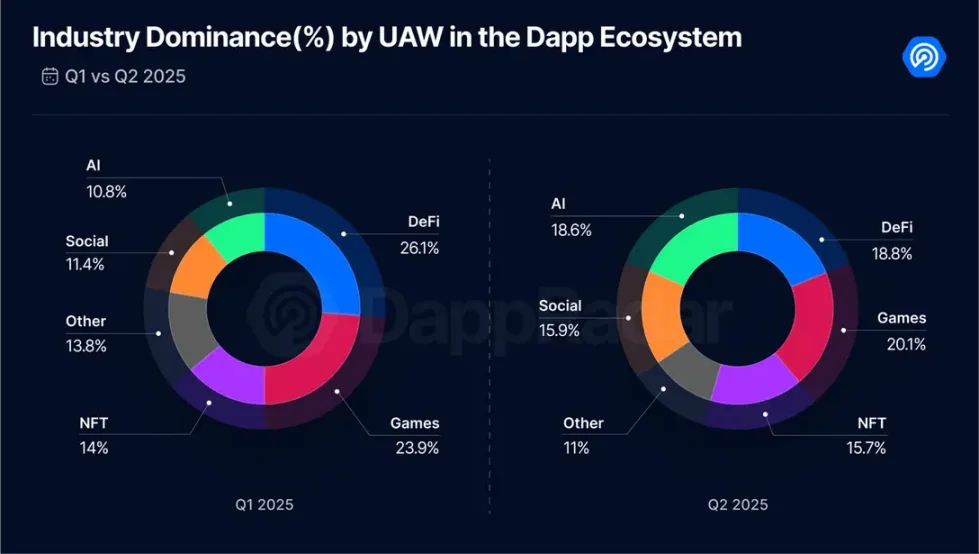
As expected, these category-level shifts influenced dominance distribution. Declines in DeFi and Gaming activity reduced their market share, while AI and Social captured and expanded theirs. Comparing Q2 2025 to Q1, AI’s rise is clearly accelerating, followed closely by Social. By year-end, it would not be surprising if AI overtakes either Gaming or DeFi in terms of dominance.
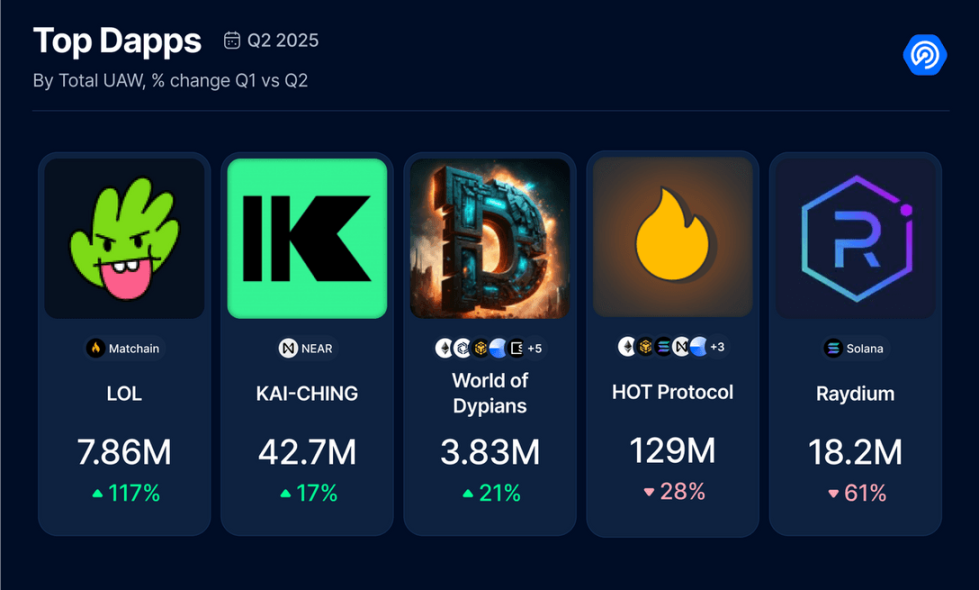
In fact, one AI-powered DApp topped the list of highest-ranked applications by unique wallet count this quarter.
The rest of the leaderboard features well-known projects, primarily from the DeFi space. Given their long-term stability amid meme coin frenzies and agent token speculation, this distribution is understandable.
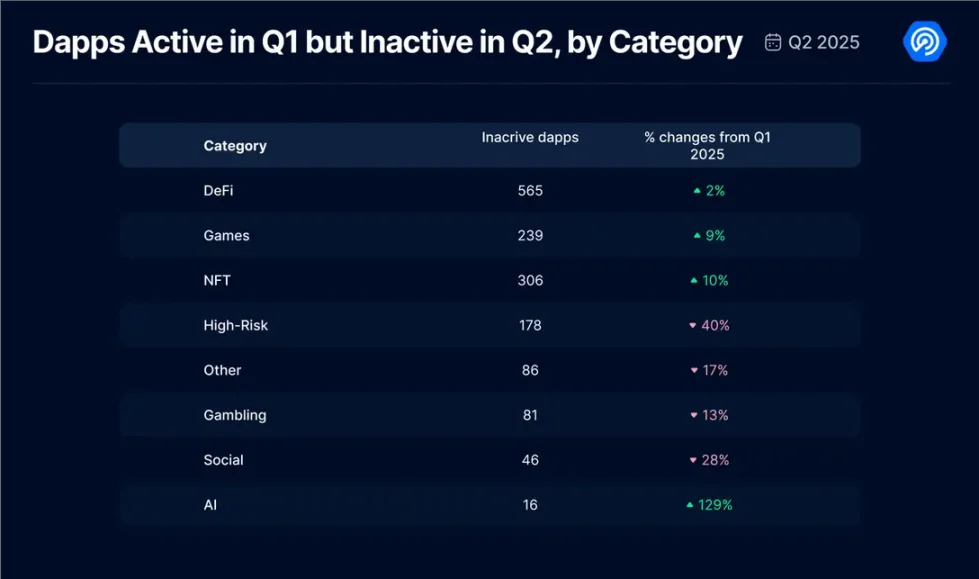
Another noteworthy metric introduced this quarter is "dormant DApps," tracking decentralized applications that were active in Q1 2025 but became completely inactive in Q2.
We analyzed several major categories: inactive DeFi apps rose by 2%, gaming apps by 9%, and NFT apps by 10%. High-risk applications were included in this analysis and surprisingly showed a 40% decrease in dormancy, indicating continued usage and low abandonment rates. Most striking, however, was the AI sector, where inactive AI apps surged by 129%. While this percentage seems alarming, it corresponds to only 16 applications. Nonetheless, it raises important questions: it highlights that many of these projects—especially in gaming and AI—are still in early stages, and without sufficient funding, achieving mainstream adoption remains extremely difficult. User retention continues to be Web3’s toughest challenge, and these figures underscore that reality.
2. DeFi TVL Soars to $200 Billion in Q2 2025, But Funding Drops 50%
The macroeconomic environment this quarter was rollercoaster-like, and DeFi did not escape unscathed. Despite the turbulence, positive signals emerged: crypto prices rebounded strongly, with Bitcoin rising 30% and Ethereum climbing 36% compared to Q1 2025, and total crypto market cap increasing 25% quarter-on-quarter. Naturally following this trend, DeFi’s total value locked (TVL) surpassed $200 billion, marking a 28% quarterly increase.
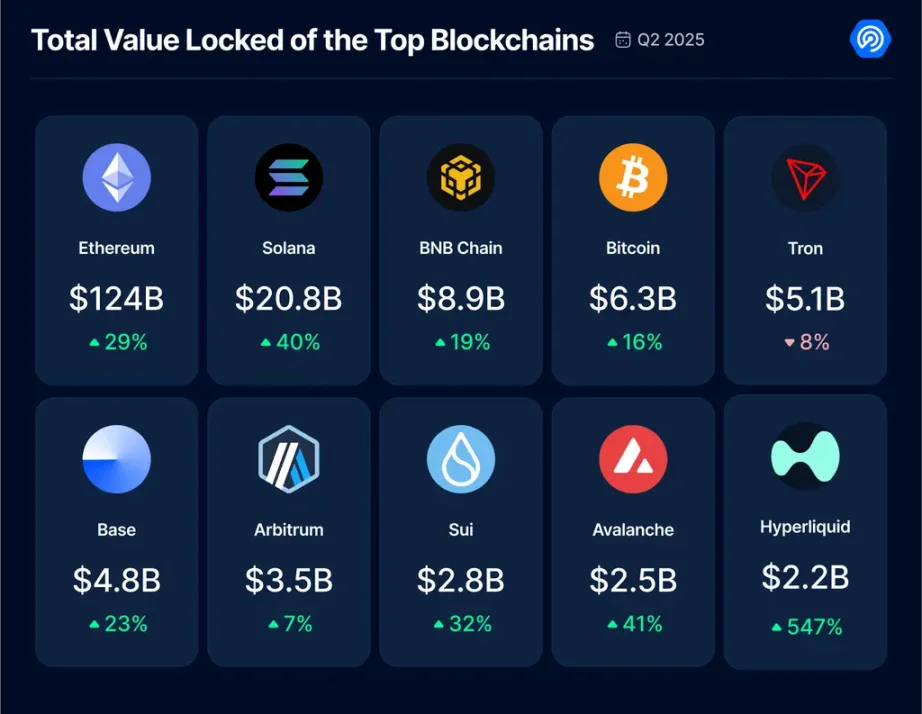
Looking at TVL performance across major blockchains, most recorded solid growth except for TRON, which declined by 8%. In terms of market share, Ethereum maintained its dominant lead with 62% of DeFi TVL, followed by Solana at 10%.
The standout performer this quarter was Hyperliquid L1, whose TVL surged 547%. This high-performance Layer-1 blockchain is designed specifically for on-chain perpetual contracts and spot trading, using a HotStuff-inspired consensus model called HyperBFT.
We also examined the most active DeFi DApps in Q2 2025 to better understand current areas of highest user engagement.
Finally, we analyzed investment inflows into DeFi during the quarter. A total of $483 million was raised, down 50% from Q1. Across the first two quarters of 2025, DeFi projects have raised approximately $1.4 billion. While this reflects a slowdown compared to previous cycles of explosive growth, it still demonstrates stable investor interest and may indicate a shift toward more mature capital allocation. We’ll watch how the remainder of the year unfolds, but for now, the trend appears to be stabilizing.
3. NFT Sales Volume Up 78%, But Transaction Value Down: RWA and Gaming Lead Market Shift
We all hoped for a revival in the NFT market. While overall attention persists, some core metrics remain concerning. NFT transaction value dropped sharply by 45% this quarter, yet transaction volume rose逆势 by 78%. This confirms a long-observed trend: NFTs are becoming more affordable, and although market fervor hasn't returned, its nature is evolving.
To better understand this transformation, we reviewed the top-performing NFT categories by transaction volume, revealing an intriguing pattern: new narratives are emerging, while older ones are making comebacks.
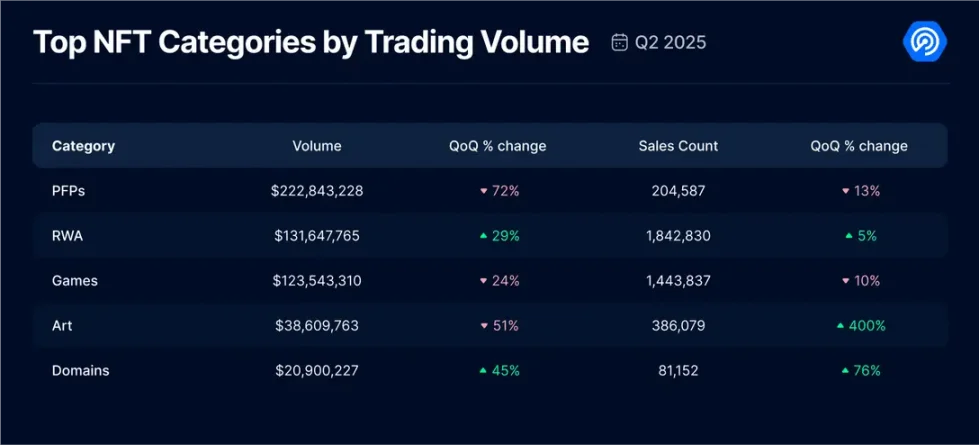
Data shows avatar NFTs suffered a 72% plunge in transaction value. Meanwhile, RWA-linked NFTs jumped 29% to rank second in transaction value. Art NFTs saw a 51% drop in value but a staggering 400% surge in transaction volume, suggesting significantly lower prices and greater accessibility for average buyers.
A recently resurgent trend is domain NFTs, with both sales volume and value climbing. This growth is primarily driven by the TON blockchain ecosystem, where Telegram users are rushing to buy numeric-based anonymous domains. These domains can be linked to Telegram accounts without requiring SIM card verification—an ideal use case fueling market demand.
Having identified trending categories, we turned to trader count to assess whether market participants are growing or returning.
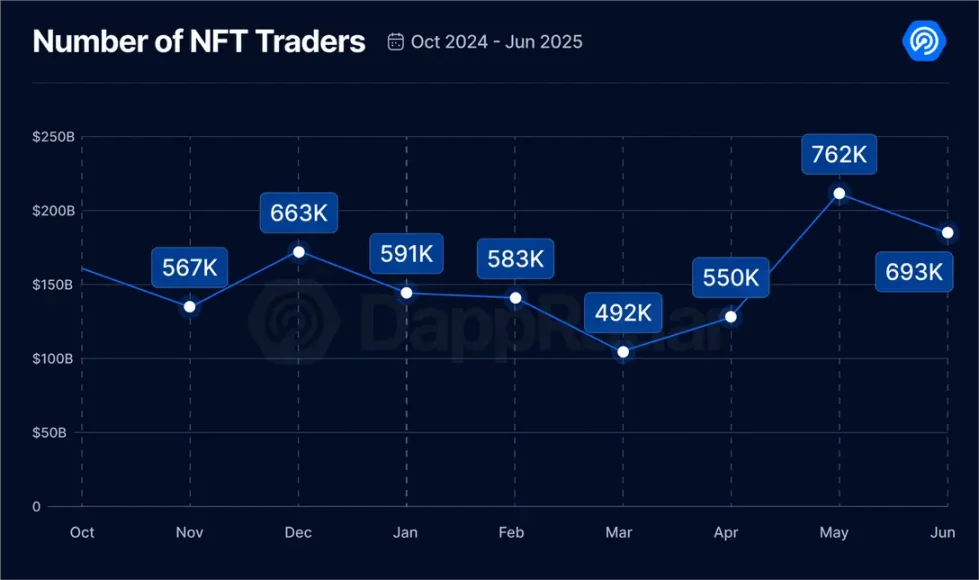
This quarter, the monthly average number of NFT traders reached 668,598, up 20% from last quarter. Combined with the surge in transaction volume, this suggests users are slowly and steadily returning to NFTs, albeit for reasons different from past speculative booms.
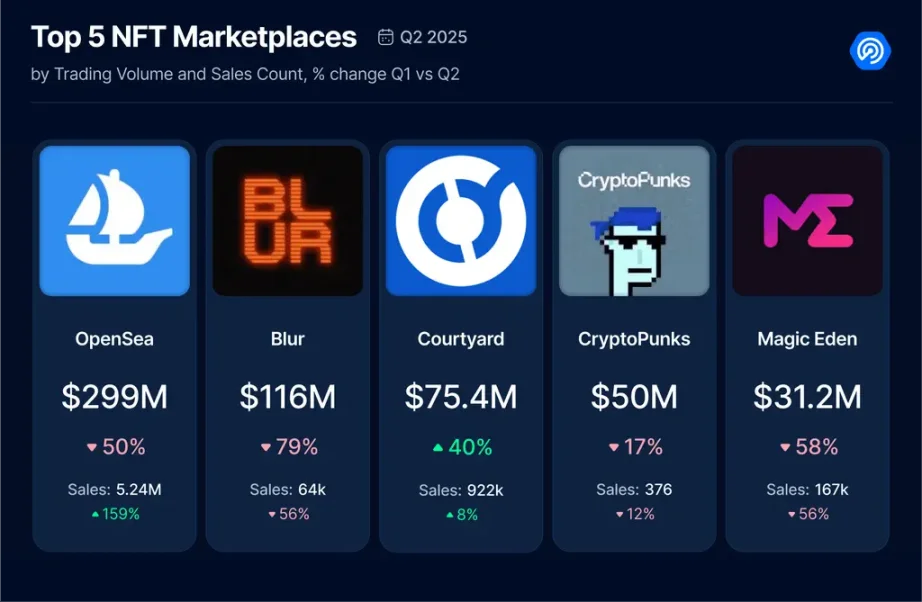
Despite declining transaction values, OpenSea retains its leading position. However, its sales volume is rising in tandem with Courtyard. OpenSea’s recent uptick is closely tied to news of its upcoming SEA token launch. The airdrop will reward both legacy users and those actively transacting on the updated platform. As a result, many users are now actively trading low-cost NFT collections to farm points and maximize potential rewards—a classic tactic seen in previous airdrops.
Meanwhile, Courtyard has rapidly climbed to second place in the industry. This clearly shows that the RWA narrative isn’t just gaining traction in DeFi—it’s creating waves in the NFT space too. Frankly, this development is encouraging. The tokenization of physical assets could become a key catalyst for bringing NFTs into the mainstream.
We also looked into which collections dominated in Q2 2025, and the findings revealed an unexpected shift.
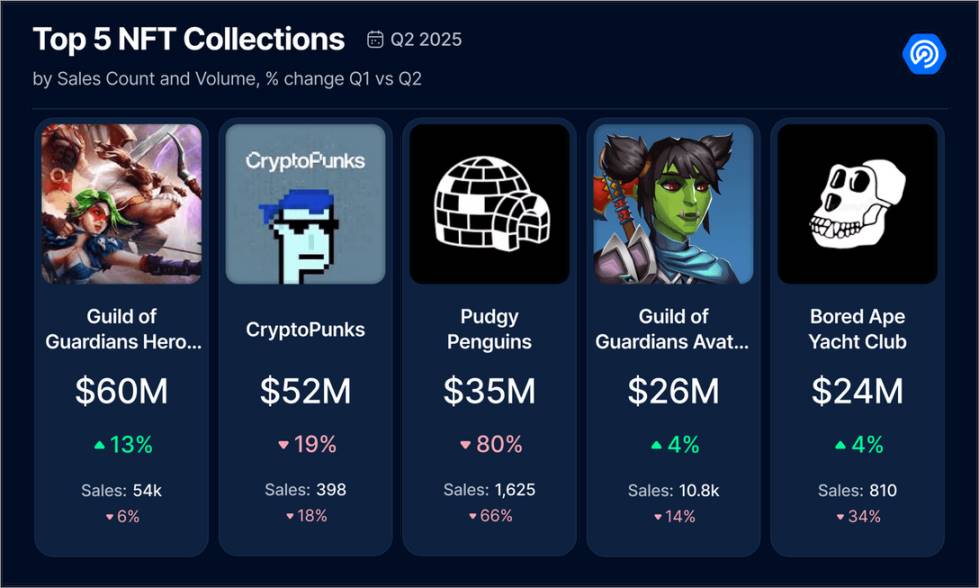
For the first time in quite a while—possibly years—a gaming NFT collection topped the quarterly transaction rankings. Guild of Guardians not only entered the top five but claimed two spots, surpassing blue-chip projects like CryptoPunks and Bored Ape Yacht Club. This validates our broader observation: Q2 NFT market activity was primarily driven by RWA and gaming assets. Now we finally have data backing this claim.
4. $6.3 Billion Lost in Q2 Due to Exploits—the Worst Quarter Since FTX Collapsed
We had hoped that after so many years, the industry would have learned its lessons, remained vigilant, treated user funds more carefully, and achieved at least a degree of maturity. Unfortunately, the reality this quarter was the opposite. In Q2 2025, Web3 lost $6.3 billion due to hacks and security vulnerabilities, a 215% increase from the previous quarter, marking one of the worst loss records since the FTX collapse.
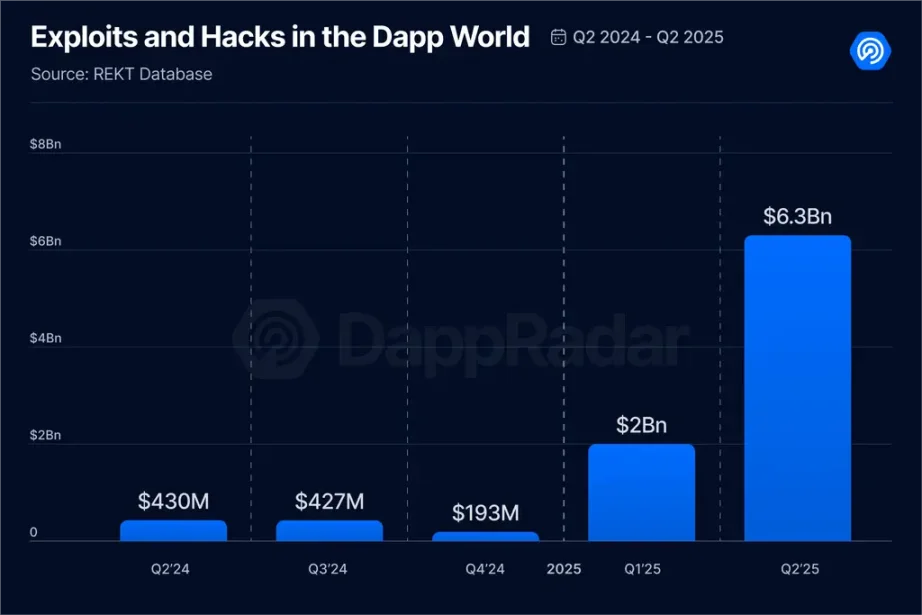
If there’s any silver lining—and it’s a very thin one—it’s that 87% of the losses stemmed from a single event: the Mantra crash. From one perspective, this might seem positive: only 31 security incidents occurred this quarter, a relatively low number, with severity concentrated in one case. Still, it forces us to ask: Are we really building more secure and reliable products, or are we simply getting lucky?
The top five incidents this quarter were:
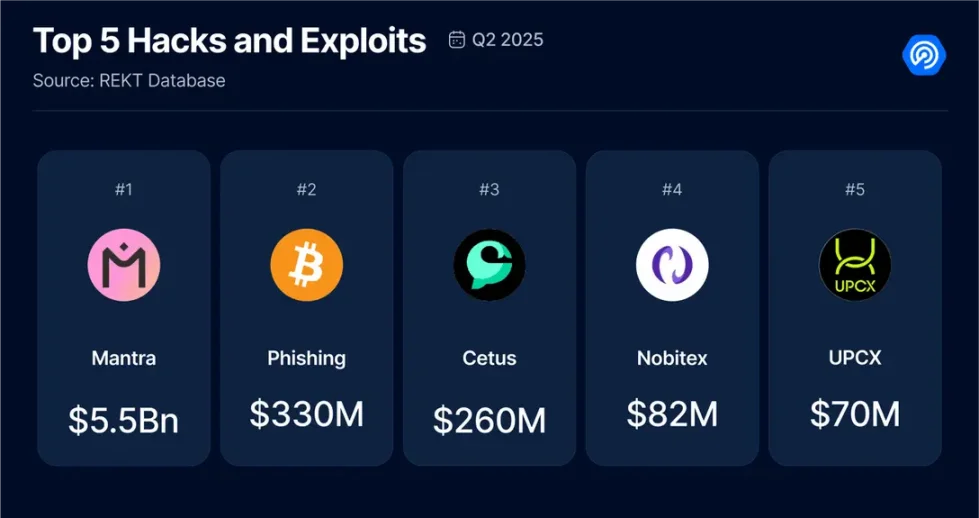
-
Mantra Insider Dump (April 13, 2025): OM token price crashed over 90%, wiping out $5.5 billion in market cap. Confirmed as coordinated insider selling, not a smart contract vulnerability.
-
Individual Private Key Theft (April 28, 2025): A personal crypto wallet was compromised via social engineering, losing 3,520 BTC (approx. $330.7 million).
-
Cetus Protocol Hack (May 22, 2025): Sui’s leading DEX was attacked, resulting in a $260 million theft. The platform token plunged over 90%, and smart contract operations were suspended.
-
Nobitex Exchange Hack (June 18, 2025): Iranian exchange Nobitex was breached, losing over $82 million. Pro-Israel hacker group Gonjeshke Darande claimed responsibility and threatened to leak internal code and user data.
-
UPCX Protocol Vulnerability (April 1, 2025): An attacker exploited the ProxyAdmin smart contract, performed unauthorized upgrades, abused admin privileges, and drained funds from three admin accounts in three transactions, stealing 18.4 million UPC tokens (worth approx. $70 million).
It’s deeply disheartening. It makes you question how much progress we've truly made. At the same time, we know many projects are actively working on stronger security infrastructure, audits, and emergency response plans.
As developers, investors, and users, the best we can do is stay secure, informed, and cautious.
Use tools like DappRadar to verify the projects you interact with. It’s not foolproof, but it’s a good starting point.
5. Conclusion
As Q2 2025 comes to a close, it’s clear that DApps are entering a new phase—one defined by integration and transformation. Although overall activity (measured by daily active wallets) has stabilized around 24 million, we’re witnessing clear shifts in user behavior and leading sectors. Emerging narratives like InfoFi and AI agent economies are propelling AI and social DApps forward. The NFT space is also transforming, with RWA and gaming assets taking center stage, signaling a directional shift from speculation to practical utility.
Even as capital cools, DeFi maintains its role as a core pillar, supported by strong TVL growth and price recovery. However, the surge in losses from exploits serves as a stark reminder: unchecked growth without robust security measures could ultimately hinder the industry’s progress.
One thing is clear: users haven’t left the space—they’ve simply chosen different ways to engage. The current challenge lies in building DApps that are not only compelling but also secure, sustainable, and capable of delivering real value. We will continue monitoring these developments and providing in-depth coverage.
Join TechFlow official community to stay tuned
Telegram:https://t.me/TechFlowDaily
X (Twitter):https://x.com/TechFlowPost
X (Twitter) EN:https://x.com/BlockFlow_News