Uncovering Potential Tokens: How to Build a P/E Ratio Monitoring System Using AI Models?
TechFlow Selected TechFlow Selected
Uncovering Potential Tokens: How to Build a P/E Ratio Monitoring System Using AI Models?
Teach you how to analyze the price-to-earnings ratio and build a corresponding monitoring system using AI models.
Author: Hoeem
Translation: Tim, PANews
What is the most overlooked metric in crypto? The price-to-earnings ratio (P/E). It helps you quickly determine whether a cryptocurrency is overvalued or undervalued, on the verge of a surge or hiding risks, a speculative gem or a bubble zone—and it reveals market sentiment.
This article will teach you how to analyze P/E ratios, but first, you need to understand this concept like a professional.
Understanding the Price-to-Earnings Ratio
1. Quickly Identify Overvalued and Undervalued Assets
P/E Ratio = Share Price per Share ÷ Earnings per Share
-
Indicates how much investors are willing to pay for each $1 of earnings
-
High P/E = Market expects growth (but may be overvalued)
-
Low P/E = Potential value investment opportunity or warning sign
2. Compare Protocols Within the Same Category
Rank similar companies or cryptocurrencies based on profitability
-
Project A has a P/E of 10; Project B has a P/E of 30
-
If they’re in the same sector with similar fundamentals, Project A might be undervalued
3. Gain Insight into Market Sentiment via P/E Ratios
The P/E ratio isn't just a number—it reflects market sentiment.
-
High P/E = Market optimism, hype, and growth expectations
-
Low P/E = Fear, doubt, or potential market mispricing
4. Conduct Scenario Analysis on Revenue
Raw profit ≠ The full truth
-
P/E ratios help place revenue in industry context.
-
It shows how the market values each dollar of net profit.
5. Identify Hidden Gems or High-Growth Candidates
-
Value investors favor low-P/E assets with strong fundamentals.
-
Growth investors chase high-P/E plays with room for rapid upside.
-
The key is understanding why the market prices them this way.
Bonus Tip
Think of the P/E ratio as a speedometer—it tells you how fast the market is pricing in expectations. But just as speed must be interpreted within context, valuations require background for a complete picture.
How to Quickly Calculate Crypto P/E Ratios
1. Visit DeFiLlama
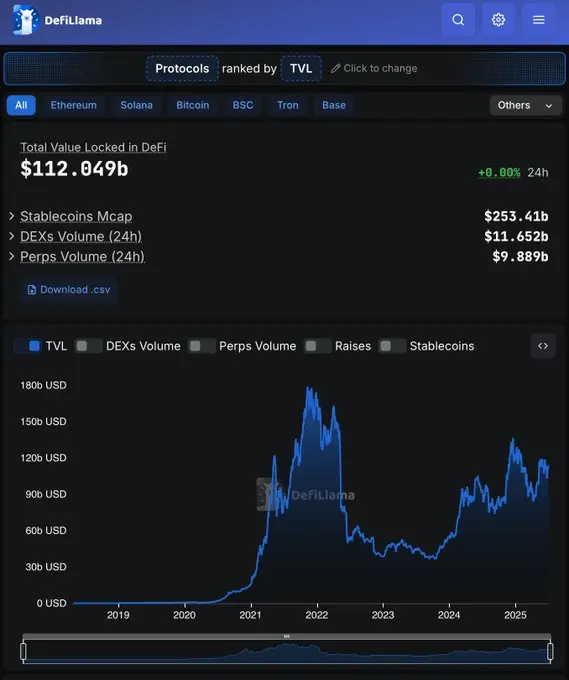
Alright, I’m on DeFiLlama now—what’s next?
2. Navigate to the “Revenue” and “Fees” Page
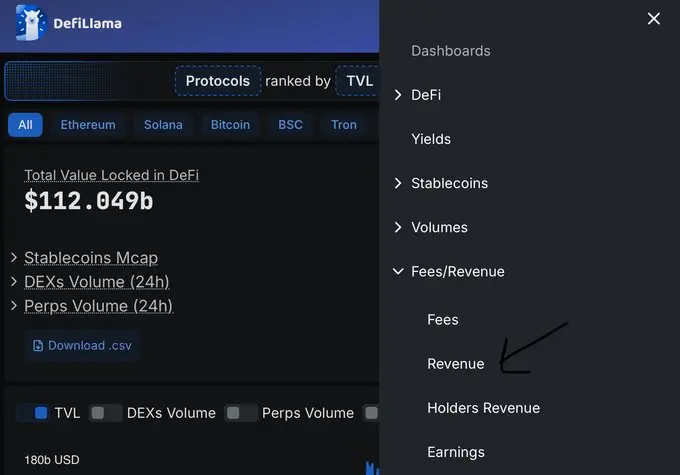
Got it, I found that section. What now?
3. Select Your Comparison Category
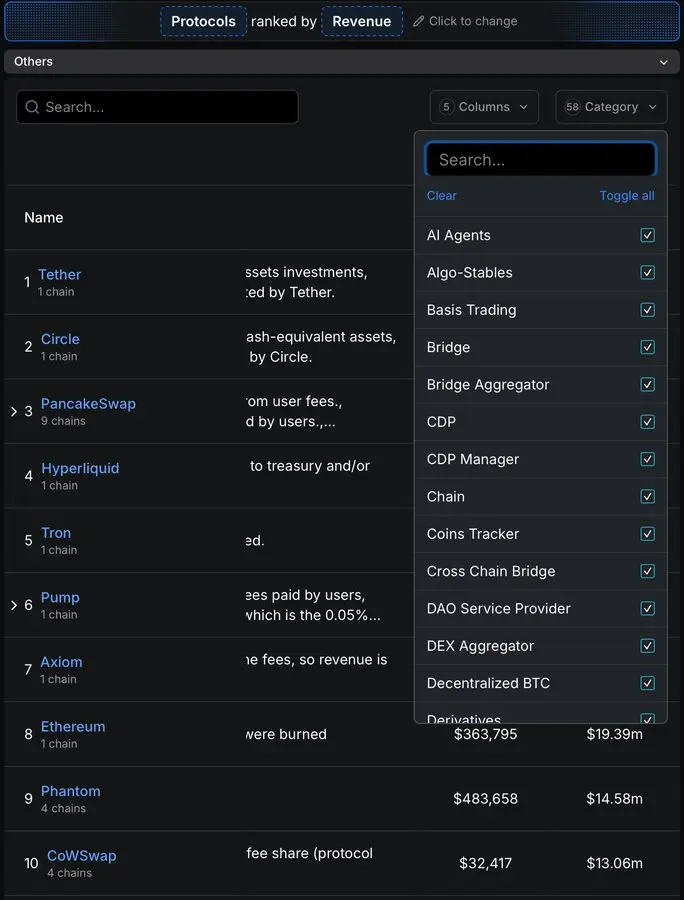
I see. I can compare them all at once—this makes the analysis fairer.
4. Click on “30-Day Revenue”
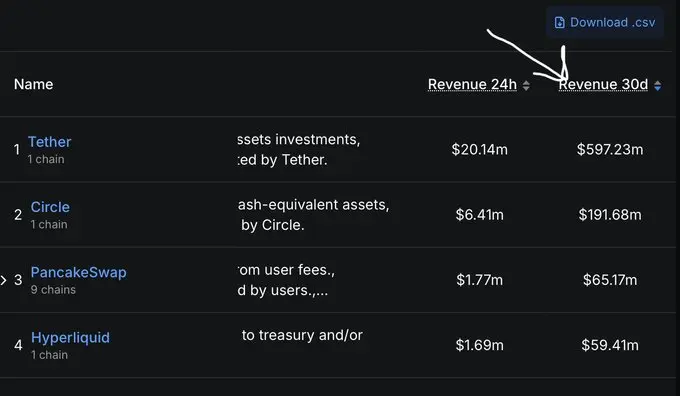
Yes, found it.
5. Take a Screenshot of the Data Page
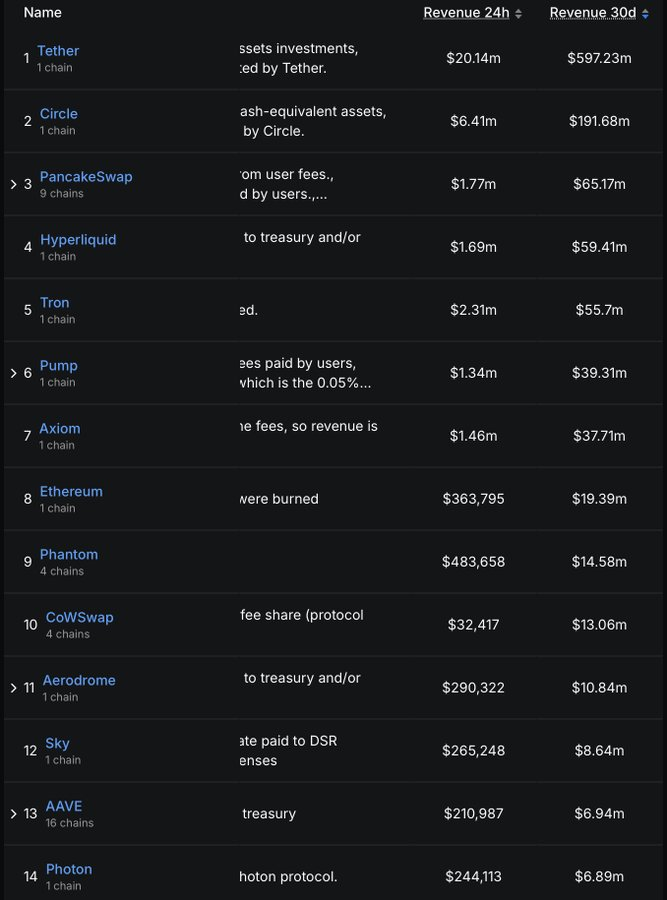
This step is super simple.
6. Open a Web-Connected Large Language Model Platform

7. Input the Prompt + Screenshot (copy and paste below)
Prompt
You are a professional cryptocurrency fundamental analyst.
Data Collection Process
-
Revenue – Extract the protocol's 30-day revenue (USD) from the provided DeFiLlama screenshot using OCR technology. Ignore any entries where revenue is empty or ≤0.
-
Market Cap & Fully Diluted Valuation (FDV) – Retrieve real-time data from CoinGecko or CoinMarketCap (preferably same-day data). Match by token symbol. Skip protocols missing either data point.
-
Category Focus – Only consider categories specified by the user on DeFiLlama (e.g., DEX, Lending, LST, Perps, etc.).
-
Filtering and Screening
-
Exclude protocols with P/E < 0 or > 1000
-
Calculate P/E = Market Cap ÷ (30-day Revenue × 12)
-
Return the top 20 projects with the lowest P/E (i.e., most "undervalued")
-
For each project, also calculate the “Revenue to FDV Ratio” = (30-day Revenue ÷ FDV) × 100%
-
Output: Generate a clean Markdown table sorted in ascending order by P/E, with an additional header row showing the average P/E and average Revenue-to-FDV ratio for the final list.
-
Format numbers using K/M/B abbreviations for readability.
Columns:
1. Protocol Name
2. Token Symbol
3. P/E
4. 30-Day Revenue (USD)
5. Circulating Market Cap (USD)
6. Fully Diluted Market Cap (FDV, USD)
7. Chain
8. Brief Description
9. Revenue-to-FDV Ratio (%)
Quality Checks – Ensure:
1. Both revenue and FDV are clearly presented.
2. Classification tags match DeFiLlama’s official categories.
3. Data is up-to-date (scraped from CoinGecko or CoinMarketCap within the last 48 hours).
4. Table is easy to read with no missing values.
Goal: Help cryptocurrency investors quickly identify potentially mispriced tokens within selected sectors using core metrics (P/E and Revenue-to-FDV ratio).
Example:
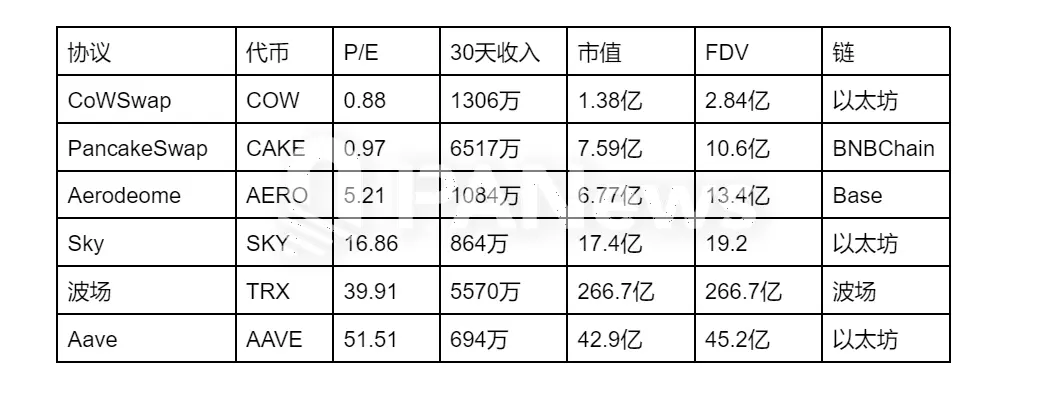
It’s also important to compare circulating market cap with fully diluted valuation and monitor upcoming token unlocks.
Now you understand how to use the P/E ratio—and how to find it.
Join TechFlow official community to stay tuned
Telegram:https://t.me/TechFlowDaily
X (Twitter):https://x.com/TechFlowPost
X (Twitter) EN:https://x.com/BlockFlow_News