CoinMarketCap Q1 Report: Overall Market Trading Volume Down by 20%, Fear Sentiment Significantly Increased
TechFlow Selected TechFlow Selected
CoinMarketCap Q1 Report: Overall Market Trading Volume Down by 20%, Fear Sentiment Significantly Increased
Q1 altcoin winter intensifies as Bitcoin season dominates the market.
Author: CoinMarketCap
Translation: TechFlow
Market Overview
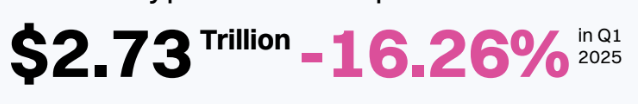
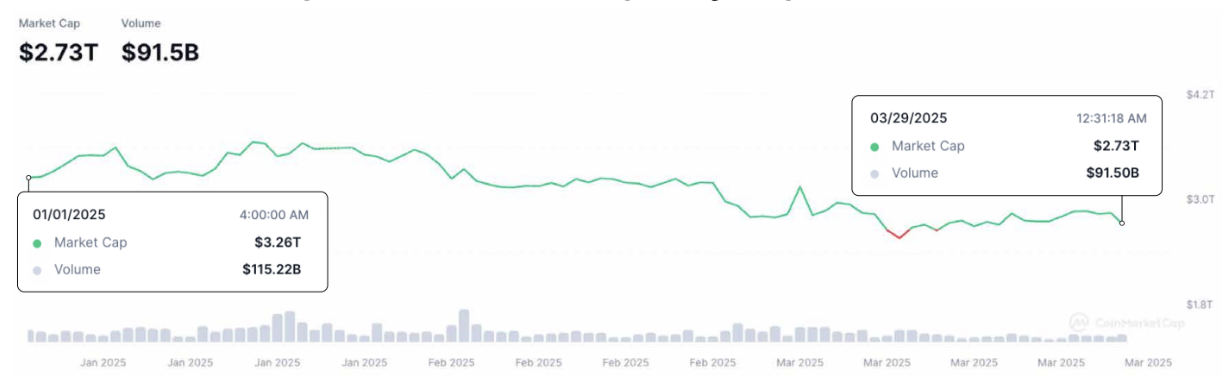
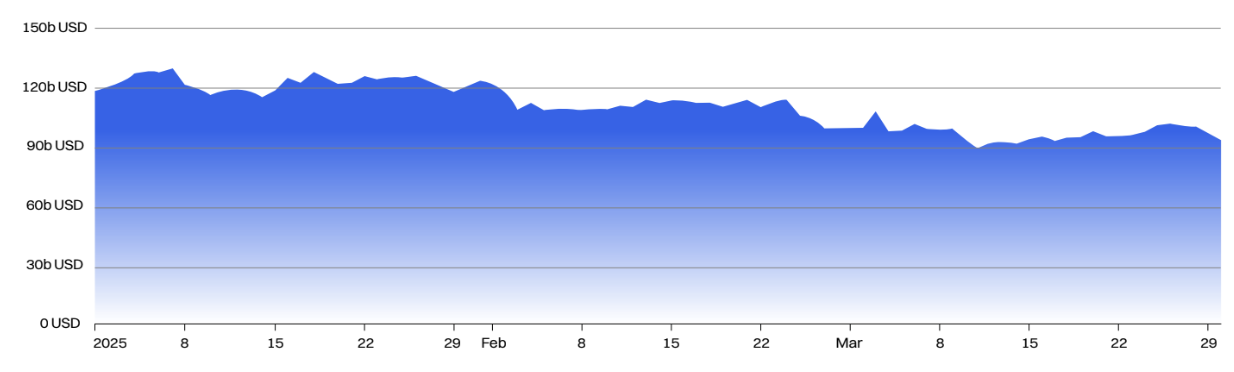
The global crypto market cap declined by around 16% in the first quarter, settling at approximately $2.7 trillion.
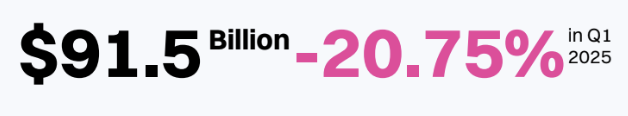
At the same time, daily trading volume in the crypto market dropped by about 20% in Q1, averaging around $90 billion.
Total Market Cap Down 16.2%; Liquidity Weakens
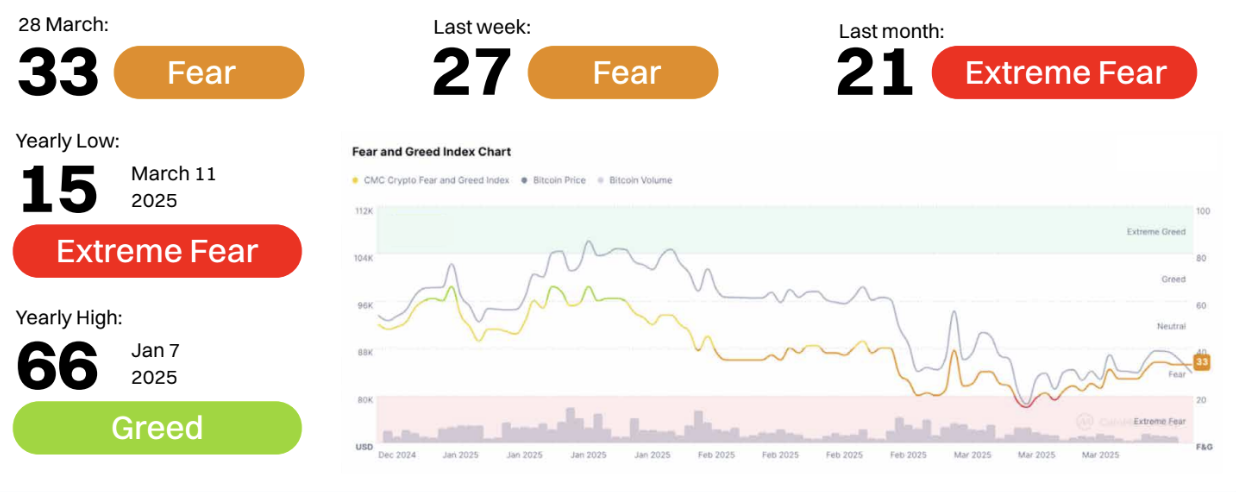
Q1 2025: Fear dominates, panic evident
Sentiment Trends: Q1 2025
Early March: Despite Bitcoin's price climbing to a local high above $84,000, market sentiment sharply deteriorated into the "extreme fear" zone, bottoming out at 15.
Mid to Late March: Although Bitcoin’s price and trading volume showed some resilience, market sentiment barely recovered, hovering between 21–33—still firmly in the “fear” range. Even amid ETF inflows and rising Bitcoin dominance, overall sentiment failed to enter “neutral” or “greed” territory throughout the entire quarter.
Key Insights:
-
Price-Sentiment Divergence: Despite Bitcoin holding relatively strong in the $78,000–$80,000 range, market sentiment turned unusually negative—indicating weak trader confidence and expectations of a potential pullback or correction.
-
Volatility and Uncertainty Dominate: High volatility (BTC at 51.88, ETH at 68.30), tightening liquidity, and declining interest in altcoins were likely key factors weighing on sentiment.
-
Is "Extreme Fear" an Accumulation Zone? Historically, “extreme fear” often signals buying opportunities. If macro sentiment improves, the low point on March 11 could be viewed retrospectively as such a moment.
Despite Bitcoin's relative resilience, fear dominated Q1 2025. The Fear & Greed Index remained below 40 for the entire quarter, reflecting fragile investor confidence. Unless positive macroeconomic or regulatory catalysts emerge, capital rotation toward riskier assets like altcoins may remain limited in Q2.
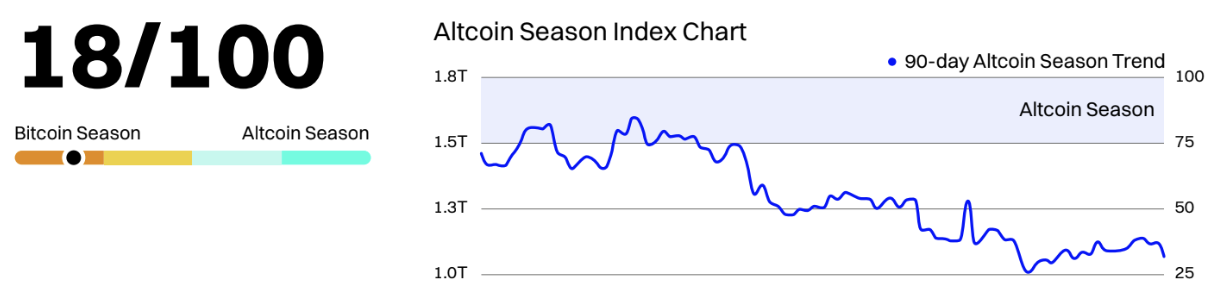
Q1 2025: Altcoin Winter Deepens, Bitcoin Season Dominates
By quarter-end, the CMC Altcoin Season Index stood at just 18, deep within the “Bitcoin season” zone. Throughout March, the index remained below 25, hitting a yearly low of 17 on March 12. This trend indicates significantly increased preference for Bitcoin, while altcoins broadly underperformed amid risk aversion and macro uncertainty.
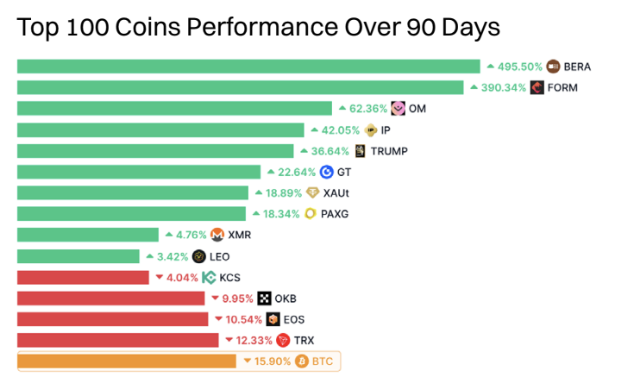
The chart showing the top 100 cryptocurrencies over the past 90 days further supports this. Only a few altcoins posted strong gains—BERA (+745.98%), FORM (+447.06%), and PIP (+89.20%) being rare exceptions. Most major altcoins suffered double-digit losses: SOL (-31.55%), LINK (-34.71%), and TON (-30.09%) reflect the harshness of this cycle. Even traditionally resilient tokens like ETH (-6.02%) and BNB (-14.64%) struggled to gain footing.
Q2 2025 Outlook: Early Signs of Capital Rotation?
Although Bitcoin’s dominance remains high at 61%, the Altcoin Season Index has slightly rebounded from its March lows—suggesting early signs of capital rotation. With many altcoins severely oversold and Bitcoin approaching the psychological resistance level of $85,000, any stagnation or consolidation in Bitcoin could prompt traders to seek bargains among altcoins.
However, two conditions must be met to truly ignite an “altcoin season” in Q2: 1) Bitcoin price stability (without sharp corrections), and 2) macro or regulatory catalysts (e.g., approval of a spot Ethereum ETF or successful L2 scaling). Monitor rising altcoin market cap relative to Bitcoin and sustained breaks above 25 in the Altcoin Season Index as leading indicators.
Q1 2025 Recap: Both Bitcoin and Ethereum Closed Lower—but Ethereum Fared Worse
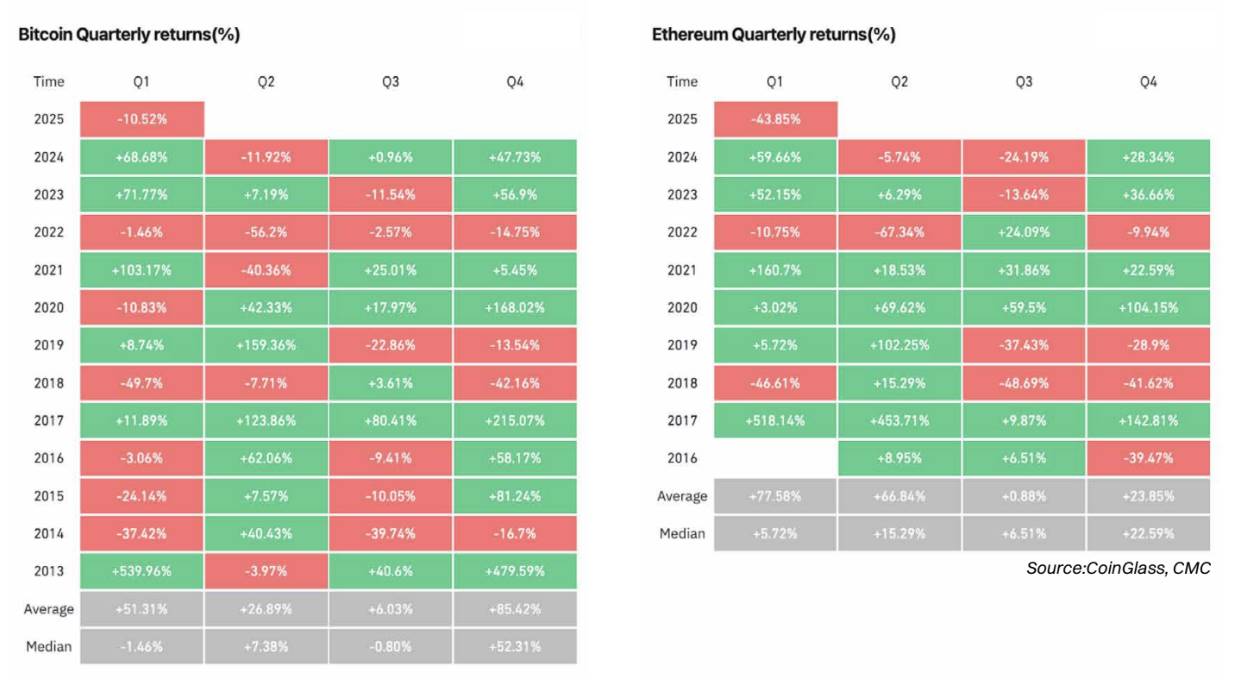
Bitcoin (BTC) fell 10.52% in Q1 2025, breaking its streak of strong first-quarter performances in 2023 (+71.77%) and 2024 (+68.68%). Despite a strong January (+9.29%), a sharp February drop (-17.39%) erased those gains, and March failed to regain momentum. This correction reflects growing caution driven by macro uncertainty, ETF saturation, and declining retail activity.
Ethereum (ETH) performed significantly worse, plunging 43.85% in Q1—the largest quarterly decline since 2018. This correction followed overheated gains at the end of 2024 and was fueled by high volatility, the unfortunate Bybit hack, and lack of new growth narratives. Its poor performance relative to Bitcoin again reflects the sharp drop in the Altcoin Season Index and shows why market capital shifted toward Bitcoin as a relative safe haven.
Q2 2025 Outlook: Bitcoin Resilience, Potential Ethereum Rebound?
Historically, Bitcoin tends to perform moderately in April (median return +5.04%), but May and June are often weaker. If Bitcoin holds above current support levels of $80,000, a breakout in Q2 is possible—especially if macro conditions improve (e.g., rate cuts or stablecoin demand). Watch ETF flows and compression in volatility as early bullish signals.
After heavy selling in Q1, Ethereum may be setting up for a relief rally. With a median Q2 return of +15.29%, its underperformance could attract rotational capital, especially if narratives around a spot Ethereum ETF or Layer-2 growth return. However, technicals and market sentiment remain fragile, so any upward move will likely require Bitcoin stability as a foundation.
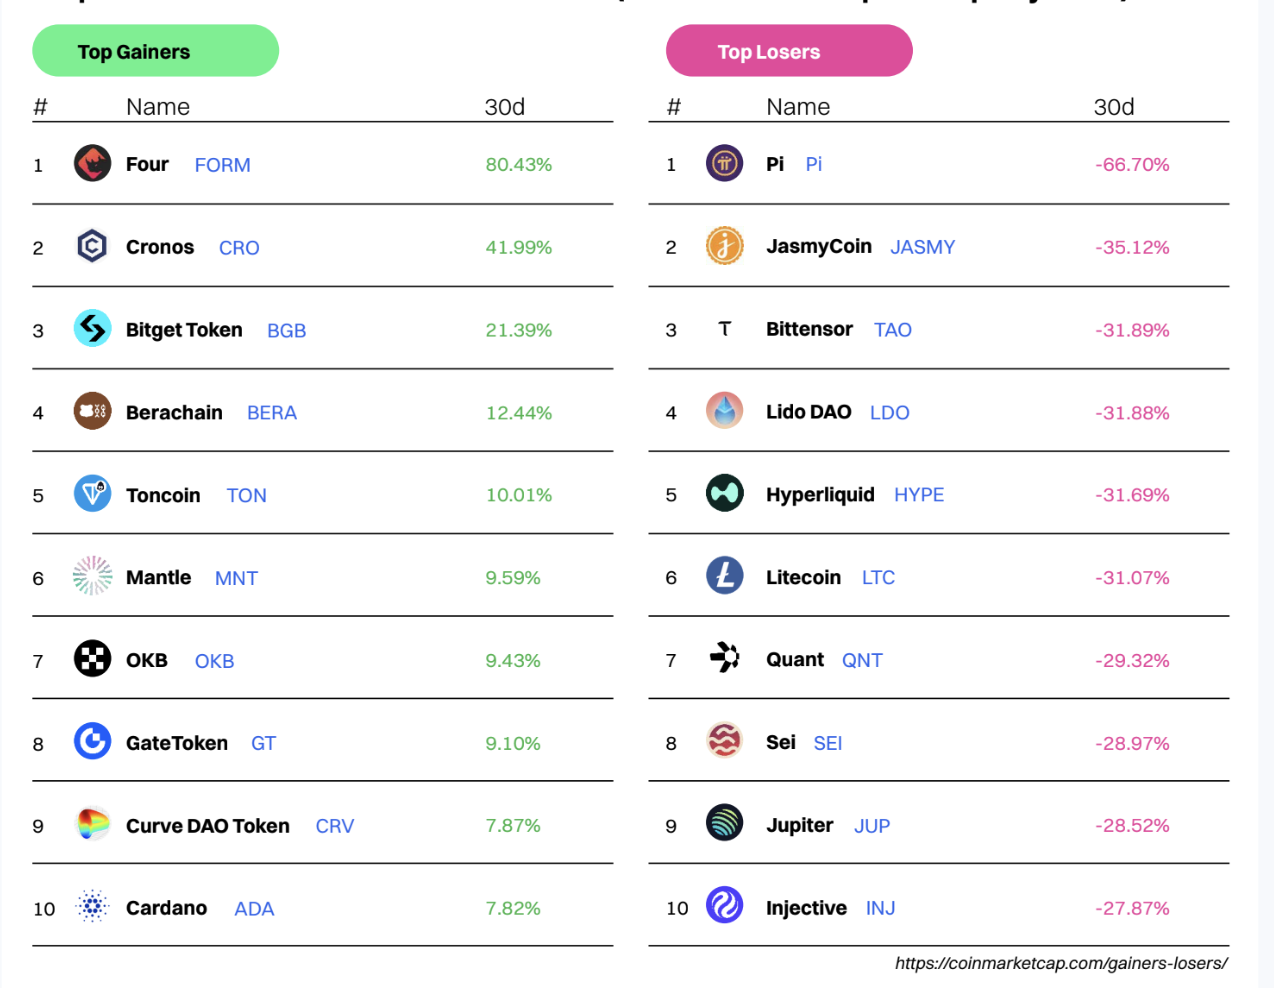
Largest Gainers and Losers of the Month (Among CMC Top 100 Projects)
Market Sentiment: Revealing Unique CMC Data
CoinMarketCap is the world’s most visited cryptocurrency website and the leading source for crypto data, insights, and community. By analyzing general browsing patterns across our millions of users, we can detect emerging trends and shifting priorities within the global crypto community.
In this section, we reveal exclusive CMC data covering:
-
Most Popular CMC Categories
-
Top Coins by Category
-
Global CMC User Distribution
-
Most Popular Coins by Region
Most Popular CMC Sectors
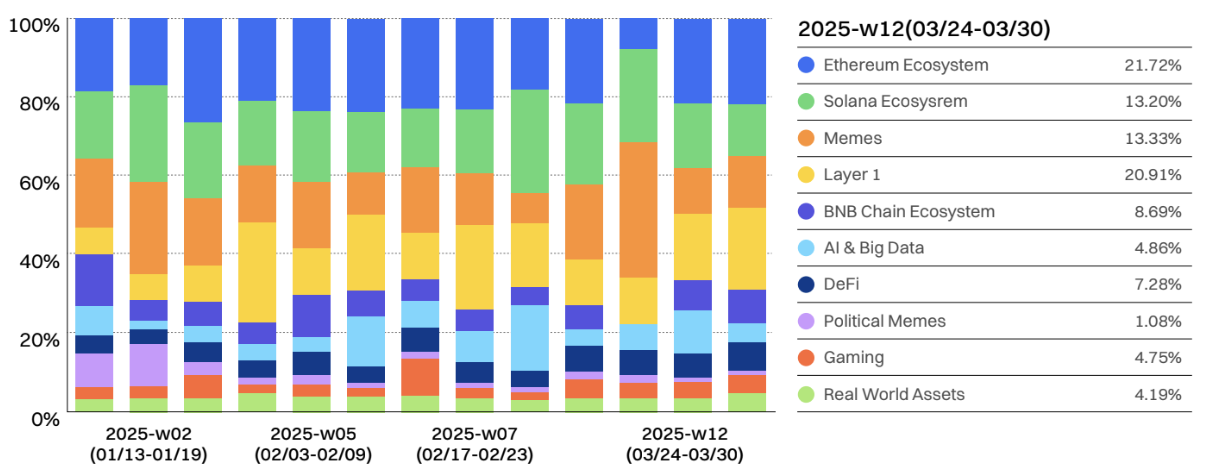
From Hype to Fundamentals: Market Focus Shifts from Meme Coins and AI to DeFi and Layer 1
At the beginning of 2025, speculative activity surged (driven by meme coins, AI, and hype-driven narratives), followed by a shift back toward infrastructure (BNB Chain, Solana, and DeFi) by late March. This suggests that after periods of excitement, investors tend to return to proven ecosystems in search of sustainable opportunities.
Reviewing Q1 2025, we observed:
-
Meme Coin and Layer 1 Surge (mid-January to February)
Market sentiment may have been affected by high volatility (Bitcoin at 51.88, Ethereum at 68.30), tightening liquidity, and declining altcoin interest. Historically, extreme fear often signals accumulation opportunities. If macro sentiment improves, the March 11 low might be seen in hindsight as such a moment. Bitcoin held relatively firm above $78,000–$80,000, yet market sentiment was extremely negative—suggesting weak trader confidence and anticipation of reversal or correction.
-
AI and Big Data Peak (early February)
In Week 5 (Feb 3–9), interest in AI and big data rose, possibly driven by broader AI-driven narratives in tech and crypto. However, enthusiasm waned in subsequent weeks, suggesting AI’s dominance in crypto discussions remains intermittent rather than sustained.
-
Solana and Ethereum Ecosystem Stability
The Solana ecosystem remained strong despite fluctuations in relative share. The Ethereum ecosystem drew significant attention due to the Bybit ETH hack and ETH’s underperformance, generating substantial page views.
-
Real World Assets (RWA)—Still Struggling for Attention
Despite ongoing discussion of real-world assets (RWA) as a long-term growth area for crypto, their share remains below 5%, indicating institutional adoption is still evolving.
-
End of March (Week 12)—Return to Fundamentals?
By Week 12 (March 24–30), we saw strong growth in the BNB ecosystem (8.69%). Layer 1 (20.91%) consolidated its dominance, suggesting the market may be shifting toward more fundamental crypto infrastructure rather than short-term hype cycles. Meme coins (13.33%) remained strong, indicating speculative interest persists, but AI, gaming, and RWA continue to struggle in capturing sustained attention.
Hottest Coins by Sector
Top 10 Most Watched Coins Under Trending Categories
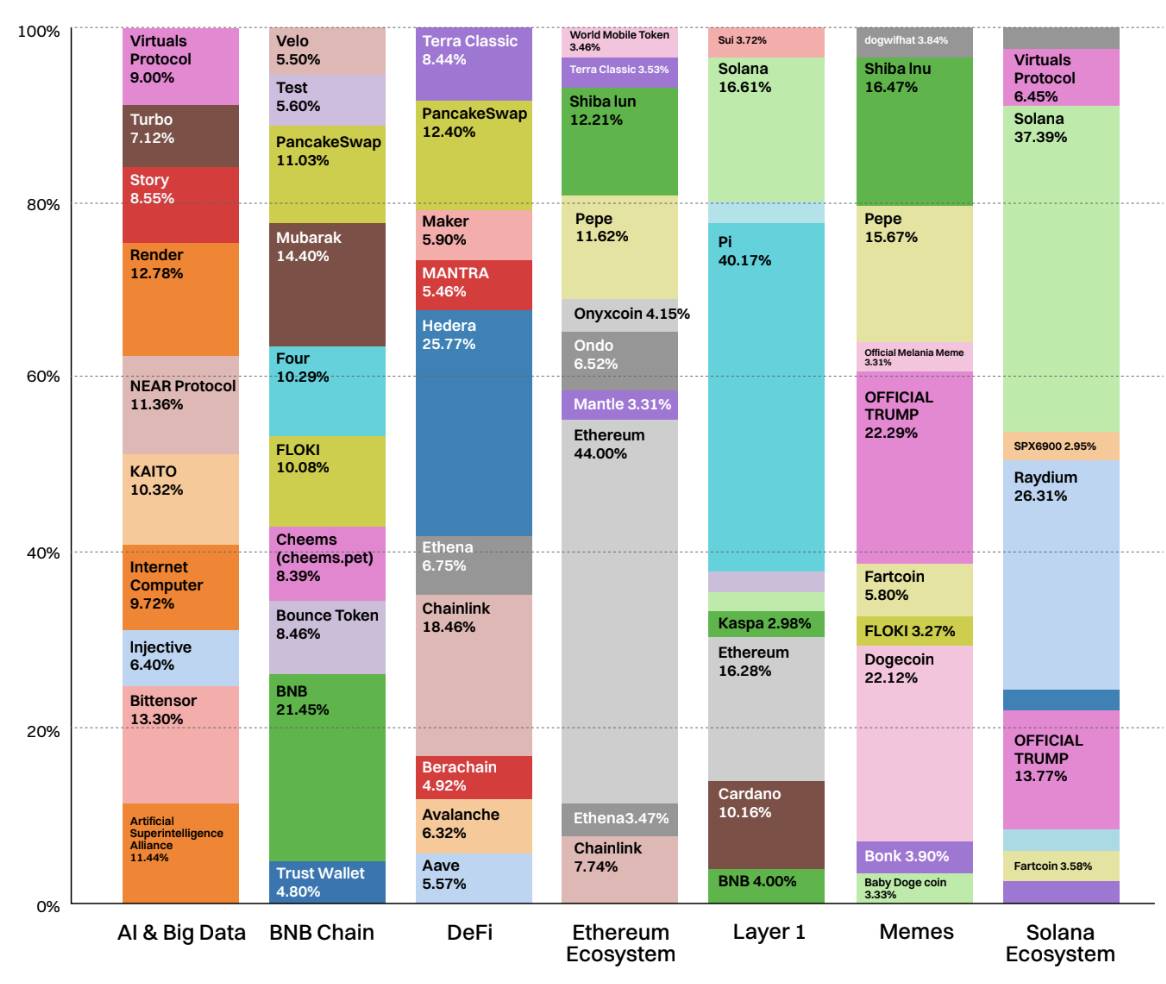
This chart highlights the top 10 coins with the highest page views in each trending category on CoinMarketCap, offering a snapshot of where user interest is concentrated. A notable trend is the surge in retail interest in the BNB Chain ecosystem, driven by its diverse mix of DeFi, infrastructure, and meme assets—making it a compelling growth narrative to watch. BNB itself led the category, capturing 21.5% of total page views.
Following closely are meme-centric tokens such as Mubarak (14.4%), FLOKI (10.1%), Cheems (8.4%), and Test (5.6%), which boosted ecosystem visibility—indicating a blend of utility and community-driven hype.
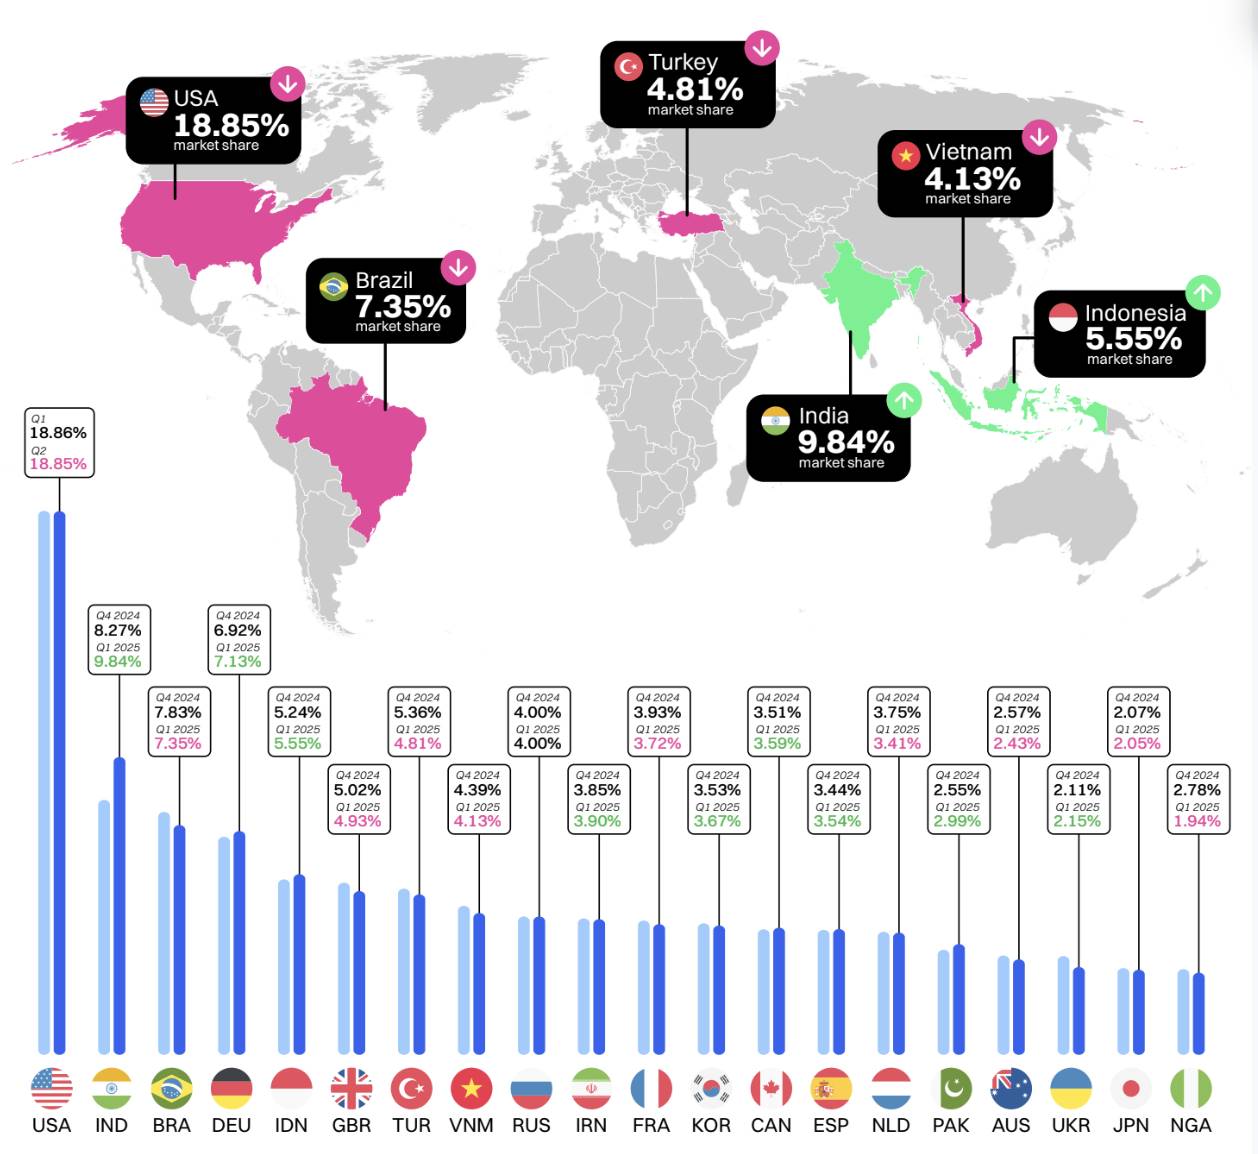
CMC Users Around the World
Between Q4 2024 and Q1 2025, global crypto user distribution remained relatively stable, with the U.S. maintaining the top spot at approximately 18.8%. However, India narrowed the gap, rising from 8.27% to 9.84%, driven by AI agent and political meme trends.
The continued presence of emerging markets like Brazil, Indonesia, Vietnam, and Turkey suggests that crypto remains an attractive financial alternative in economically volatile countries. Overall, Q1 trends indicate a slight shift toward developing markets, further reinforcing crypto’s role as a frontier of global decentralized finance.
Most Popular Coins by Region
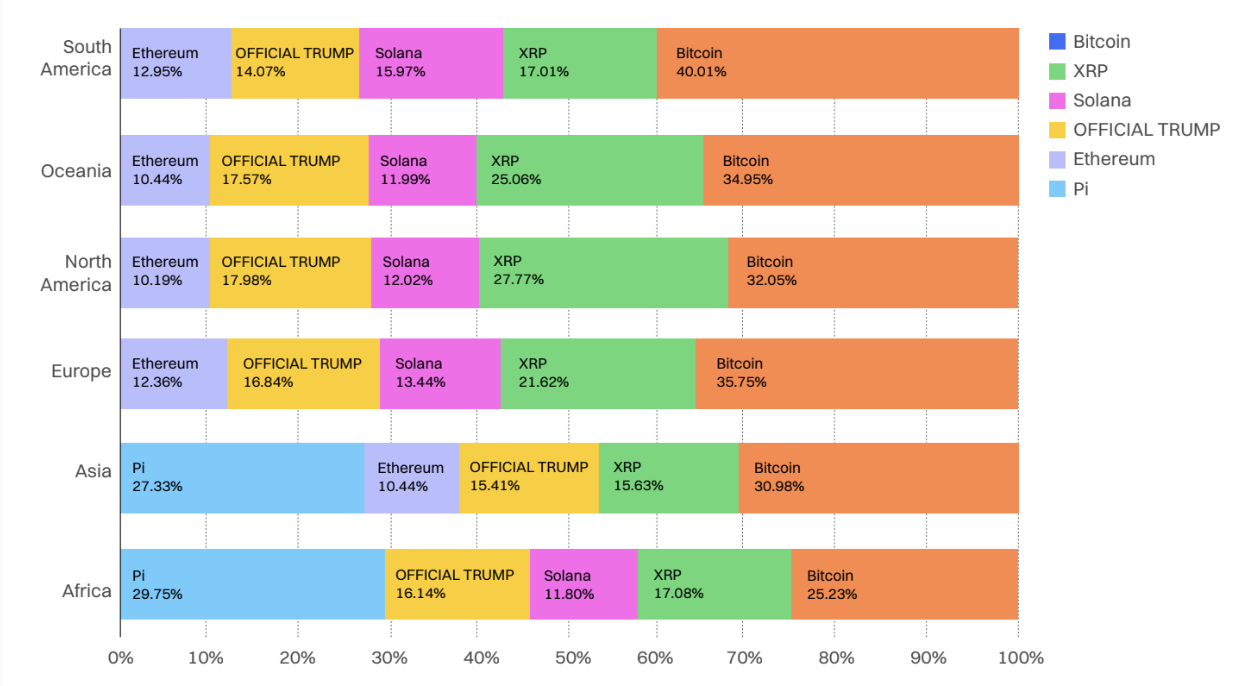
January 2025: Bitcoin led in most regions, while OFFICIAL TRUMP surged in North America and Asia. XRP, Solana, and Ethereum remained stable, while newer tokens like Dogecoin gained regional traction.
February 2025: Pi Network exploded in popularity, dominating in Asia (37.7%) and Africa (43%). Bitcoin remained the global leader, especially in the Americas and Oceania. XRP and Solana continued strong across all regions.
March 2025: OFFICIAL TRUMP made a comeback in Western markets, particularly North America and Oceania. Bitcoin maintained global leadership. Pi remained dominant in Asia and Africa, while XRP, Solana, and Ethereum stayed core focus areas.
Current Trends (March 2025): Bitcoin is the most viewed coin globally. Pi dominates in Asia and Africa, while XRP and Solana show strong cross-regional appeal. OFFICIAL TRUMP shows notable Western trends but may be cooling down.
CMC Community’s Most Bullish/Bearish Sentiment Rankings
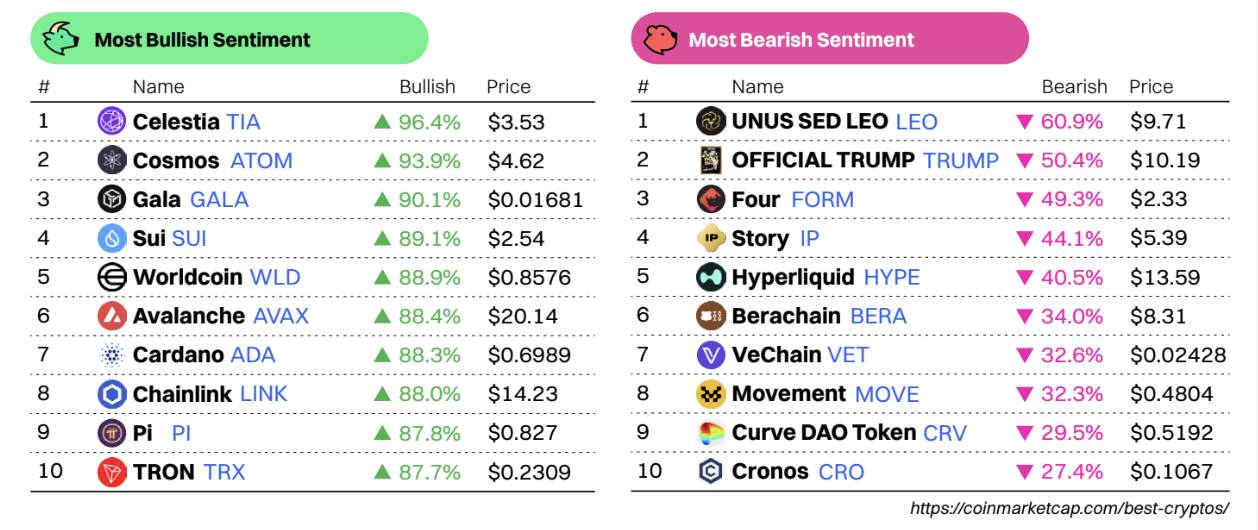
Bullish Sentiment Rises Despite Price Drops
Projects like Celestia (TIA), Cosmos (ATOM), Gala (GALA), and Sui (SUI) showed unusually strong bullish sentiment (>89%) in the CMC community, despite many seeing 5–10% price declines. This suggests the community views these drops as buying opportunities, not weakness. Worldcoin (WLD) and Avalanche (AVAX) also stood out with high optimism amid sharp price falls.
Bearish Sentiment Targets OFFICIAL TRUMP and Curve DAO (CRV)
OFFICIAL TRUMP continues to provoke extreme reactions in the community, ranking second in bearish sentiment (50.4%) and reappearing in daily bearish trends—hinting at fading hype or disappointment. Meanwhile, CRV topped daily bearish trends (-17.2%), reflecting growing skepticism about the price trajectory of this DeFi blue-chip.
Strong Overlap Between Bullish and Trending Tokens
Tokens like Celestia, Cosmos, Gala, and TRON appear on both “Most Bullish” and “Daily Bullish Trends” lists—indicating not only high sentiment but rapid momentum, potentially signaling price reversals or narrative acceleration.
Emerging Narratives to Watch
The CMC Daily Bullish Trends page is a useful tool for tracking tokens rapidly gaining bullish momentum—monitoring these may reveal the next narrative hotspots. Recent daily trends show surprising strength in sentiment, hinting at community revival or renewed interest in technically focused projects.
Summary
Despite price declines, sentiment is warming around modular chains (Celestia), Layer 1s (SUI, AVAX), and community-led projects (Pi, Gala). Meanwhile, former hype tokens like OFFICIAL TRUMP and CRV face rising bearish sentiment, suggesting retail focus may be shifting toward fundamentals and long-term investing.
Market Pulse
Layer-1 (L1)
Ethereum Suffered Largest Losses in Q1 2025
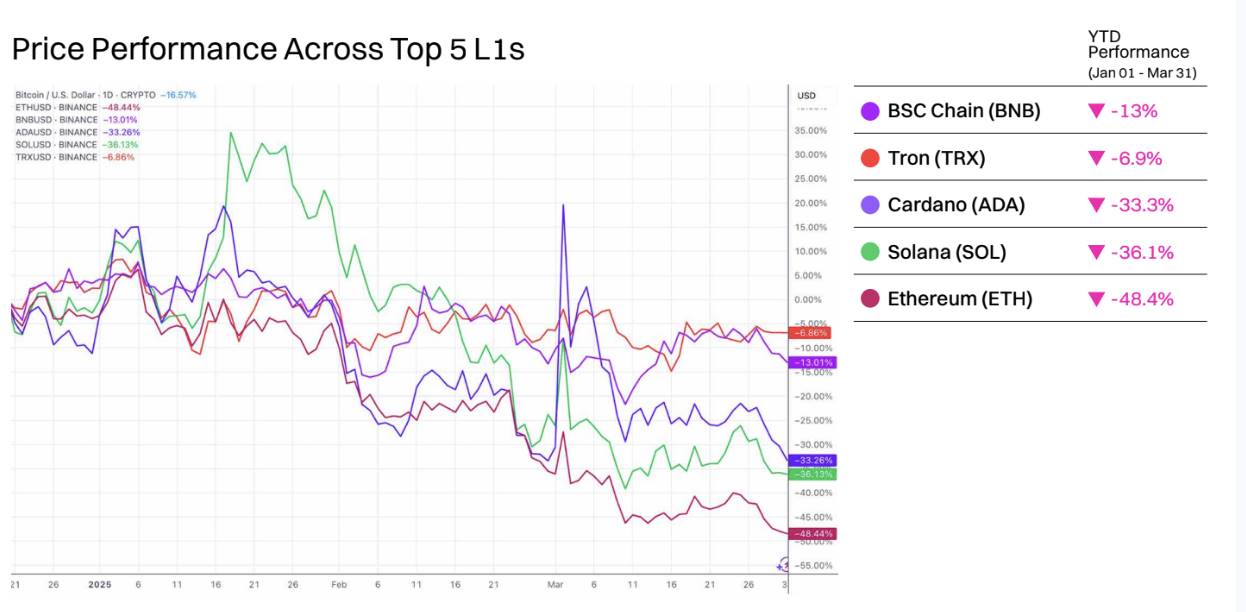
All top five L1s by market cap declined year-to-date, with Ethereum (ETH) suffering the steepest drop at 48.4%.
BNB fared relatively better, down only 13%. This may be partly attributed to recent successes of on-chain meme coins, including high-profile launches like Tutorial (TUT) and CZ’s Dog (BROCCOLI) in Q1 alone. The launch of a $100 million liquidity incentive program and the recent Pascal hard fork boosted confidence in the chain.
TRX also showed resilience despite weak market conditions. Zero-fee stablecoin transactions were enabled on-chain, and its leadership aims to capture market share from Ethereum. With growing DeFi revenue on-chain and planned upgrades like tokenless payment fees and zero-fee meme coin trading set for 2025, Tron largely resisted downward pressure.
Cardano failed to sustain momentum following excitement over native ADA assets being included in U.S. digital asset reserves, falling 33.3%. Solana saw sharp price declines, down 36.1% YTD, due to large token unlocks and significantly reduced meme coin trading volume.
Ethereum faced multiple adverse events in Q1 2025, including the theft of approximately $1.5 billion worth of ETH and Ethereum-based tokens from crypto exchange Bybit on February 21—most of which were laundered into Bitcoin (BTC). Additionally, outflows from popular ETH ETFs accelerated during the quarter, with multiple consecutive weeks of net outflows. In total, at least $240 million worth of ETH was withdrawn from ETH ETFs in Q1. Ethereum’s long-awaited Pectra upgrade was also delayed due to preparation issues and is now scheduled for mainnet deployment on April 30, 2025.
Daily Active Addresses of Major Layer-1 Blockchains
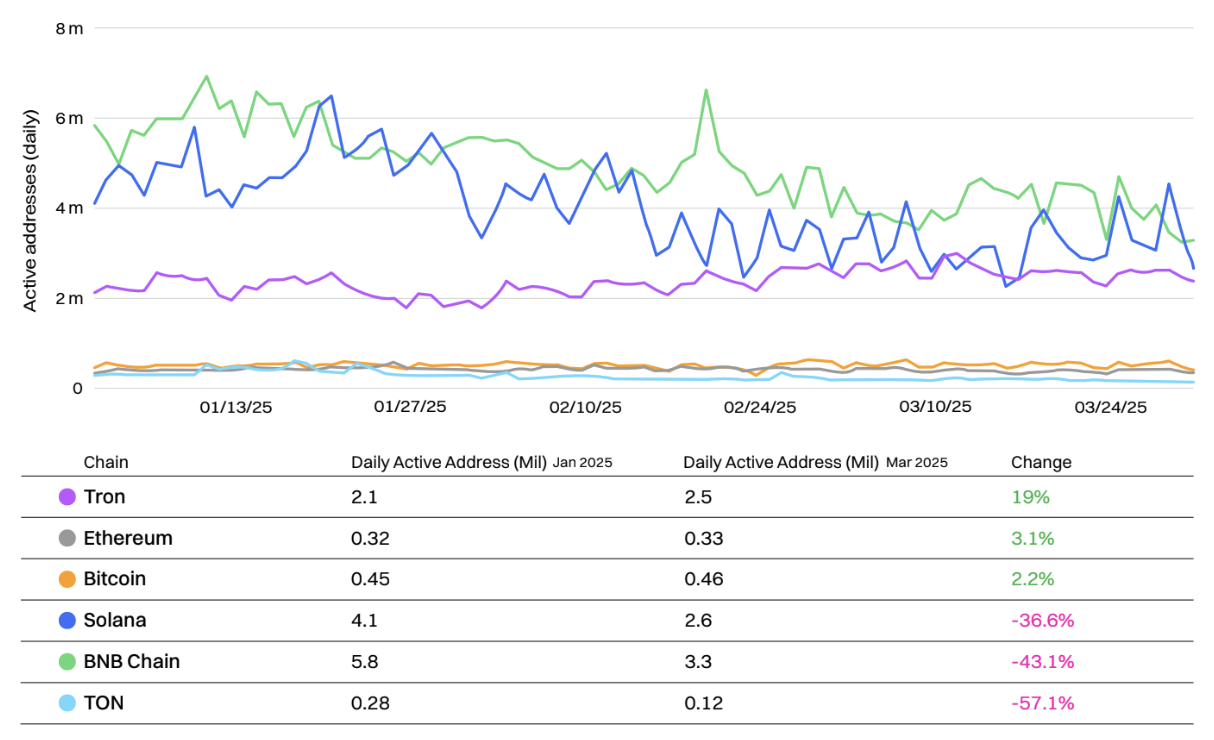
Many smaller L1s saw declining on-chain activity in Q1 2025, starting strong in January but weakening from February onward.
In absolute daily active addresses, BNB Chain started strong and led competitors early, but was gradually overtaken by Solana—finally surpassed by late March. Reduced meme coin speculation and a brief outage in February may have contributed to Solana’s decline. The upcoming Firedancer upgrade remains highly anticipated by users.
BNB Chain experienced a brief spike in on-chain activity in February, coinciding with the release of the BNB Chain 2025 roadmap and the Pascal upgrade.
Bitcoin, TRON, and Ethereum successfully resisted downtrends, posting YTD growth in active addresses. Tron led in this regard with 19% YTD growth, followed by Ethereum at 3.1%, and Bitcoin at 2.2%—despite declines in the value of these assets during the same period.
TON’s on-chain active addresses dropped over 50%, from 280,000 to 120,000, as most Telegram mini-apps lost users and farming-related hype faded. Hamster Kombat, once the platform’s most popular mini-app, lost nearly two-thirds of its active users YTD.
Note, however, that one address does not necessarily equal one user. Lower-fee blockchains typically see more on-chain bot activity and more smart contract-controlled addresses, which can inflate the numbers.
Daily Transactions of Top Five Layer-1 Blockchains
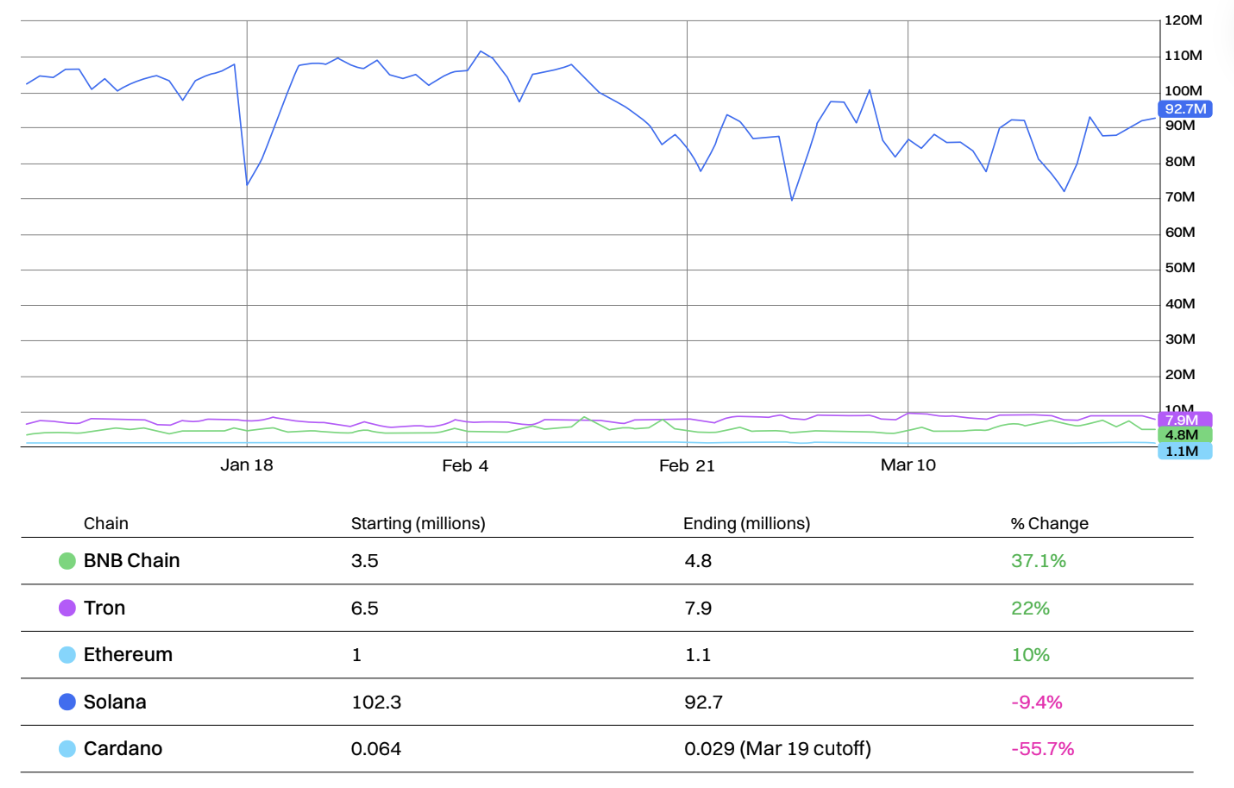
Solana continues to lead all other major L1s in transaction count by a wide margin. However, about 80% of these transactions stem from on-chain voting activity, with another large portion attributed to arbitrage bots.
Nonetheless, Solana’s daily transaction count declined 9.4% YTD.
BNB Chain saw the largest increase in daily transactions in Q1, growing 37.1%, driven by rising meme coin trading activity. Tron followed closely with a 22% increase, linked to recent growth in stablecoin activity.
Cardano saw the largest decline at 55.7%. Cardano now has by far the highest transaction-to-market-cap ratio among major L1s at 0.00000118.
Notably, Ethereum’s transaction count grew 10%, as DeFi activity continues to drive on-chain activity.
Layer-2 (L2)
All Major L2s Saw TVL Declines in Q1
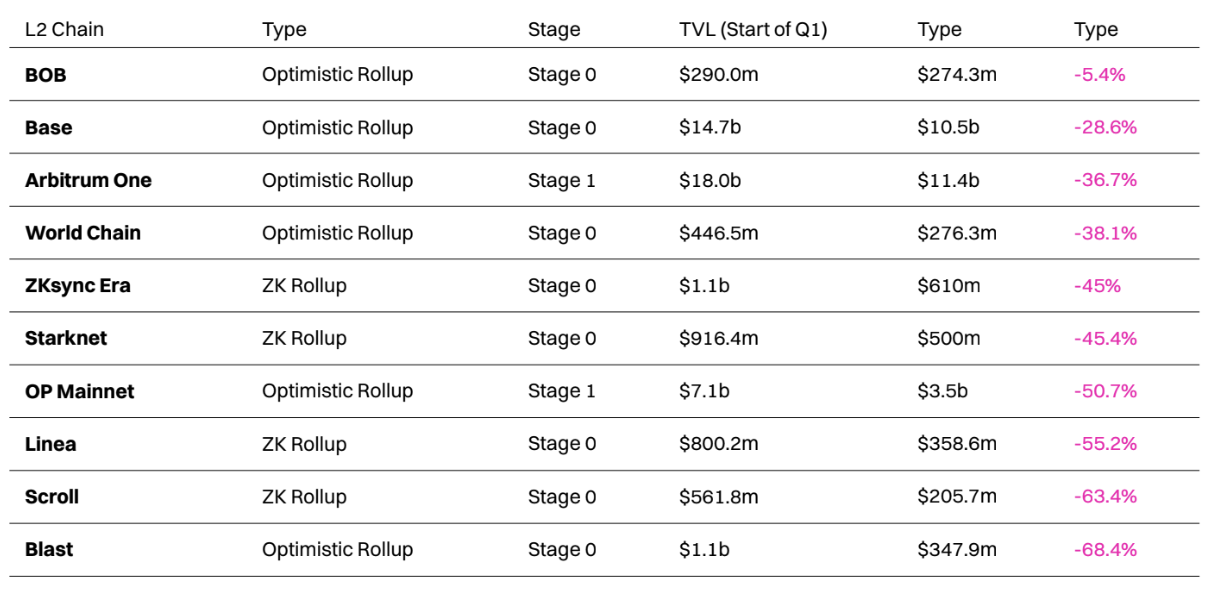
In Q1, the top ten L2s by TVL (Total Value Locked) all experienced declines, with BOB performing best by losing only 5.4% of its TVL—partly due to the success of its on-chain decentralized money market Euler.
Blast saw the most significant TVL drop, falling from $1.1 billion to just $348 million—a 68.4% decline. This may be due to post-airdrop selling and user attrition. At the same time, the platform faces greater pressure in ETH and stablecoin yield competition, accelerating its decline.
Despite a 36.7% decline, Arbitrum retained its position as the largest L2, slightly ahead of Base (ranked second), which fared relatively better with a 28.6% TVL drop in Q1. Arbitrum’s decline followed its BoLD upgrade in February, which brought the platform closer to Stage 2 L2 status, while Base benefited from Coinbase Wrapped BTC (cbBTC) integration, helping attract a new audience.
Optimism’s TVL more than halved but still maintained its position as the third-largest L2. This occurred despite the addition of several new L2s like Ink and Unichain to the Superchain.
World Chain overtook Scroll to become the eighth-largest L2, primarily because Scroll’s TVL plummeted 63.4% after interest waned following the conclusion of its “Session One” airdrop program.
In Q1, many L2s aimed to achieve Stage 1+ status by meeting requirements such as integrating complete and functional proof systems.
Top Five L2s by TVL vs. Ethereum: Daily Active Addresses (YTD)
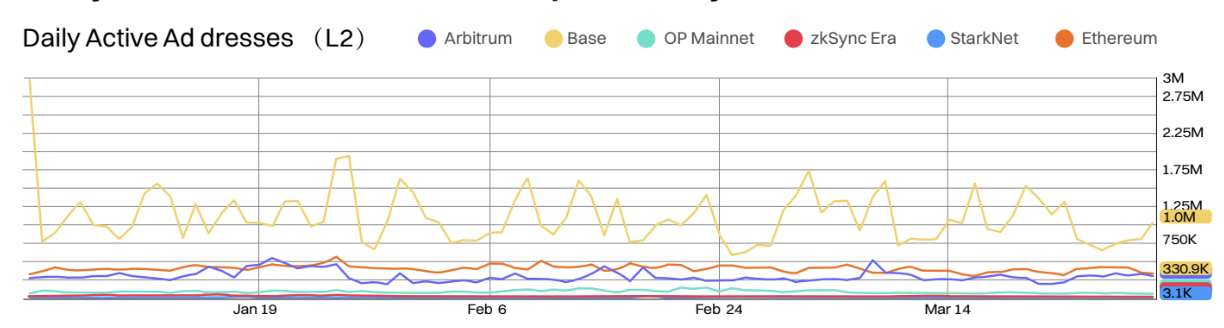
Base currently leads by a wide margin in daily active addresses, the only L2 to maintain unquestionable dominance in Q1 2025.
Base is the only L2 whose active address count consistently exceeds Ethereum L1. It is currently developing multiple new upgrades, including Flashblocks and Appchains, which could further solidify its position as the most popular L2.
Base’s head Jesse Pollak also hinted at the potential introduction of a tokenized version of Coinbase stock (SCOIN) on the L2 network.
Arbitrum was the only other L2 to temporarily surpass Ethereum L1 in daily active addresses, with a notable spike in early March—shortly after Robinhood listed the asset.
Base saw the largest decline in active addresses, dropping two-thirds to 1 million daily active addresses, while zkSync Era saw a 29.6% decline.
Top Five L2s by TVL vs. Ethereum: Daily Transaction Volume (YTD)
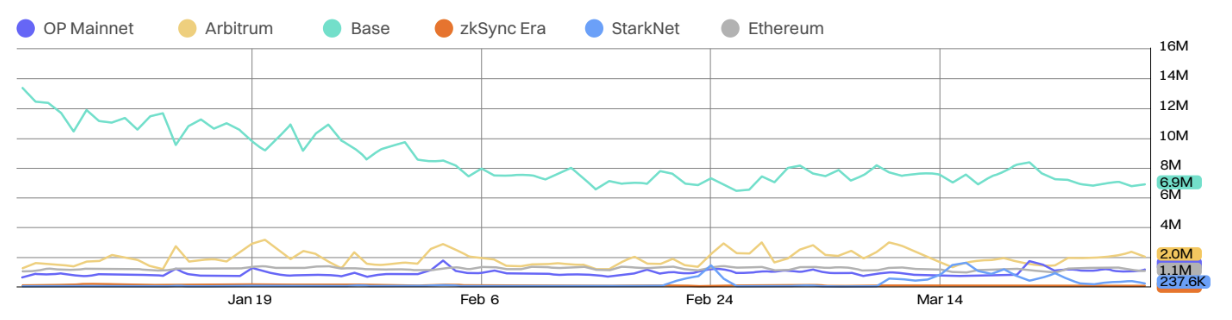
Base, Arbitrum, and Optimism now consistently process more daily transactions than Ethereum L1.
Base’s daily transaction volume fell from 13.4 million to 6.9 million in Q1—a 48.5% drop. In contrast, zkSync Era and Starknet declined by 30.4% and 26.2%, respectively.
Despite claims that they’re eroding Ethereum’s base layer, most major L2s saw YTD declines in daily transaction volume.
Base maintains a clear lead in the competition, with daily transaction volume stabilizing since mid-February.
Arbitrum successfully expanded its reach, increasing daily transactions from 1.3 million to 2 million—a 54% rise—narrowing the gap with Base. Optimism performed even better, with transaction volume growing 65%.
Decentralized Finance (DeFi)
DeFi TVL (YTD)
Q3 DeFi TVL Market Share:
In Q3, Ethereum’s DeFi TVL market share dropped 4%, while smaller platforms like BNB Chain and Berachain gained share.
Despite growing stablecoin transaction volume, Tron’s market share fell from 6.2% to 5%, the largest decline among chains. In contrast, newly launched Berachain captured 3.4% of the market share in less than two months after its February launch, thanks to a strong airdrop strategy and yield opportunities.
Bitcoin’s TVL grew significantly, reaching 5.8% market share—primarily driven by liquid BTC staking solutions like Lombard.
Top Five L2s by TVL vs. Ethereum: Daily Active Addresses (YTD)
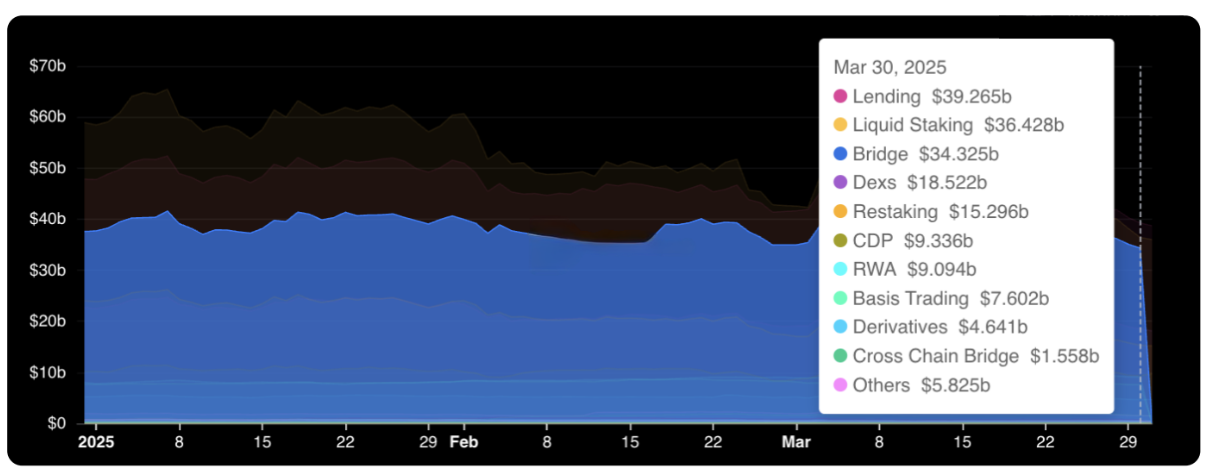
Lending is now the largest sector by TVL, with over $38.9 billion locked in open lending platforms like Aave and Compound. Liquid staking solutions, once the largest sector, now rank second with $36 billion TVL, dominated by major players like Lido, Jito, and Rocketrool.
Absolute TVL declined YTD across most sectors, with the physical assets (RWA) sector a notable exception—growing its TVL thanks to BlackRock’s BUIDL product and Ethena’s USDtb success.
Top Ten DeFi Applications by TVL
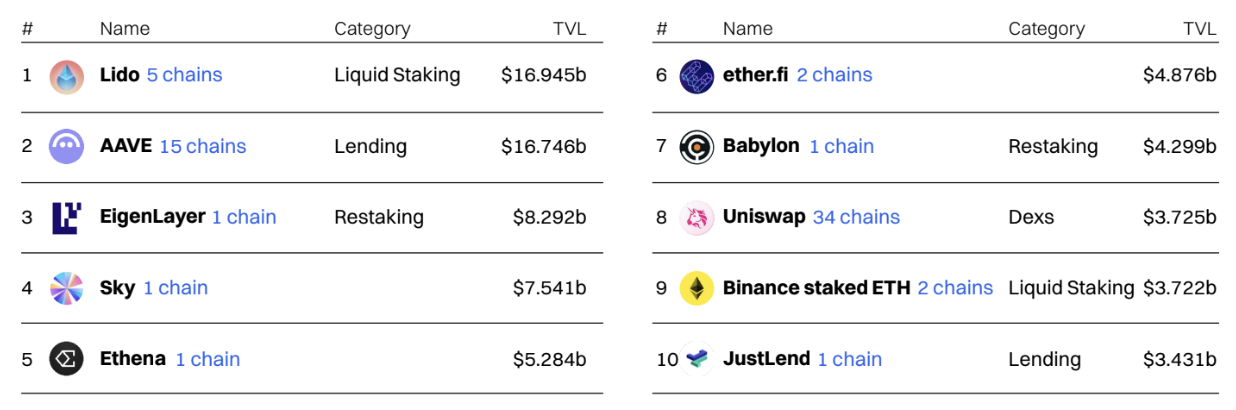
Lido, the Ethereum liquid staking protocol, retains its position as the largest protocol, though it was repeatedly overtaken by AAVE in Q1.
Lido saw several positive developments in Q1, including approval of a new permissioned SSV network module and deeper integration of its liquid staking tokens (stETH and wstETH) into DeFi.
Aave also had positive developments, including the introduction of a liquid mode to improve capital efficiency and expansion onto the Celo network.
Cross-Chain
DeFi TVL (YTD)
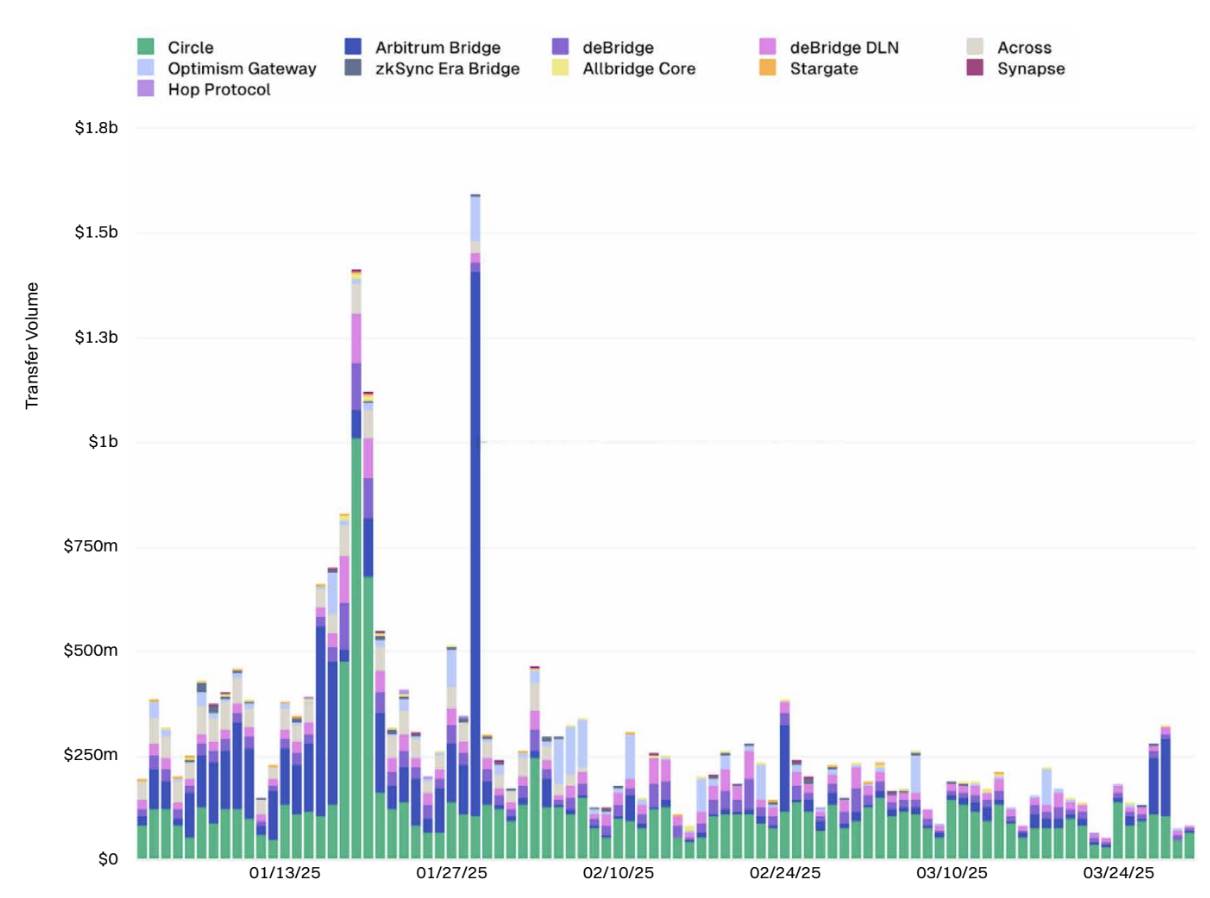
The cross-chain bridge space remains highly competitive, dominated by three major players—Circle’s CCIP, Arbitrum Bridge, and deBridge.
Cross-chain bridge transaction volume clearly declined between early and late Q1, with daily volume dropping over 60% during the period.
Some of the most significant bridge developments in 2025 include the launch of Circle’s CCTP V2, introducing peg mechanisms and faster USDC settlement, along with integration with Stargate.
Real World Assets (RWA)
Stablecoin Market Cap Grows 8.6%: Counter-Trend Expansion Amid Regulatory Challenges
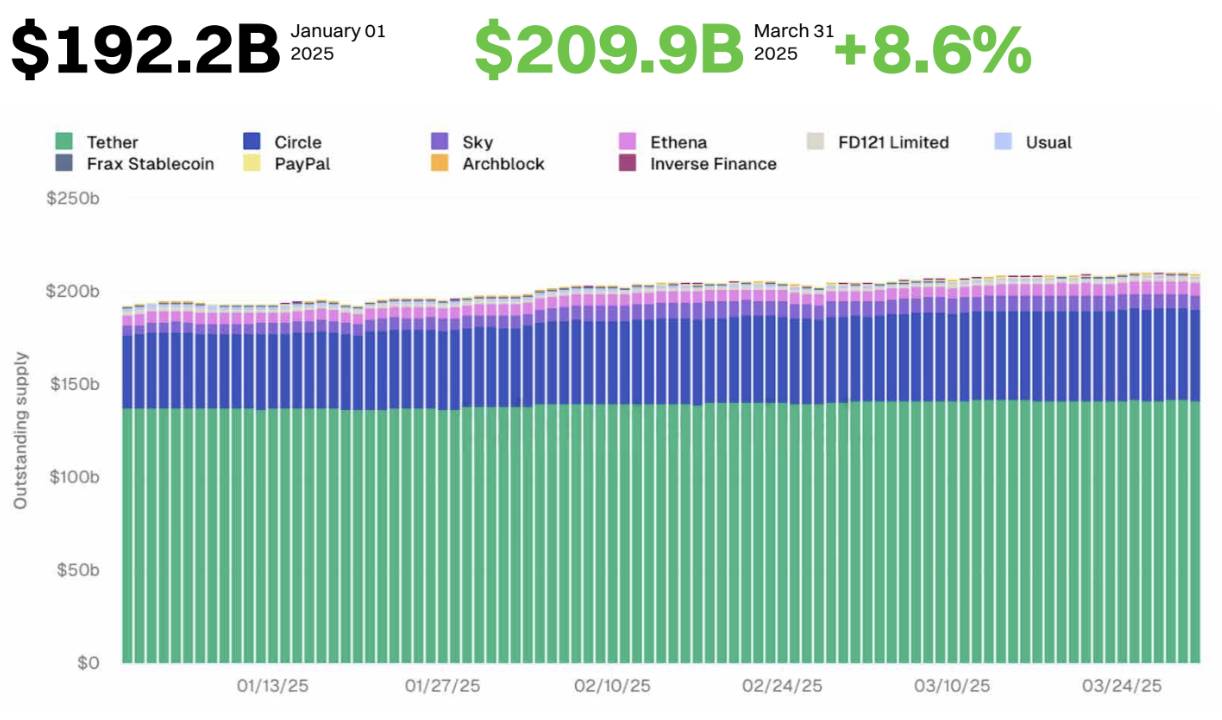
Despite market turbulence, the stablecoin industry continued expanding in 2025 YTD, with market cap growing 8.6%.
Currently, the combined market cap of the top ten stablecoins reaches $209.9 billion, occasionally exceeding $210 billion.
Tether remains the largest stablecoin issuer in 2025, but its market share dropped from 72.4% to 67.3%. Meanwhile, Circle’s USDC market share expanded from 19.8% to 23.4%.
In 2025, several crypto exchanges delisted Tether (USDT) to comply with the EU’s Markets in Crypto-Assets (MiCA) regulations. In contrast, USDC received regulatory approvals, including licensing under the MiCA framework in the EU.
Ethena also expanded its stablecoin market share in Q1 2025, driven by the success of USDtb—a stablecoin launched in December 2024, backed primarily by BlackRock’s BUIDL fund, and strengthened through strategic partnerships and the rollout of a Telegram-based payment app.
Quarterly changes: Usual’s USDO supply saw the largest drop, shrinking 46.7%. PayPal’s PyUSD grew most significantly, with supply more than doubling over the past three months.
Stablecoins continue to drive activity across many chains, used for cross-border settlements, accessing DeFi yields, and trading on decentralized exchanges.
Adjusted Stablecoin Transfer Volume Hits All-Time High: Strong Demand Growth
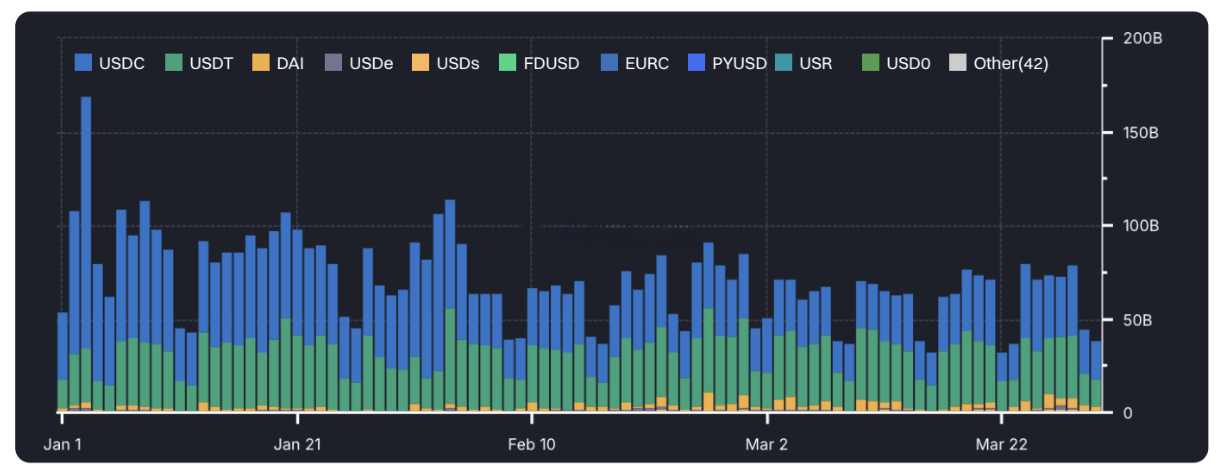
Stablecoin transfer volume continued growing in Q1 2025, reaching an all-time high in January.
According to Artemis data, USDT and USDC remain the most frequently transferred dollar-pegged stablecoins, excluding ME activities and internal transfers on centralized exchanges.
Daily stablecoin transfer volume now regularly exceeds $72 billion—more than double last year’s levels.
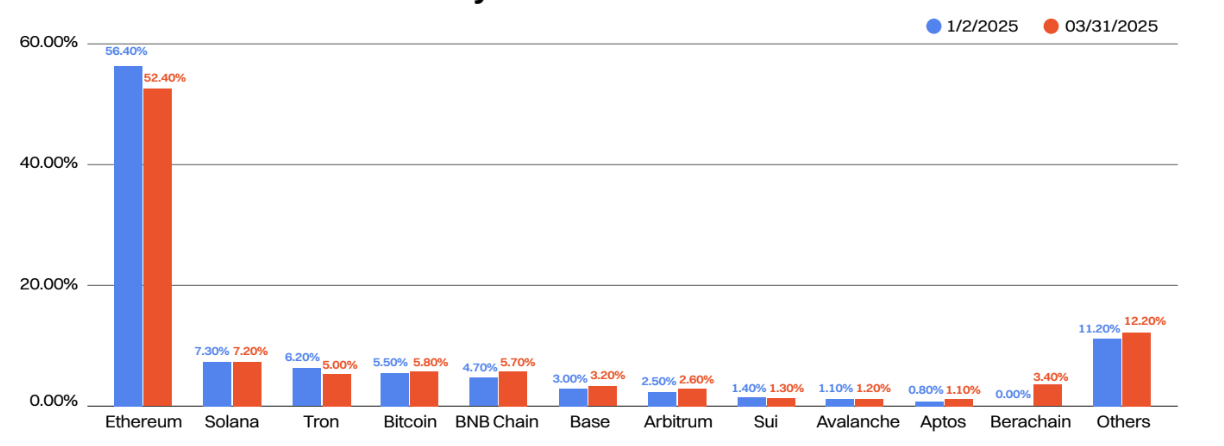
Ethereum remains the most popular chain for issuing stablecoins, holding 55.8% market share, largely unchanged YTD.
Meanwhile, Solana’s stablecoin supply grew 140% YTD, with market share rising from 2.7% to 5.5%, primarily due to USDC expansion on the chain.
Despite a sharp reduction in USDD token supply, Tron’s stablecoin supply reached a record high of $66.2 billion.
BlackRock’s BUIDL Fund Extends Lead
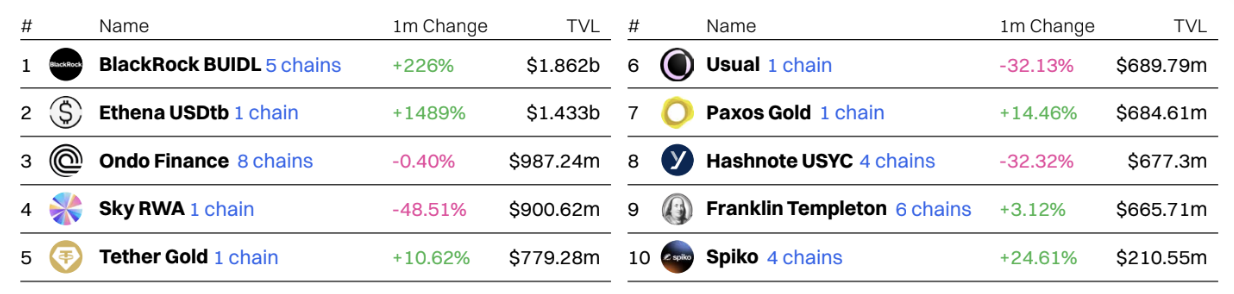
BlackRock’s USD Institutional Digital Liquidity Fund (BUIDL) is now the largest RWA protocol, with TVL exceeding $1.8 billion by the end of Q1.
The second largest is Ethena’s USDtb—a dollar-pegged stablecoin also backed by BlackRock’s BUIDL.
Several on-chain treasury issuers also saw TVL growth in Q1, including Ondo Finance and Sky RWA. Ondo’s USDY and Sky RWA’s USDS stablecoins, both backed by U.S. Treasuries, reached all-time highs in supply during Q1.
The expansion of these platforms reflects growing market demand for low-risk yield instruments, including yield-bearing stablecoins.
AI Agents
Virtuals Protocol Weekly Revenue Plummets 97.5%
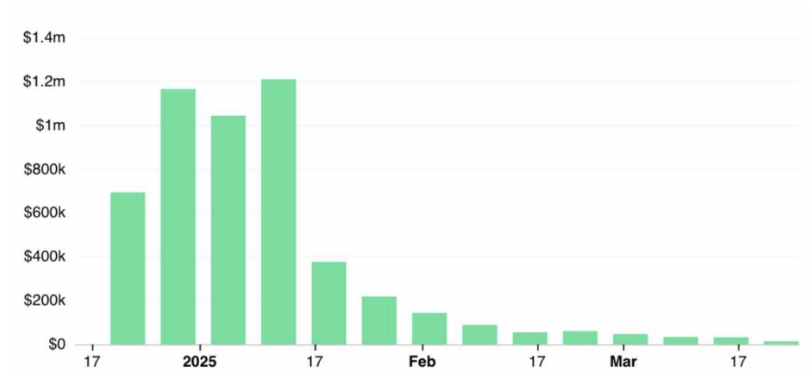
Despite a strong start in 2025, Virtuals Protocol gradually saw its weekly on-chain revenue collapse—from a peak of $1.2 million in January to under $30,000 per week for much of March.
Its expansion to Solana in February failed to improve revenue, indicating significantly reduced interest in on-chain AI agents.
Currently, Virtuals Protocol’s 7-day revenue is approximately $22,100, having fallen out of the top 100 revenue-generating protocols.
Top AI Agent Tokens See Sharp Market Cap Declines
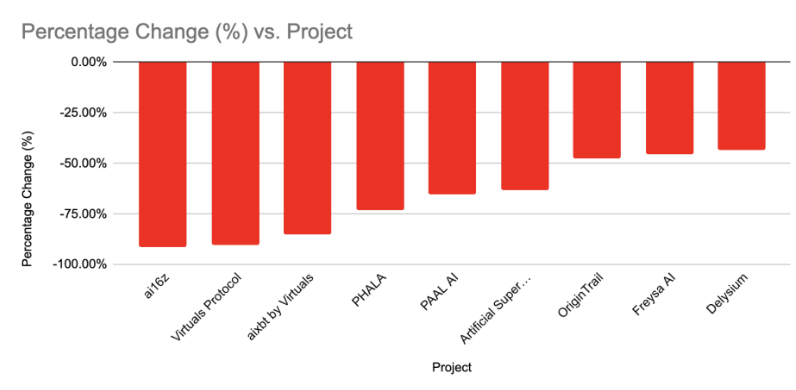
Market caps of top AI agent tokens declined sharply YTD, with pure AI agent platforms/tokens suffering the largest losses.
Among the top 10 AI agent tokens by market cap, ai16z and Virtuals Protocol lost over 90% of their value in less than three months.
On average, AI agent tokens lost over 67% of their value YTD, compared to a 18.6% drop in the CoinMarketCap 100 Index.
Meme Coins
Meme Coins Remain Among Year’s Best Performers: Shine in Mid-to-Large Caps
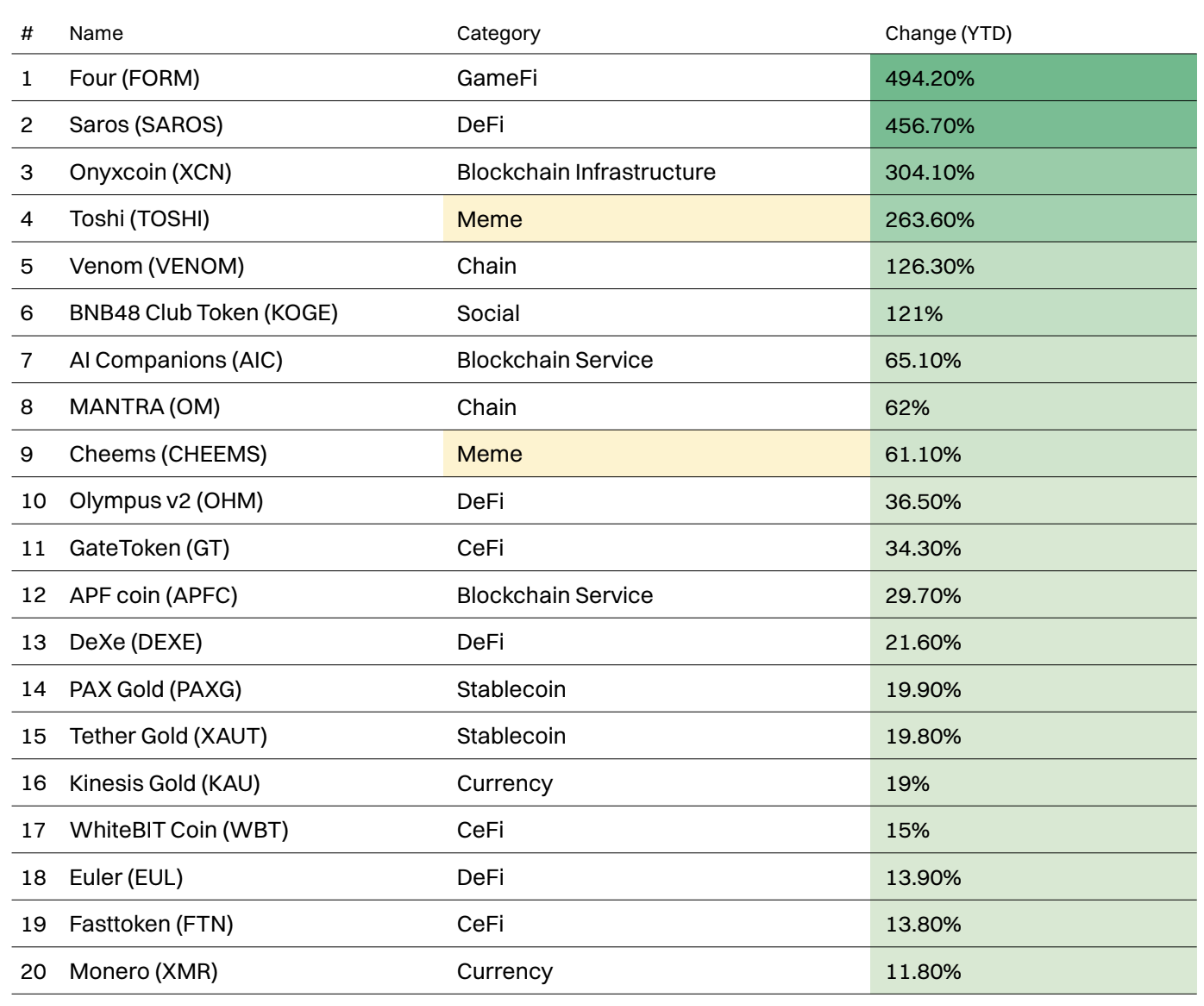
Last year, meme coins dominated the list of best-performing tokens by percentage gain. This year, they remain among the top performers in mid-to-large caps, though less frequently.
Among projects with market caps above $100 million, only two meme coins made the top 20 best performers.
Toshi (TOSHI) was the best-performing large-cap meme coin YTD, gaining 263.6%.
Worst-Performing Meme Coins of the Year
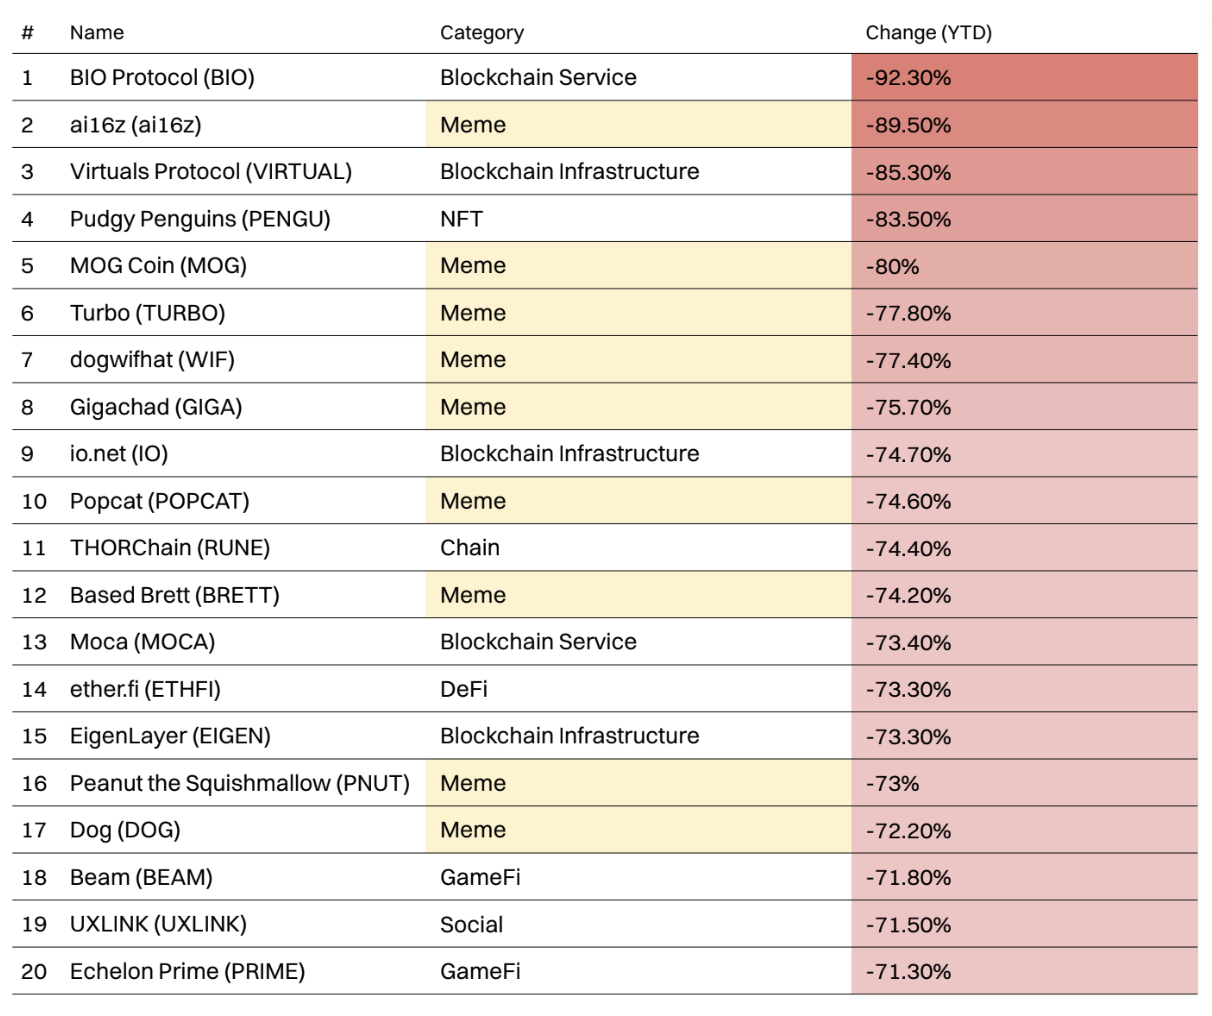
Q1 was a tough period for most cryptocurrencies, with 55 of the top 100 cryptos posting YTD losses, and the hardest-hit losing over 25% of value.
Despite high-profile meme coin launches in January—including Official Trump (TRUMP) and Melania Meme (MELANIA)—which attracted significant attention and engagement.
Meme coins dominate the worst-performing list, occupying nine of the top 20 biggest losers.
ai16z (Al16Z) was the worst-performing meme coin YTD, losing 89.5% of its value over the past three months.
Pump.fun Momentum Weakens, Still Among Top Earners
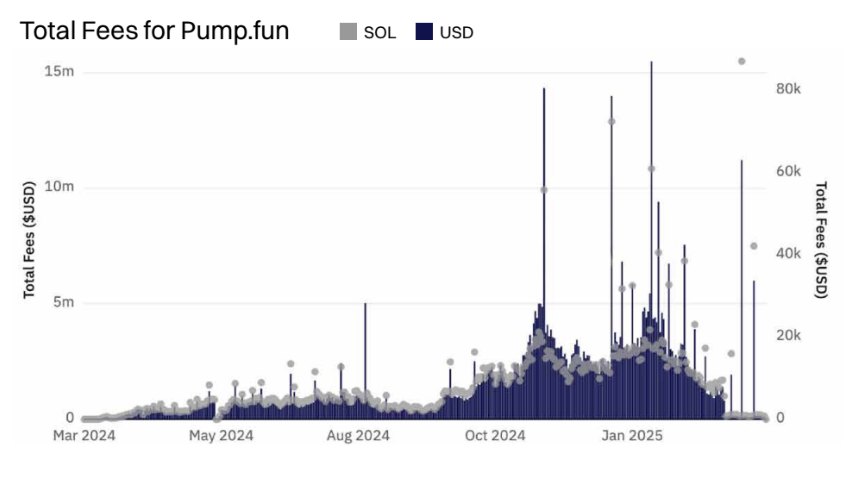
As meme coin enthusiasm fades, Pump.fun’s revenue has dropped sharply. The platform started strong, typically collecting over $3 million in fees daily, but by the end of March 2025, this had dwindled to under $100,000 per day.
Despite a ~98% revenue drop, Pump.fun remains one of the most profitable dApps, ranking in the top ten by weekly revenue.
Pump.fun Launch Volume Remains High, Graduation Rate Falls
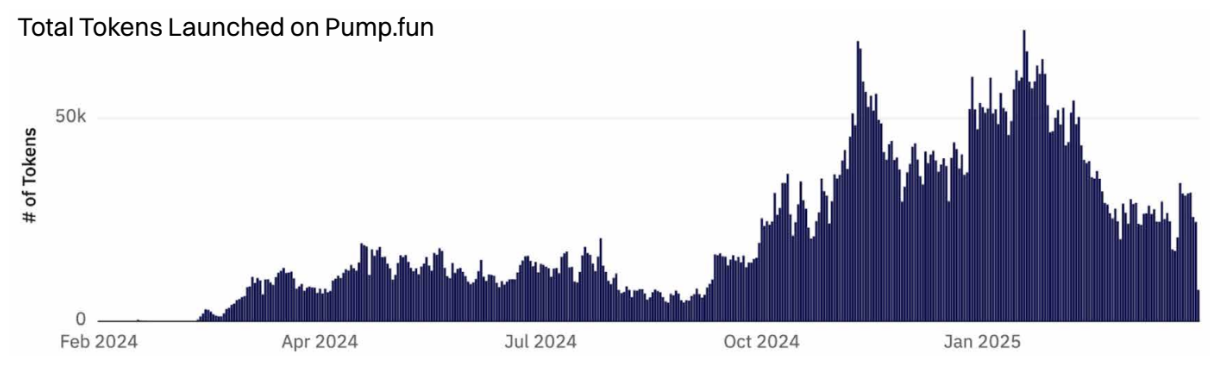
Pump.fun hit an all-time high on January 23, 2025, launching over 71,700 tokens. Since then, new issuance has declined, averaging 26,400 tokens per day in March.
While launch volume remains high, the proportion meeting graduation criteria has dropped sharply—from 1.1% YTD to 0.64%.
Pump.fun’s success has spawned numerous clones, including Raydium’s LaunchLab with flexible bonding curves, and PumpTires built for the Pulsechain ecosystem—but none have replicated Pump.fun’s success.
Despite several major platform updates, including the launch of PumpSwap DEX and plans to enable creator revenue sharing, interest continues to decline.
Join TechFlow official community to stay tuned
Telegram:https://t.me/TechFlowDaily
X (Twitter):https://x.com/TechFlowPost
X (Twitter) EN:https://x.com/BlockFlow_News