On-Chain Data School (10): Market Barometer RUPL (II) - The Strongest Top Signal & Detailed Analysis of Historical Cycle Tops
TechFlow Selected TechFlow Selected
On-Chain Data School (10): Market Barometer RUPL (II) - The Strongest Top Signal & Detailed Analysis of Historical Cycle Tops
This article will share how to analyze market tops by simultaneously observing the走势 of RUP and price.
Author: Mr. Beggar
🔸TL;DR
- The RUPL series consists of 2 articles, this is part 2
- This article explains how to analyze market tops by simultaneously observing RUP and price movements
- Building on the above, this article applies the method to analyze every historical cyclical top
- Shares the current market phase from a RUP perspective as of writing
🟡 Quick Review of RUPL
RUPL stands for Realized Unrealized Profit/Loss, which can be broken down into RUP (Realized Unrealized Profit) and RUL (Realized Unrealized Loss), representing unrealized profits and losses across the market respectively.
The primary use of this metric is to indicate the overall profit/loss status of the current market.
For a detailed explanation of the RUPL indicator, please refer to the previous post.
🟡 Applying RUP for Top Detection
In this article, I will share a powerful way to use RUPL for identifying market tops—specifically focusing only on RUP.
"When RUP diverges from BTC price action, it highly likely signals a market top."
A divergence occurs when BTC price makes a higher high, but RUP forms a lower high.
The logic is straightforward: in theory, when price reaches a new high, RUP should follow accordingly.
However, if we observe the opposite—a higher price accompanied by relatively weaker profitability—it strongly suggests that "holders of low-cost basis coins have started selling and distributing."
This is because the largest component of unrealized profit comes from early holders with low acquisition costs. Once these investors exit their positions,
even if prices later reach new highs, RUP may fail to make a corresponding new high due to the conversion of large amounts of unrealized profit into realized profit.
That said, one important reminder: analyzing market phases more accurately requires combining this indicator with other on-chain metrics to avoid drawing narrow or misleading conclusions.
🟡 Detailed Analysis of Historical Cyclical Tops
Understanding the logic behind RUP divergence is theoretical unless tested against actual market data.
Therefore, in this section, I’ll apply this framework to review all major historical BTC market tops.
1. The 2013 Bull Market Top
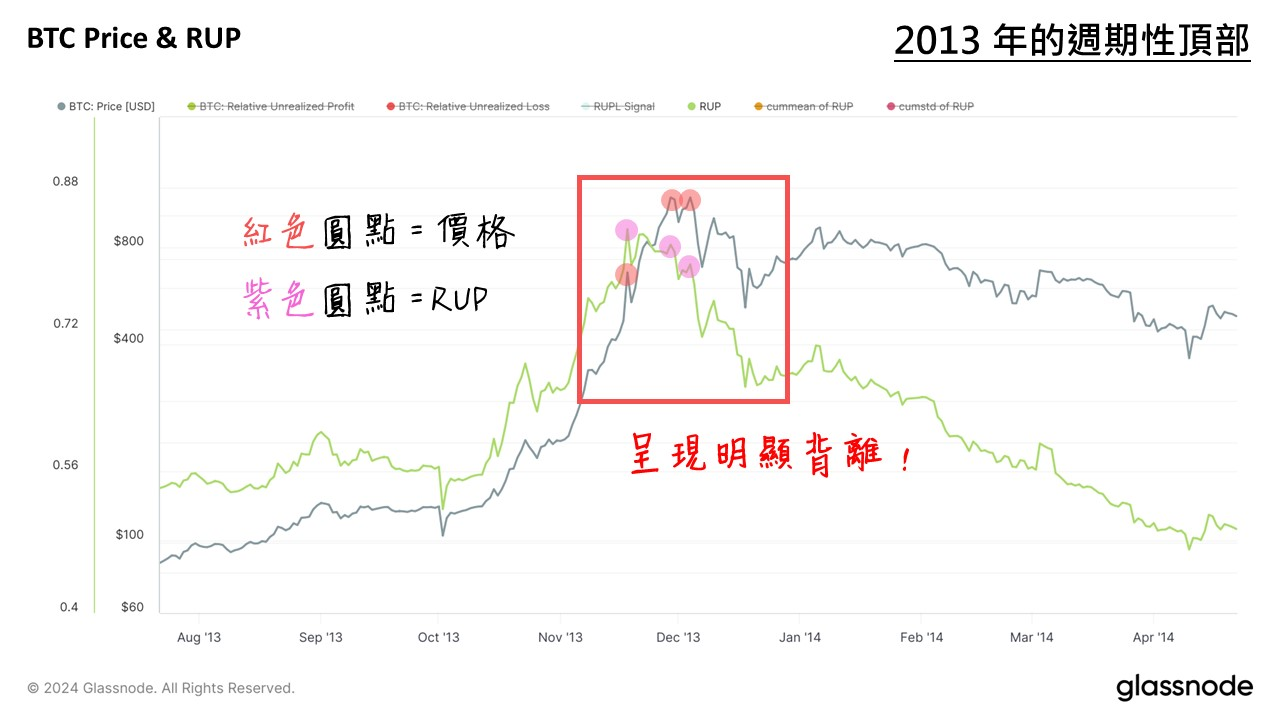
As shown above, the green line represents RUP, and the black line is BTC price.
At the time of the peak, there was a clear "three-phase divergence" between price and RUP.
As price made two consecutive higher highs, RUP responded with lower highs each time,
fully satisfying the RUP divergence condition described earlier.
2. The 2017 Bull Market Top
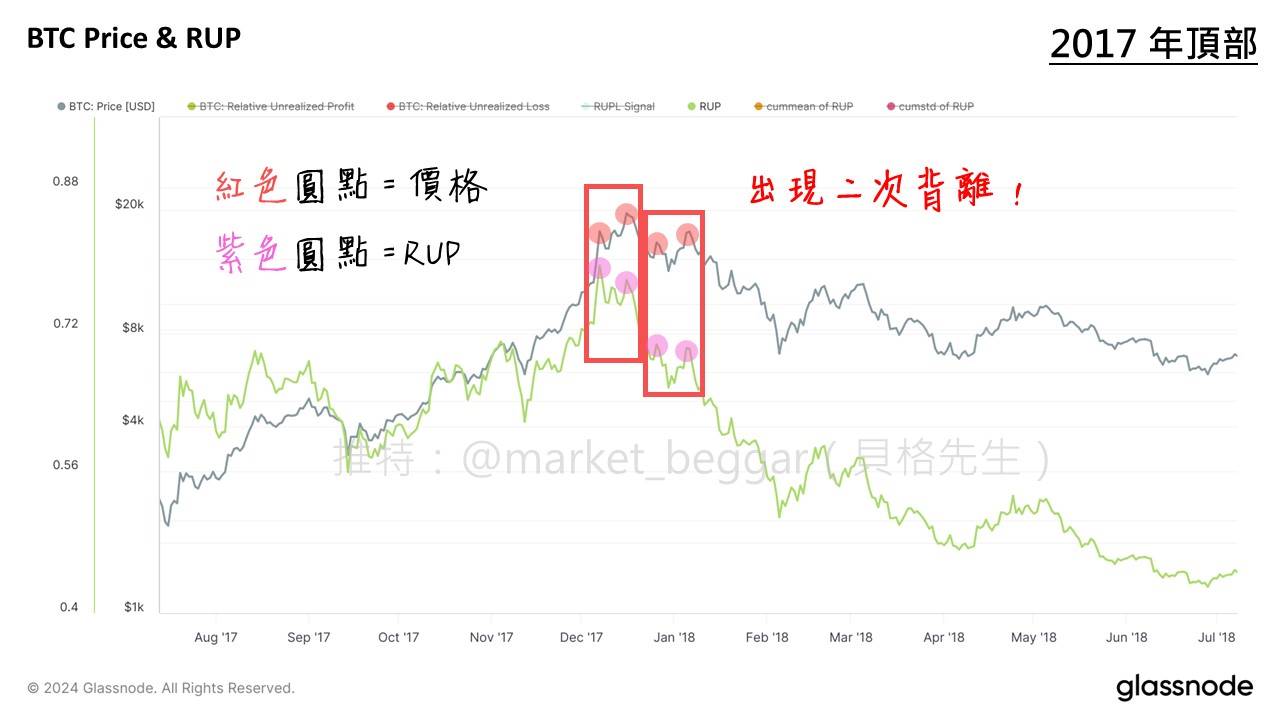
As illustrated, the 2017 top also exhibited a clear RUP divergence signal.
After price reached its local high, RUP formed its first divergence;
then during the subsequent price struggle and rebound, a second RUP divergence appeared—providing ample warning for investors to exit.
3. The Two Tops in 2021
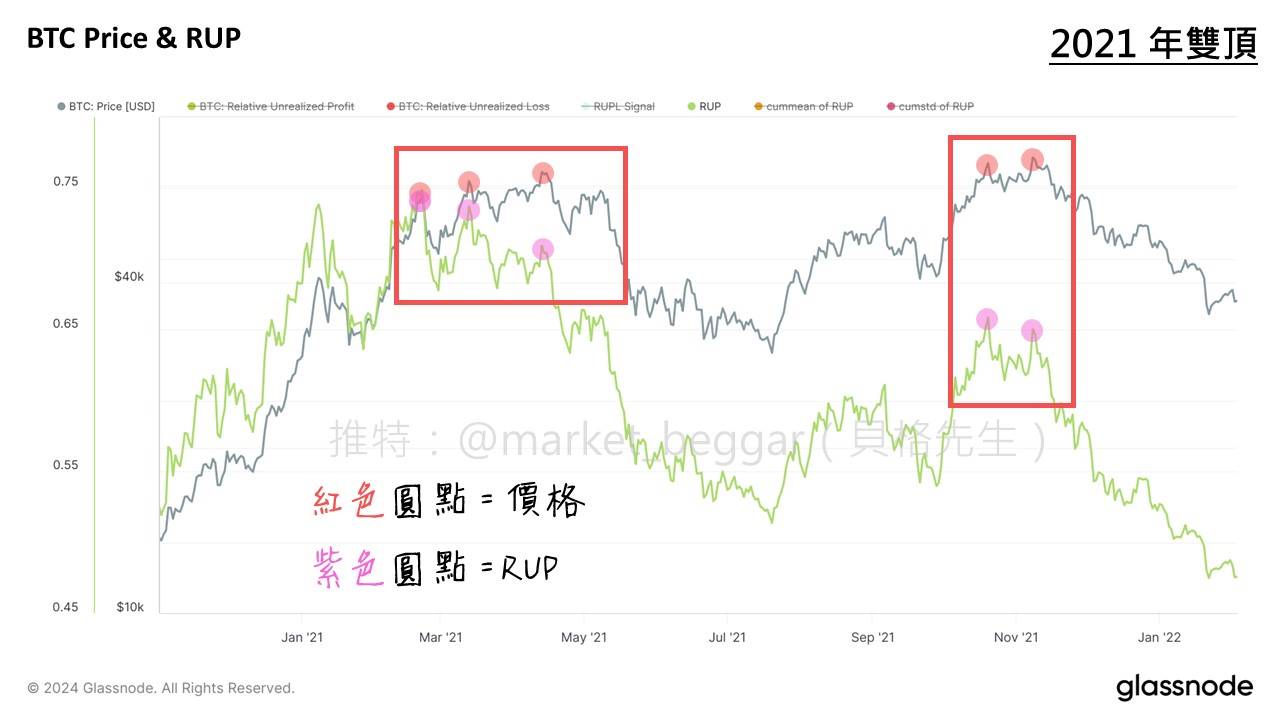
As shown, 2021 featured an unusual "double-top" structure,
so I’ll analyze both peaks separately.
The first top resembled the 2013 case, showing a classic "three-phase divergence";
the second top also displayed another RUP divergence at its peak.
In summary, all three major historical cycle tops so far have coincided with RUP divergence—without exception!
Of course, this doesn't mean every future top will necessarily show such a signal, but based on current history, the pattern holds perfectly.
So what about this current cycle...?
🟡 Analysis of the 2025 Top
No further preamble—here’s the chart:
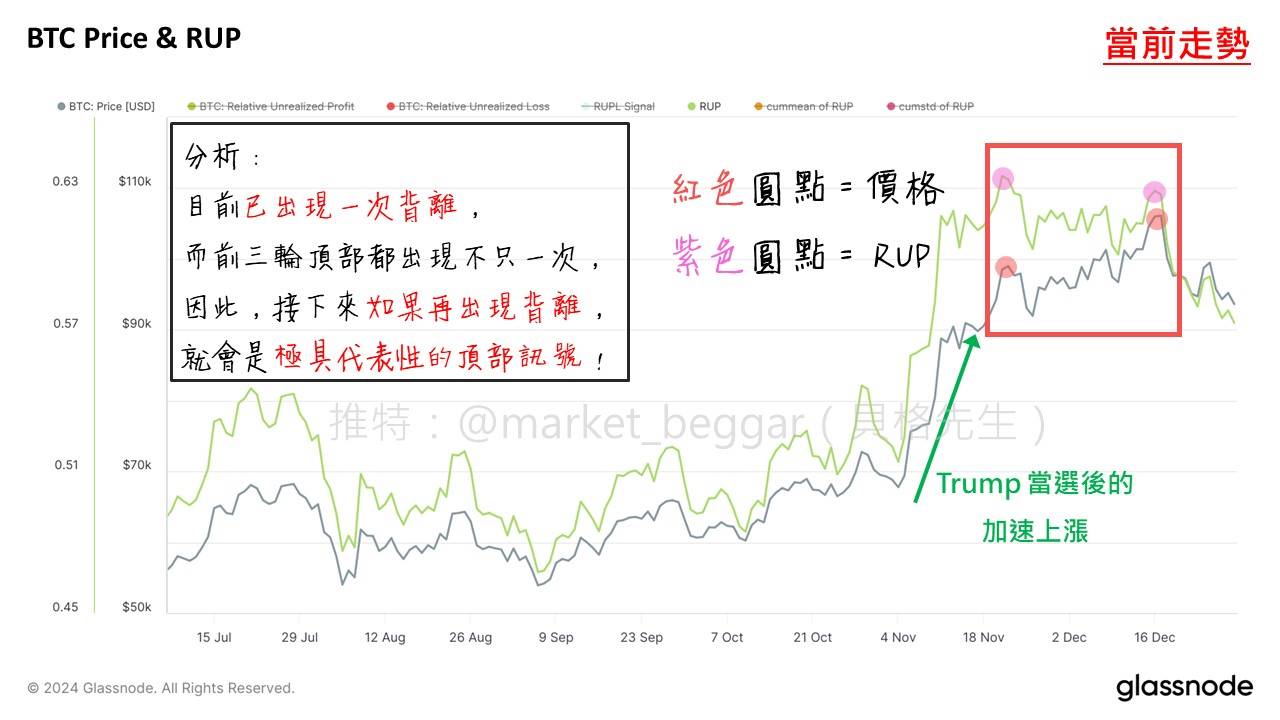
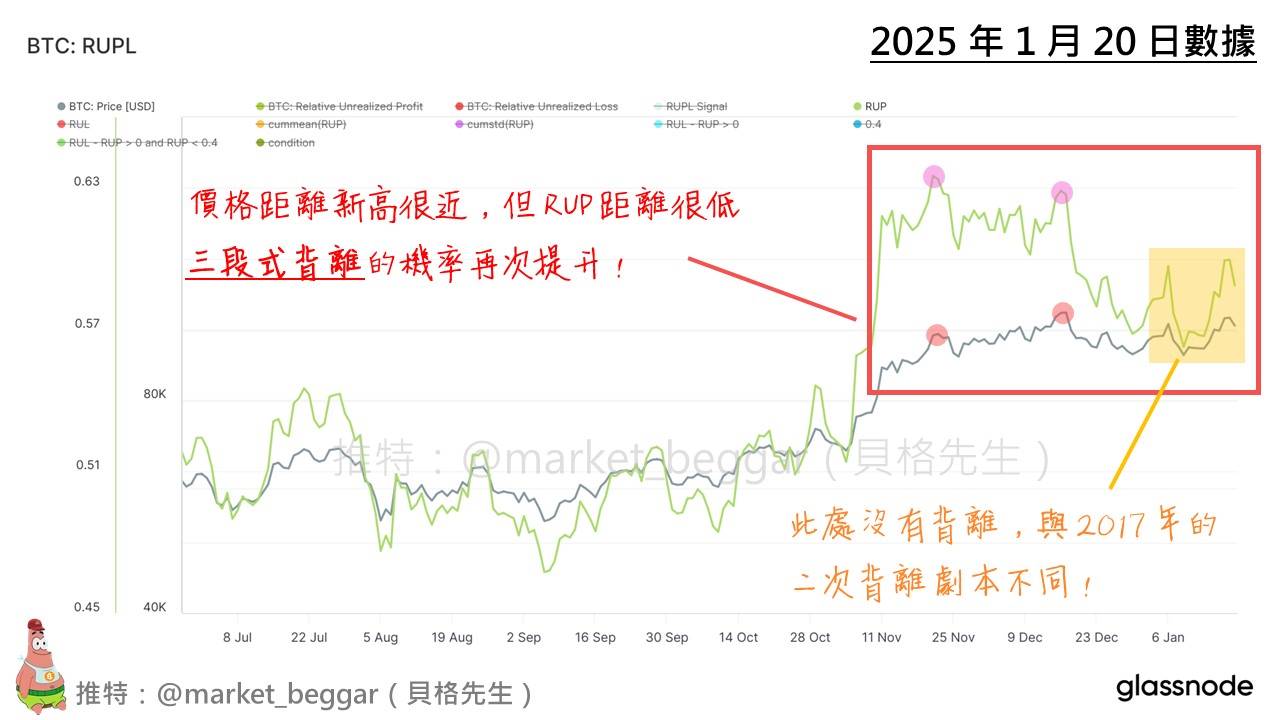
(Data as of writing, January 7, 2025)
At the time of writing, the market had already generated its first RUP divergence signal of this cycle—an undeniable red flag.
Then, on January 20, 2025, RUP formed another three-phase divergence identical to those seen in 2013 and the first 2021 top, with BTC closing around 106,000 that day.
I also posted a warning on X (link) alerting followers to the growing risk of a market top.
Has the top been confirmed? I cannot say for sure. But I have already fully exited my BTC position at an average price of 103k.
A top is a process, not a single point. Whether my call is correct remains to be proven by time. Let’s see.
Join TechFlow official community to stay tuned
Telegram:https://t.me/TechFlowDaily
X (Twitter):https://x.com/TechFlowPost
X (Twitter) EN:https://x.com/BlockFlow_News