
On-Chain Data School (9): Market Barometer RUPL (I) - Data Introduction & Bottom-Fishing Application
TechFlow Selected TechFlow Selected
On-Chain Data School (9): Market Barometer RUPL (I) - Data Introduction & Bottom-Fishing Application
RUPL can reflect the market's current "unrealized profit and loss" situation.
Author: Mr. Bag
🔸TL;DR
- The RUPL series will be published in two parts; this is Part 1.
- RUPL reflects the market's current "unrealized profit and loss" status.
- Observing RUPL reveals patterns at market tops and bottoms.
- A bottom-finding model based on RUPL is shared.
🟡 Introduction to RUPL
RUPL stands for Relative Unrealized Profit & Loss, translated as "Relative Unrealized Profit and Loss."
The indicator can be broken down into two components: RUP and RUL.
Taking RUP as an example, the calculation method is as follows:
- Compare the "current price" with the "price at which each BTC was last transferred," classifying any coins where "current price > last transfer price" as profit-accumulated coins.
- Multiply each coin's unrealized profit by its respective amount to obtain the total Unrealized Profit.
- Finally, normalize this value against the current market cap.
In other words, Unrealized Profit represents the total sum of unrealized gains across the market;
RUP standardizes this figure relative to market capitalization, enabling comparisons of profitability across different periods.
The logic behind RUL is identical to that of RUP, so we won't elaborate further here.
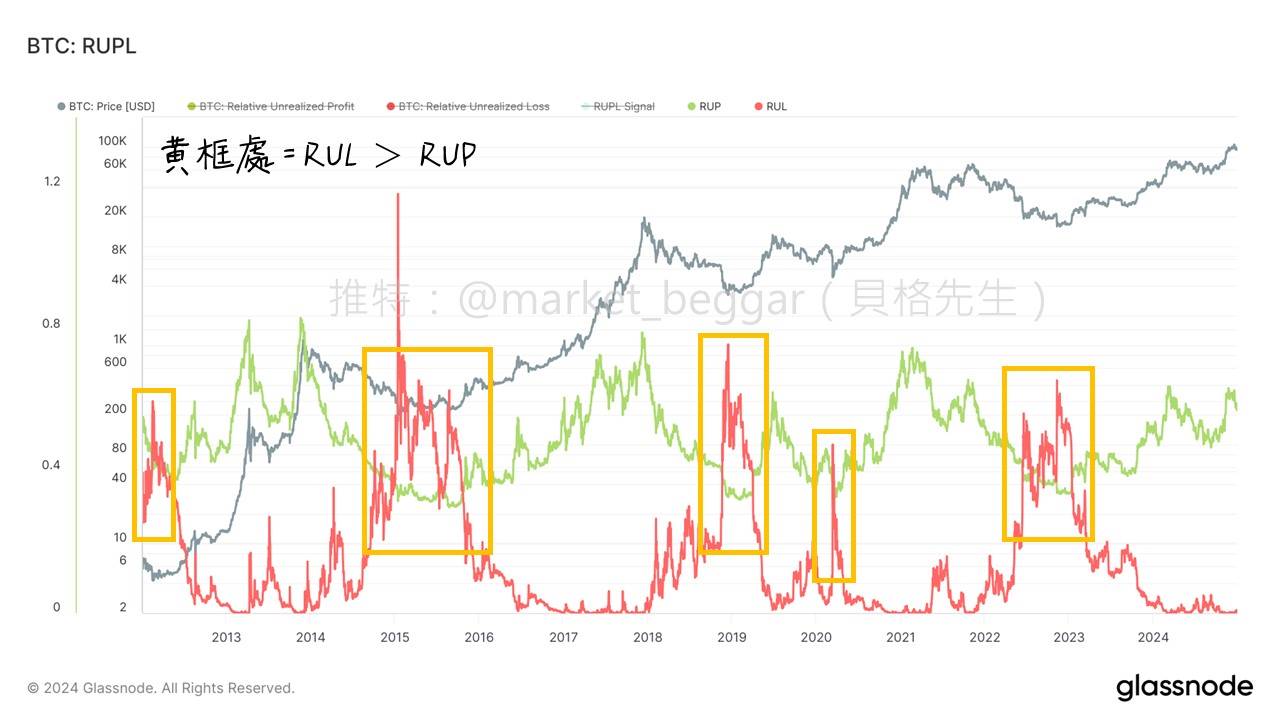
In the chart above, the green line represents RUP, while the red line shows RUL.
We observe that price is highly positively correlated with RUP and highly negatively correlated with RUL.
This makes intuitive sense—rising prices naturally increase the total unrealized profit across the network.
However, upon closer inspection of the chart, we notice that during certain rare periods, RUL exceeds RUP (i.e., the red line rises above the green).
This indicates that the overall unrealized position in the market is negative. Does this condition carry special significance? Read on...
🟡 Applying RUPL for Bottom Detection
An old saying goes: "Be greedy when others are fearful." When the majority of coin holders are sitting on average unrealized losses,
it may signal a compelling opportunity to accumulate assets.
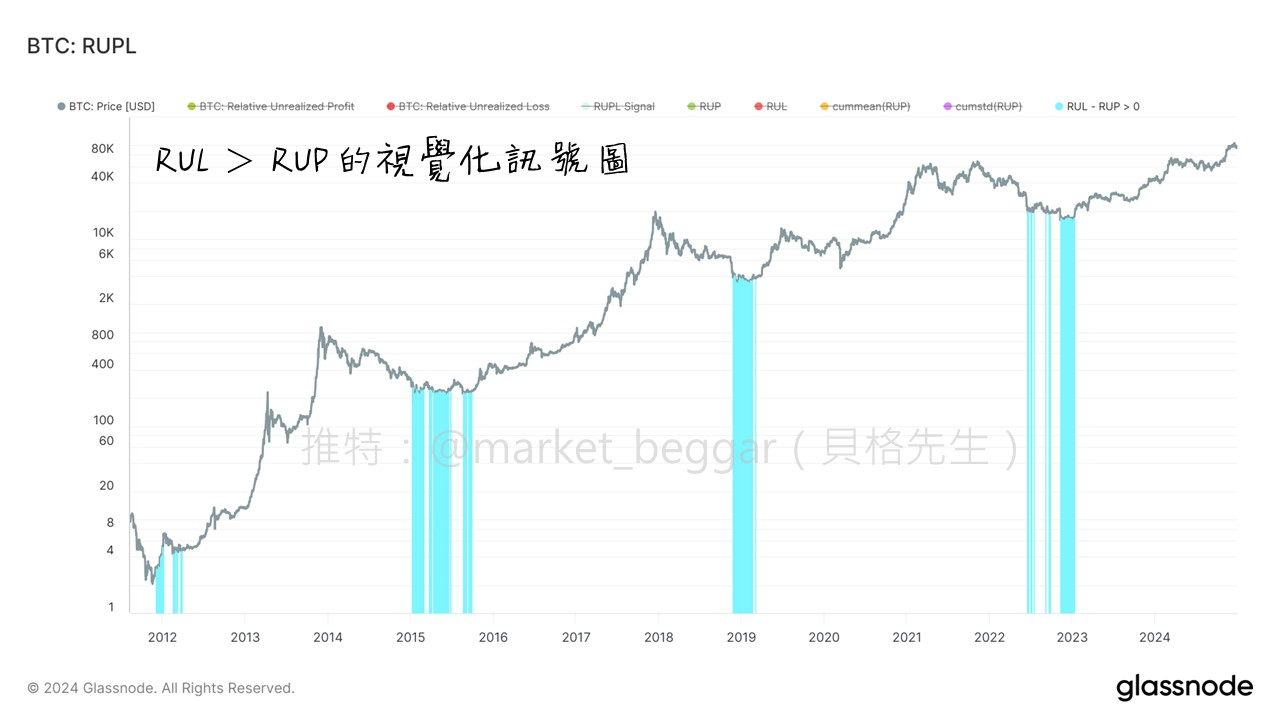
In the chart above, I've highlighted periods where RUL > RUP, producing this signal map.
We can clearly see that whenever RUL > RUP, it consistently coincides with cyclical market bottoms!
This is far from mere curve fitting—the underlying logic is this:
"When the market is broadly underwater, trapped holders are likely unwilling to sell due to low prices," resulting in significantly reduced selling pressure. Under such conditions, even modest increases in buying interest could trigger a reversal and initiate an upward trend.
This reasoning closely parallels the LTH-RP bottoming strategy introduced in previous articles. Interested readers may refer back to earlier posts.
🟡 Design Logic Behind the RUPL Bottom-Finding Model
Next, let’s temporarily set aside RUL and focus solely on the RUP chart itself. We’ll observe that historically, RUP values at market bottoms are remarkably close to one another.
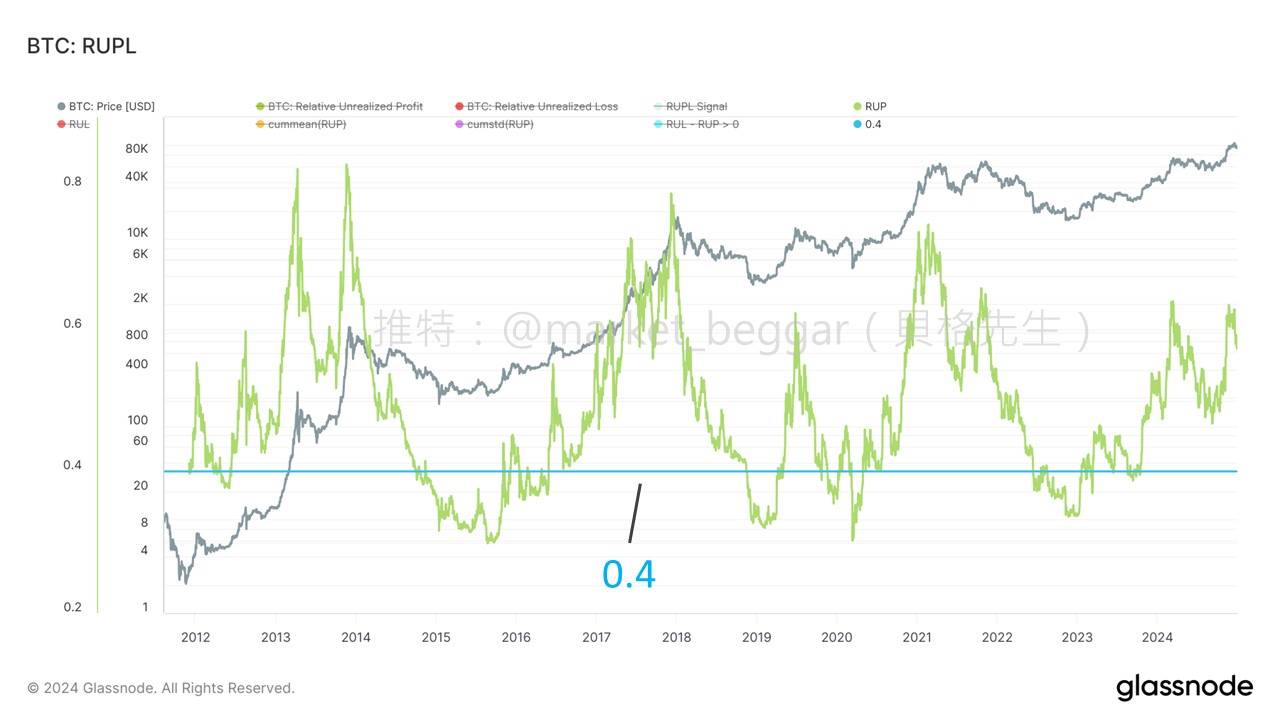
For instance, I’ve added a horizontal line at 0.4 on the RUP chart to highlight instances where RUP < 0.4.
(Note: The threshold of 0.4 is adjustable—we'll revisit this parameter shortly.)
Once we identify a relatively consistent historical bottom zone for RUP, we can overlay the condition RUP < 0.4 onto the prior signal RUP < RUL, applying a secondary filter. The result is shown below:
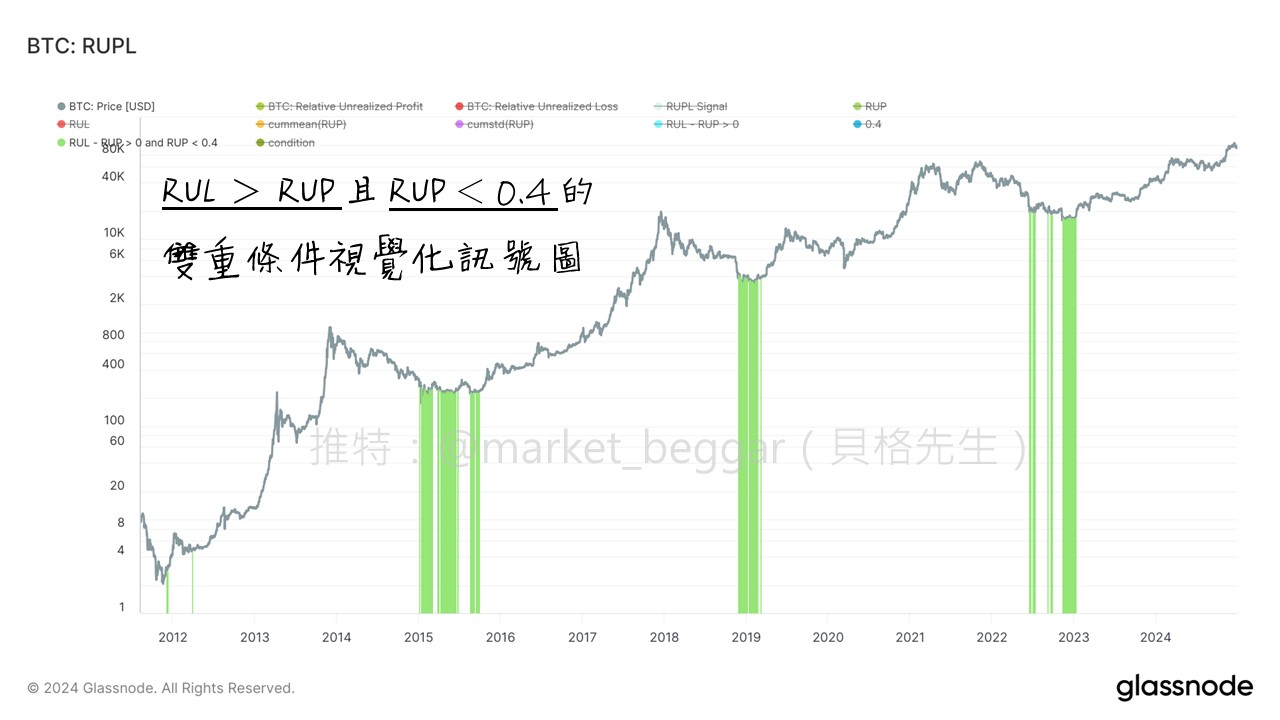
This is a common modeling technique—using layered signal filters to improve precision and robustness in model design.
The combined conditions (RUP < 0.4 and RUP < RUL) do not dramatically reduce signals, but careful observation confirms they yield stricter results than RUP < RUL alone.
By lowering the threshold (e.g., from 0.4 to 0.38), we can make the signal even more selective.
However, caution must be exercised during parameter tuning to avoid overfitting. Over-optimizing based purely on historical data risks rendering the model ineffective in future market conditions!
Join TechFlow official community to stay tuned
Telegram:https://t.me/TechFlowDaily
X (Twitter):https://x.com/TechFlowPost
X (Twitter) EN:https://x.com/BlockFlow_News