
On-Chain Data School (8): A Novel BTC Valuation Methodology Developed with ARK Research (III)
TechFlow Selected TechFlow Selected
On-Chain Data School (8): A Novel BTC Valuation Methodology Developed with ARK Research (III)
This article will introduce another way to observe the top with Cointime Price.
Author: Mr. Baig
🔸TL;DR
- The Cointime Price series will be divided into three articles—this is the third.
- We strongly recommend reading at least Part 1 of this series first!
- This article introduces another method for observing market tops using Cointime Price.
- Personal model sharing: The Cointime Price Distribution Rate Model.
🟡 Brief Recap of the First Two Articles
In the Cointime Price series, Part 1 explained the fundamental principles of Cointime Price and presented a bottom-fishing application.
Part 2 introduced a new perspective—"the degree to which price deviates from Cointime Price"—and shared my personally designed Cointime Price Deviation model, which serves as a signal filter for identifying market tops.
For readers encountering this series for the first time, it’s highly recommended to at least read Part 1 beforehand; otherwise, you may struggle with comprehension later on.
🟡 Top-Exiting Methodology: The Cointime Price Daily Distribution Rate Model
1. The Pattern of Cointime Price
Before proceeding, let’s take another look at the Cointime Price chart:
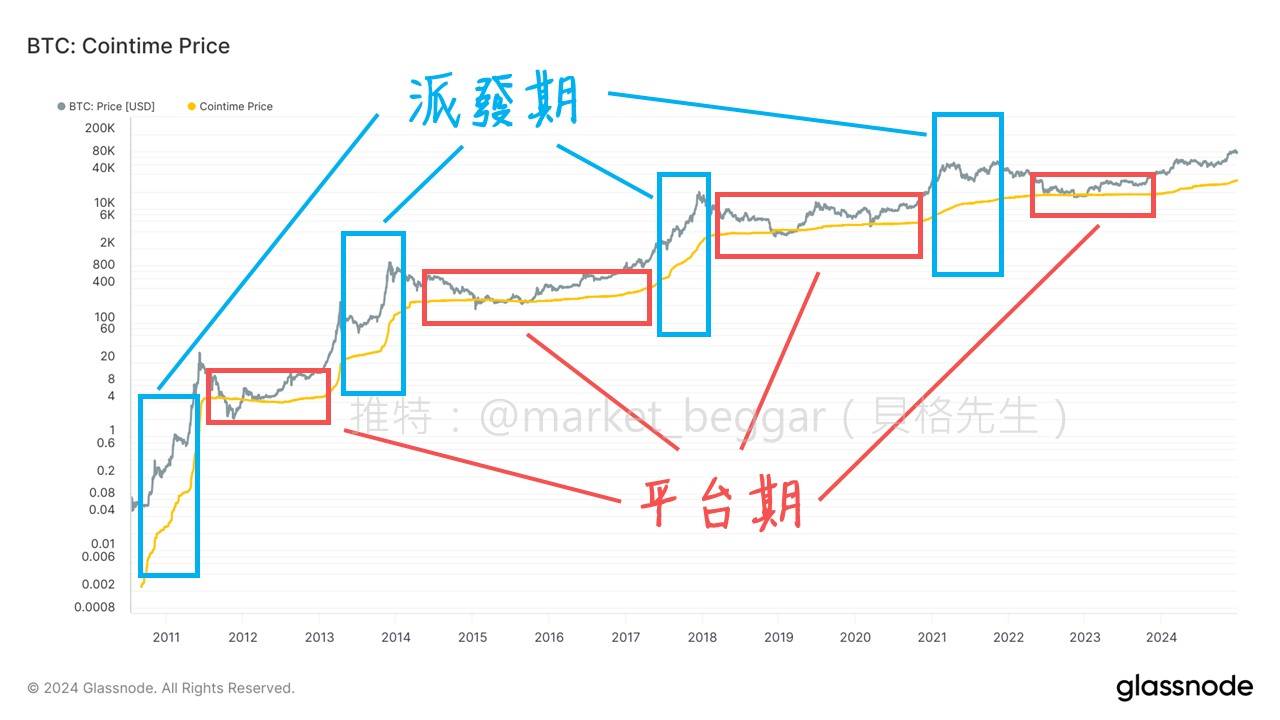
Observant readers may have noticed a fairly clear characteristic in how Cointime Price behaves:
"Sharp rise ⭢ Plateau ⭢ Sharp rise ⭢ Plateau ⭢ ..."
As discussed in Part 1 of this series, we know that:
"Cointime Price only changes rapidly when long-term holders are actively distributing."
Moreover, Cointime Price itself represents the "market's time-weighted average cost of tokens."
During distribution phases, remaining holders absorb these distributed tokens, thereby increasing their average cost—reflected on the chart as a rapid rise in Cointime Price.
Leveraging this property, I’ve developed an indicator to monitor distribution speed,
dubbed the "Cointime Price Daily Distribution Rate."
2. The Cointime Price Daily Distribution Rate Model
To measure rate of change, I use a simple formula:
Daily Distribution Rate = (Today's Cointime Price – Yesterday's Cointime Price) / Today's Cointime Price
The resulting values are then smoothed using a moving average.
When coded into Glassnode, this produces the following chart:
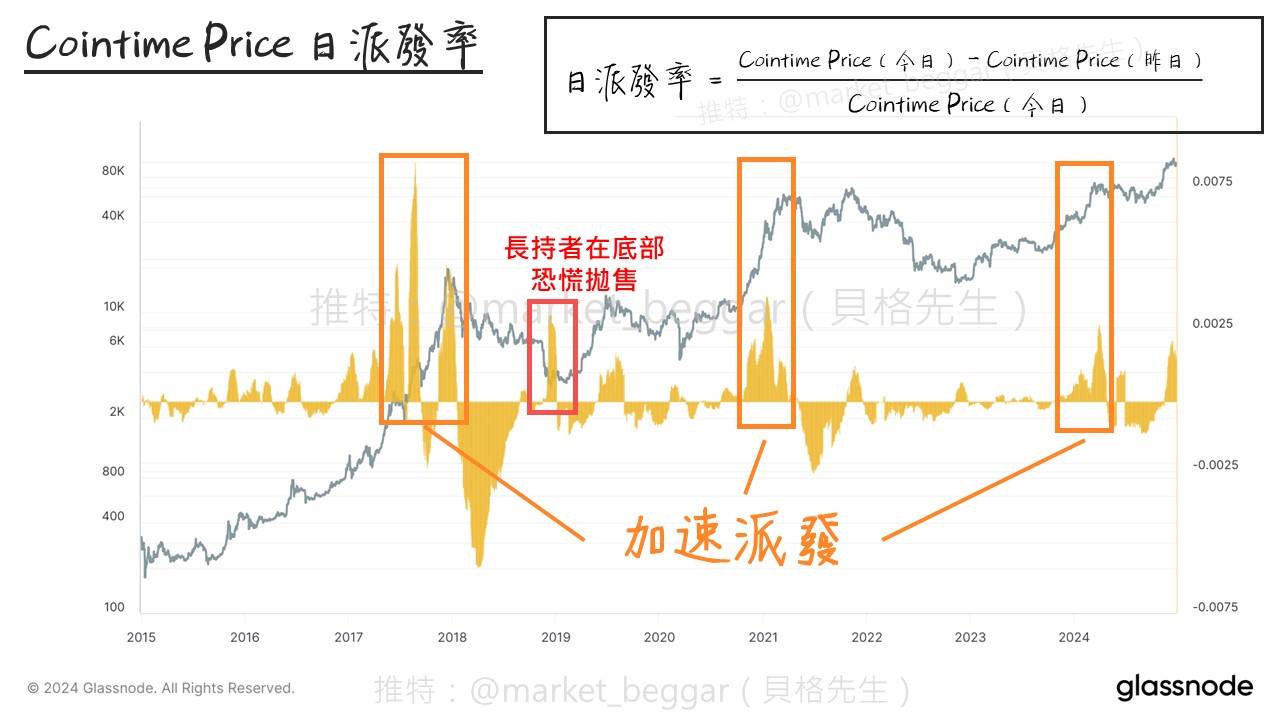
We can observe that every major bull run is accompanied by high Cointime Price distribution rates.
Except for one instance in 2019—where a high distribution rate appeared near the bottom—
all other spikes in distribution rate signal accelerated selling by long-term holders.
That single 2019 case wouldn’t lead to misjudgment in practice,
because even without other indicators, price action alone clearly showed it wasn’t a "top."
3. Daily Distribution Rate Behavior at Historical Market Tops
Logically, whenever BTC reaches a cyclical peak, distribution rarely happens just once. This pattern is consistent across indicators like URPD, Realized Profit, etc.
This also makes sense conceptually—distribution is always a process, not an instantaneous event.
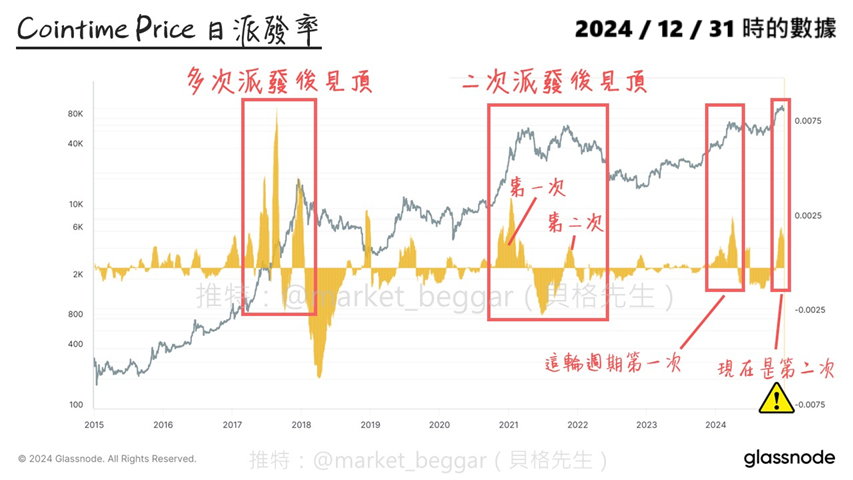
As shown above, during market tops, the daily distribution rate typically surges multiple times.
In this current bull cycle, the daily distribution rate spiked once in March 2024—a phenomenon corroborated by Realized Profit data—indicating that some long-term holders indeed took profits.
March 2024 marked the first surge in distribution rate this cycle. Then, in November of the same year, amid Trump’s election and a rapid price rally, the distribution rate surged again.
From an on-chain analytics standpoint, this is undoubtedly a warning sign worth watching closely.
Join TechFlow official community to stay tuned
Telegram:https://t.me/TechFlowDaily
X (Twitter):https://x.com/TechFlowPost
X (Twitter) EN:https://x.com/BlockFlow_News