
Chart Analysis: After the Shock of Trump's Tariff Policy, Where Is the Bottom for the Crypto Market?
TechFlow Selected TechFlow Selected
Chart Analysis: After the Shock of Trump's Tariff Policy, Where Is the Bottom for the Crypto Market?
Tariff shocks trigger market decline, digital asset liquidity tightens, and key support levels face test.
 Navigating Web3 tides with focused insights
Author: UkuriaOC, CryptoVizArt, Glassnode
Translation: Daisy, ChainCatcher
The Trump administration's announcement of its "Liberation Day" tariff policy triggered severe turbulence in financial markets, causing major macro indices to decline broadly. The digital asset market was no exception, experiencing a widespread downturn.
Summary
-
News of new U.S. tariffs severely disrupted global financial markets, with multiple markets recording one of their worst trading days since March 2020.
-
Fund inflows into digital assets have nearly stalled, liquidity has sharply contracted, and strong downward pressure has emerged.
-
However, from the price trends of Bitcoin and Ethereum, the scale of loss-driven selling has gradually decreased as prices declined—possibly indicating that short-term selling pressure is nearing exhaustion.
-
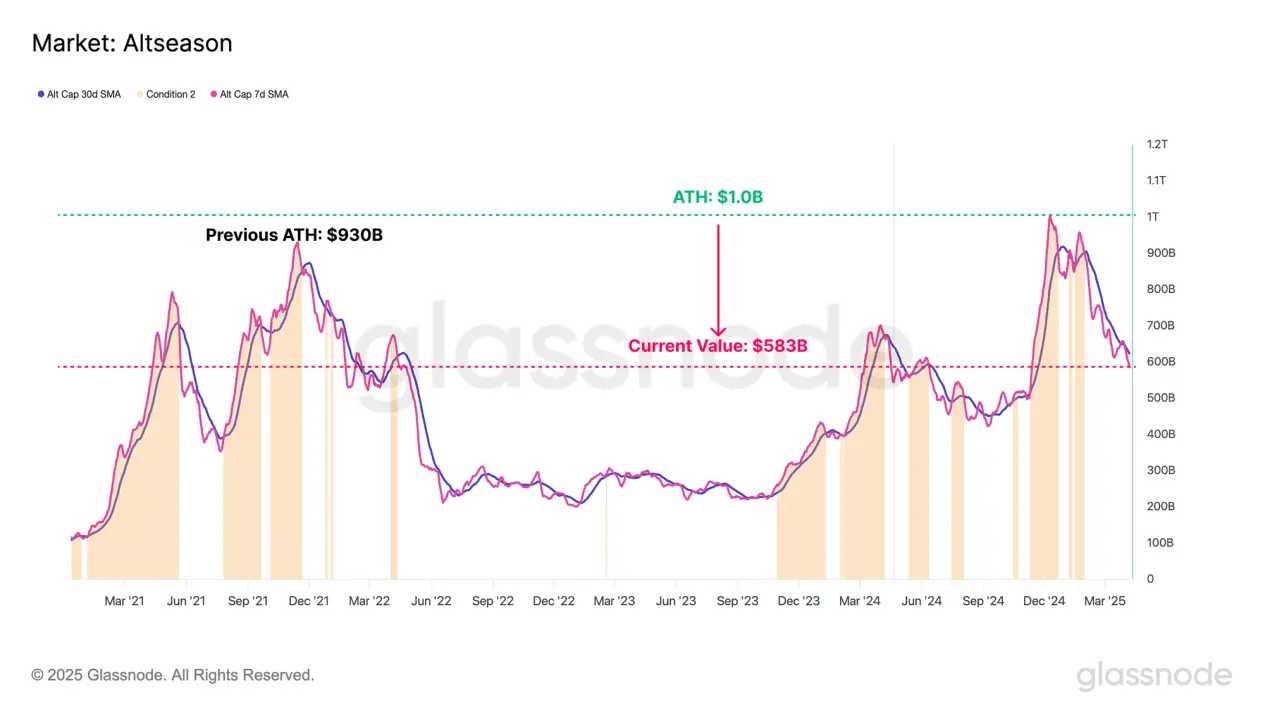
The entire digital asset market has seen broad-based declines. Altcoin market capitalization has dropped from $1 trillion in December 2024 to $583 billion currently.
-
Combined on-chain and technical modeling shows that for Bitcoin to regain upward momentum, it must reclaim $93,000. The range between $65,000 and $71,000 represents critical support levels that bulls must defend.
Market-Wide Decline
The Trump administration’s “Liberation Day” tariff announcement triggered sharp volatility across financial markets, leading to broad declines in major stock indices. U.S. policy has shifted toward weakening the dollar, lowering interest rates, reducing oil prices, and contracting fiscal spending. These combined factors could significantly slow the U.S. economy and lead to a substantial contraction in overall liquidity.
Tariff-related uncertainty has become a catalyst for rising "risk-off" sentiment in markets, triggering large-scale sell-offs. Several major financial indices posted their worst performance since March 2020.
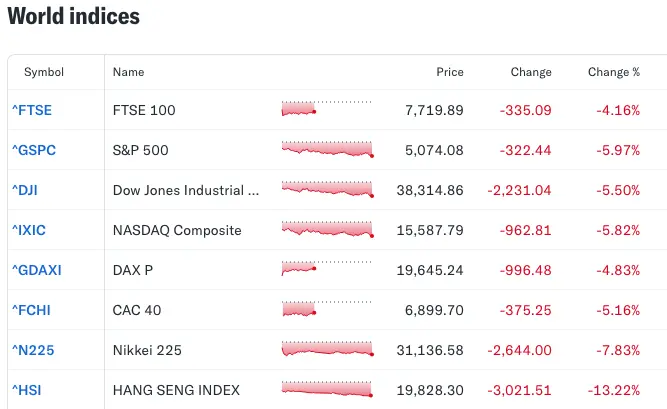
Source: Yahoo Finance
Digital asset markets are particularly sensitive to changes in global liquidity and were not spared in this downturn, with many crypto assets suffering double-digit percentage losses.
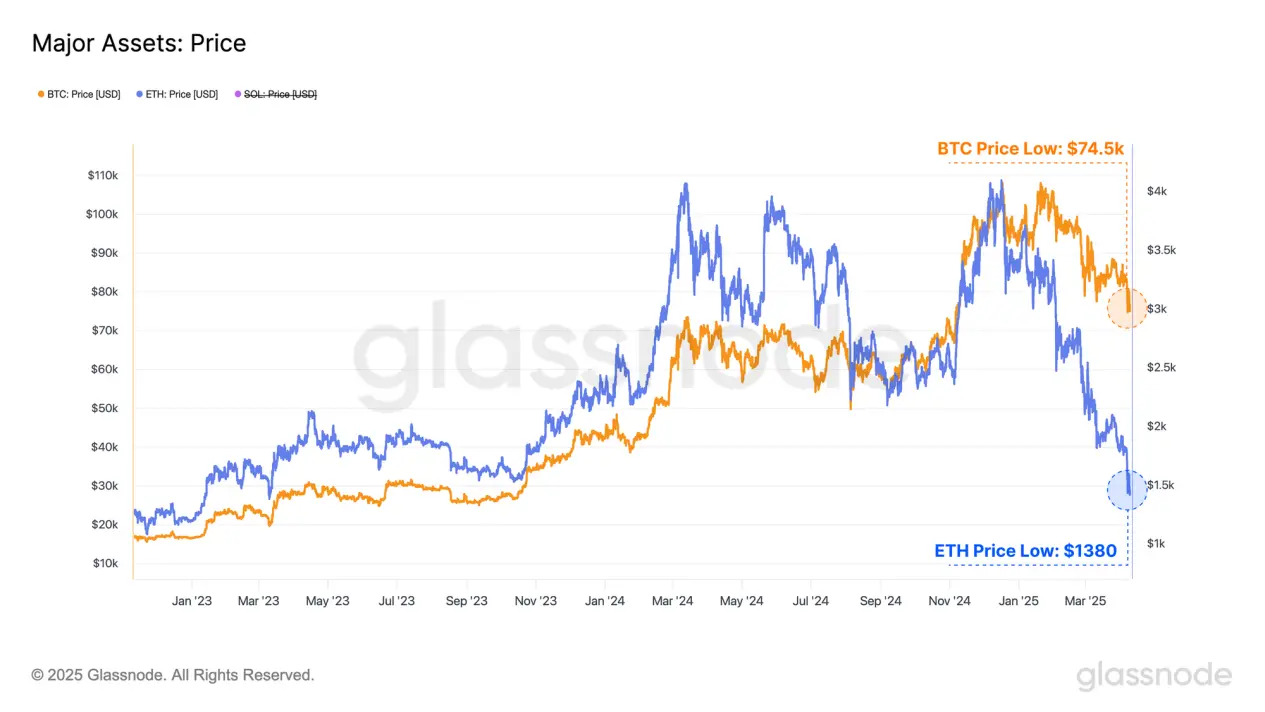
Bitcoin, the dominant asset, fell from $83,500 to $74,500, wiping out approximately $150 billion in market value.
Ethereum, the second-largest cryptocurrency, experienced an even sharper decline, dropping from $1,800 to $1,380, resulting in a market cap reduction of about $40 billion.
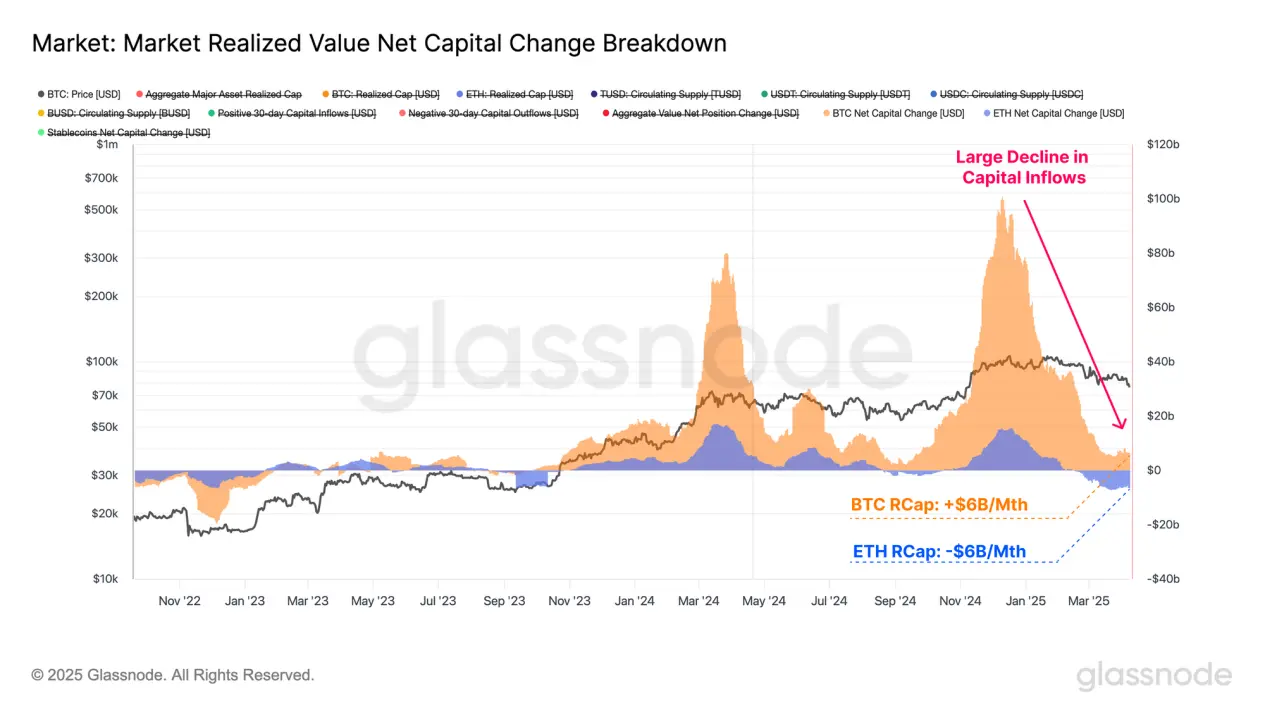
Since the beginning of the year, net fund inflows into the two main cryptocurrencies have clearly diminished. This trend is best reflected in the 30-day change in "Realized Market Cap," a metric measuring monthly net capital flow changes.
-
Bitcoin’s monthly inflow peaked at $100 billion but has now shrunk to around $6 billion;
-
Ethereum’s monthly inflow peaked at $15.5 billion and has now turned into a net outflow of $6 billion.
Fund inflows into the Bitcoin network are gradually stalling, indicating a lack of fresh capital to sustain higher prices. Ethereum’s outflows stem primarily from ETH bought at high prices being spent at lower levels, crystallizing capital losses. This suggests Ethereum currently faces stronger resistance than Bitcoin and shows relatively weaker market performance.
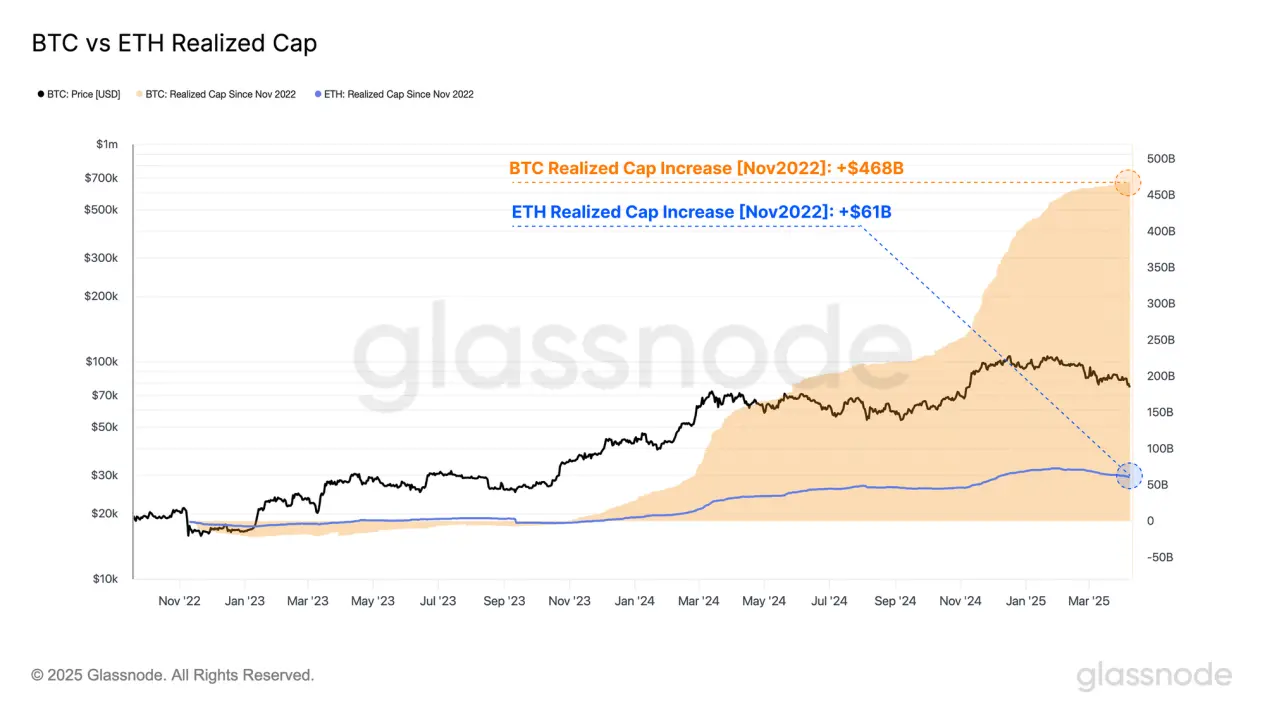
If we take the FTX collapse at the end of 2022 as a starting point and examine the realized market cap changes for Bitcoin and Ethereum, we can quantify the total capital absorbed by these two assets since the cycle low.
-
Bitcoin’s realized market cap increased from $402 billion to $870 billion—an increase of $468 billion, or 117%;
-
Ethereum’s realized market cap rose from $183 billion to $244 billion—an increase of $61 billion, or 32%.
This gap in capital inflows partially explains the divergent market performances of the two assets since 2023. Ethereum attracted significantly less capital and new demand during this cycle, resulting in weaker price appreciation and failure to reach new highs, while Bitcoin surpassed $100,000 in December 2024.
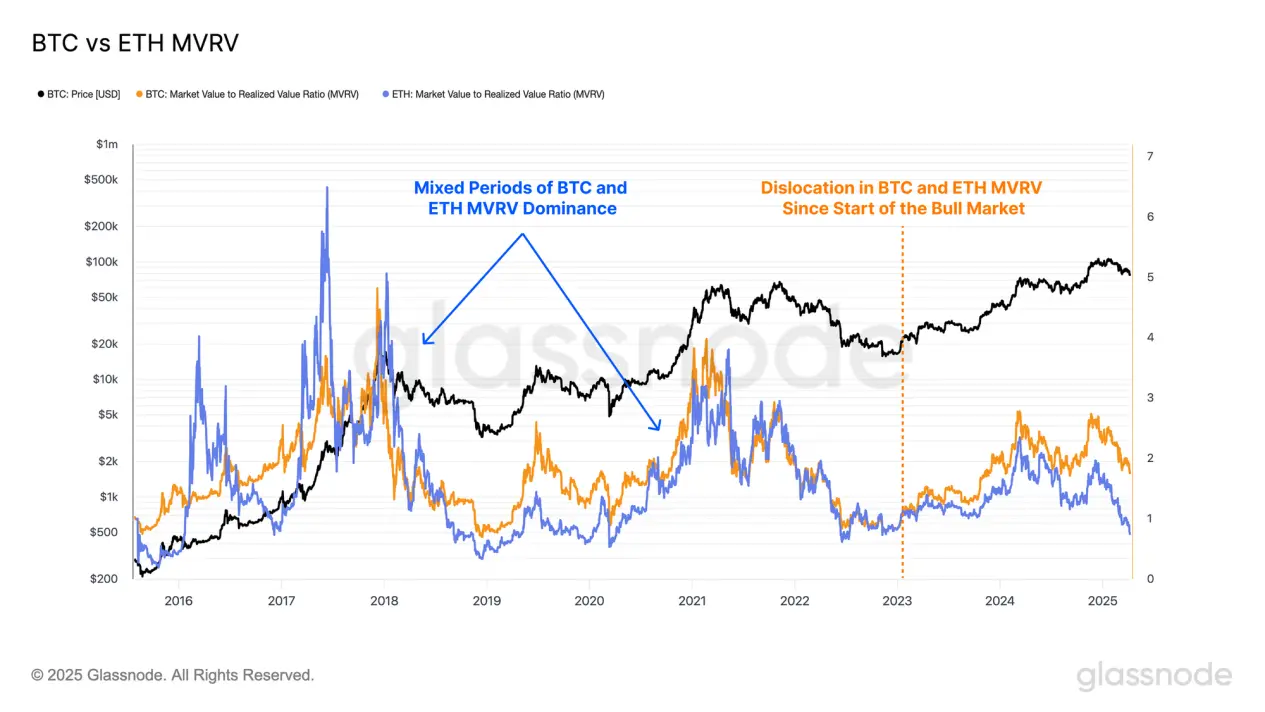
The MVRV ratio measures the relationship between spot price and realized price, reflecting the average unrealized profit or loss per holder. An MVRV above 1 indicates holders are on average in profit; below 1 means they are in loss.
Since the start of this bull market in January 2023, Bitcoin and Ethereum have again shown clear divergence in their MVRV ratios. Bitcoin investors have consistently held larger unrealized gains, while Ethereum’s MVRV ratio dipped below 1.0 in March this year, signaling most holders entered loss territory.
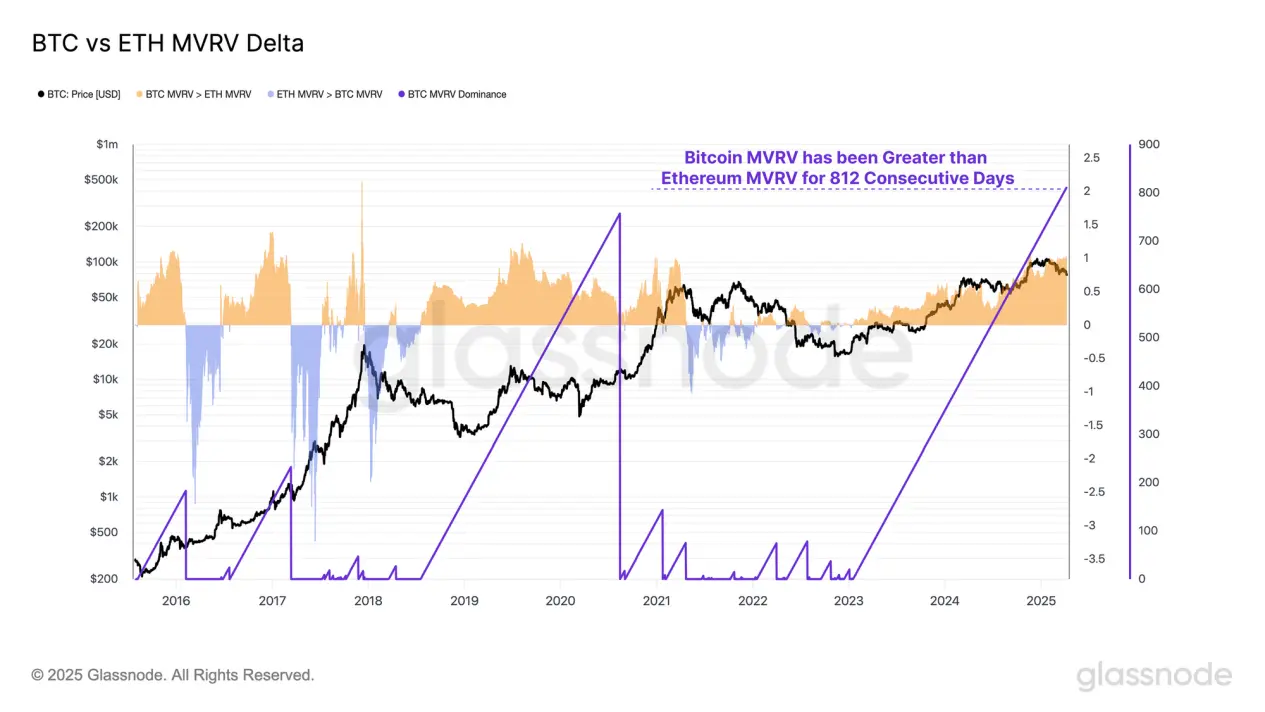
By calculating the difference between Bitcoin’s and Ethereum’s MVRV ratios, we can identify periods when Bitcoin holders, on average, performed better or worse than Ethereum holders.
-
A positive difference means Bitcoin investors had higher average unrealized gains than Ethereum investors;
-
A negative difference indicates Ethereum investors had stronger average profitability.
As previously noted, since the start of this bull run, Bitcoin investors have maintained higher average profitability than Ethereum investors.
To date, this trend has lasted 812 days—the longest such period on record.
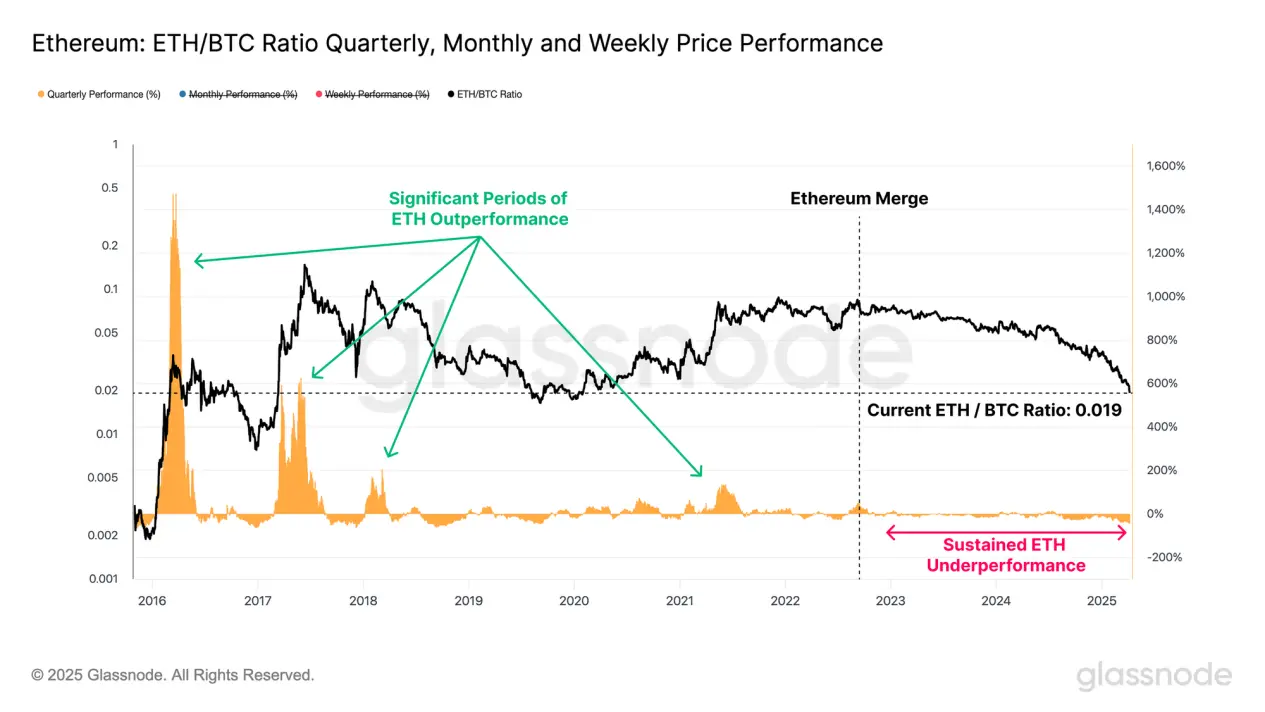
It is evident that Ethereum’s relative weakness in this cycle stems from significantly smaller inflows of capital and investor demand compared to Bitcoin. This divergence is further illustrated by the ETH/BTC exchange rate.
Since Ethereum’s "Merge" upgrade in September 2022, the ETH/BTC rate has plunged from 0.080 to the current 0.0196—a 75% drop. This is the lowest level for this pair since January 2020, and over 3,531 trading days, only 500 days have seen a lower ratio.
Moreover, this bull market has seen almost no sustained period where Ethereum outperformed Bitcoin—an extreme rarity in past cycles—and further signals that the current market structure has deviated markedly from historical patterns familiar to investors.
Reviewing Losses
After sharp declines like this week’s, it is crucial to assess investor behavior—especially given that bear markets are often triggered by rising panic and mass realization of losses.
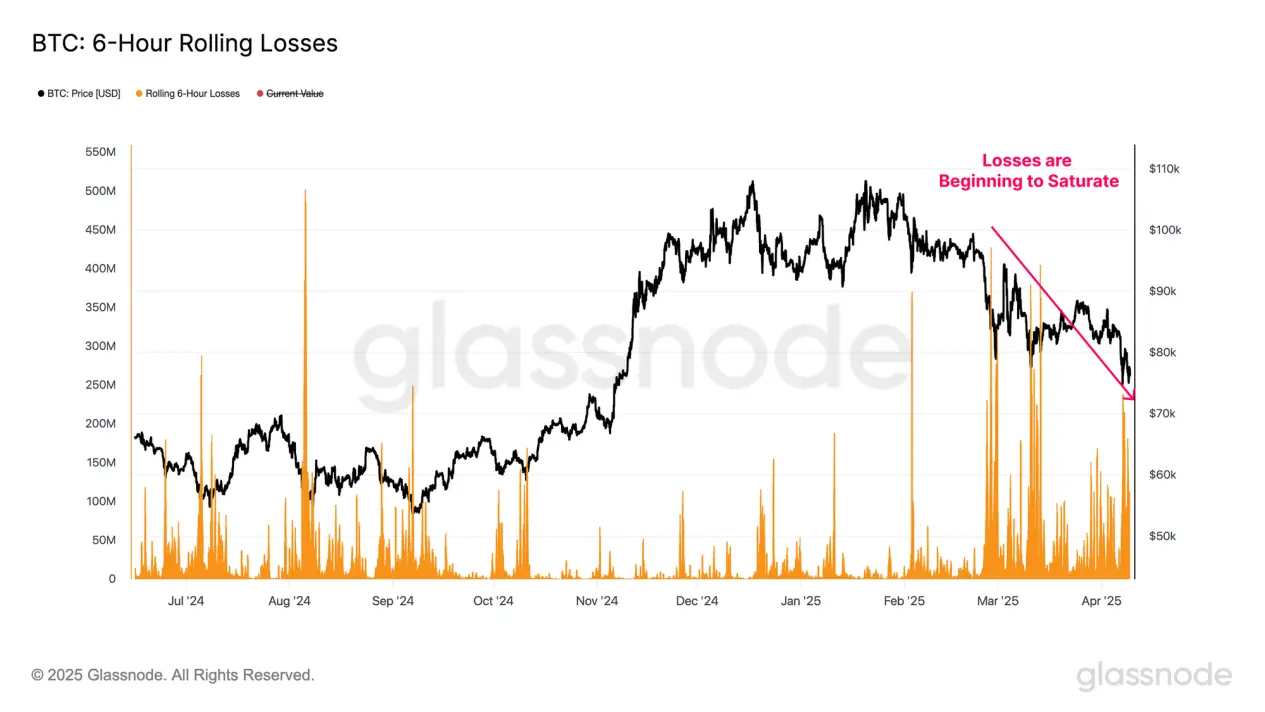
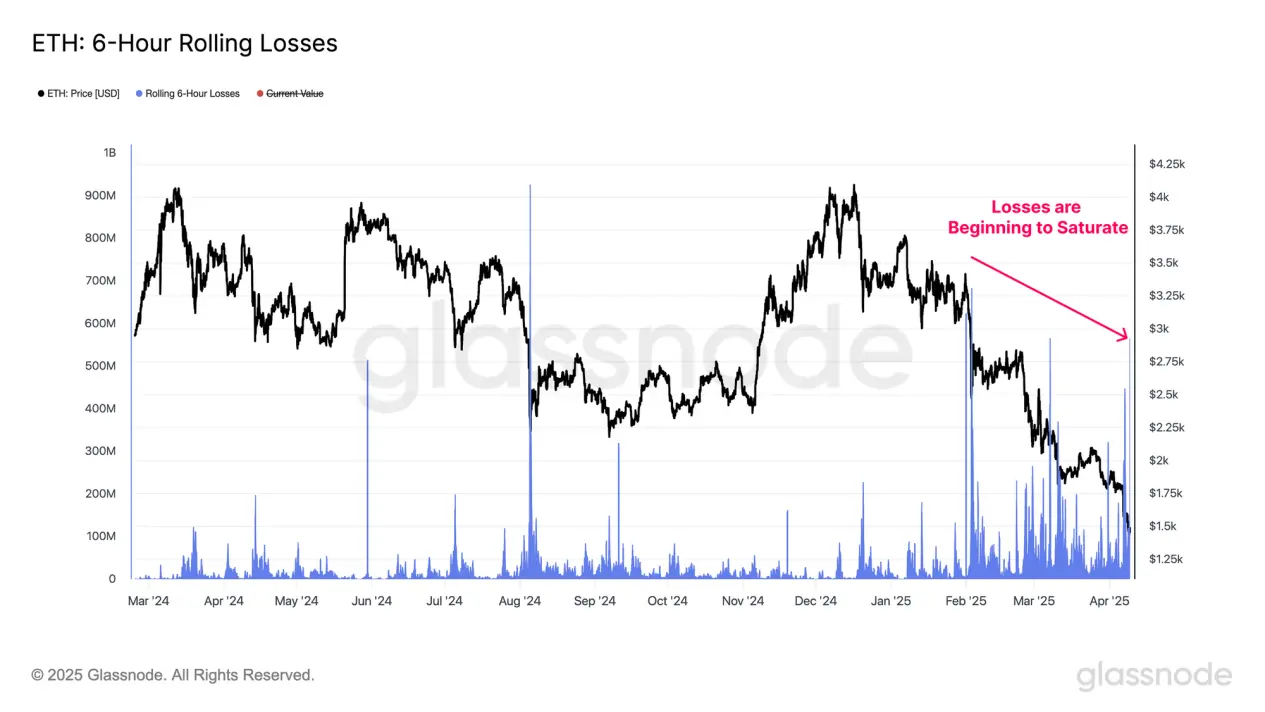
By evaluating realized losses within a rolling 6-hour window, we gain better insight into market participants’ behaviors and emotional responses during this downturn.
Bitcoin investors saw relatively large-scale "capitulation selling," with peak realized losses reaching $240 million in a single 6-hour window—one of the largest loss events in this cycle.
However, as prices continue to fall, the magnitude of realized losses is gradually shrinking, suggesting possible signs of short-term selling exhaustion at current price levels.
Ethereum exhibits a similar pattern. During this downturn, a single realized loss event reached up to $564 million—the largest such sell-off since the bull market began in January 2023.
As prices decline further, both Bitcoin and Ethereum show diminishing realized loss magnitudes, possibly indicating investors are adapting to lower price levels and the current volatile environment.
Market-Wide Contraction
Ongoing tightening of market liquidity has triggered significant devaluation across the entire altcoin sector. Assets further along the risk curve are especially sensitive to liquidity shocks and typically experience more pronounced price corrections.
By December 2024, the total market cap of altcoins (excluding Bitcoin, Ethereum, and stablecoins) reached a cycle high of $1 trillion. Since then, it has sharply retreated to $583 billion—over a 40% decline in just a few months.
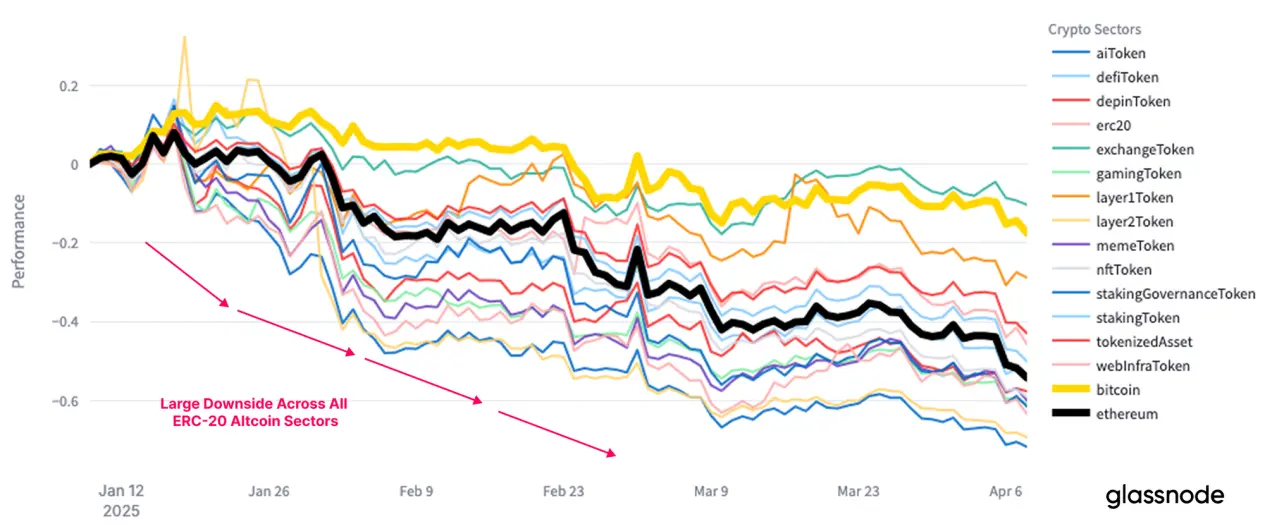
Notably, during this correction, different altcoin sub-sectors did not exhibit significant differentiation in performance. The decline has been broadly uniform, with all subgroups suffering substantial depreciation—even Bitcoin recorded negative returns over the past three months.
Range Analysis
Finally, we evaluate how the market reacts to key technical indicators and on-chain cost zones. These reference tools help investors make informed decisions amid volatile and uncertain conditions.
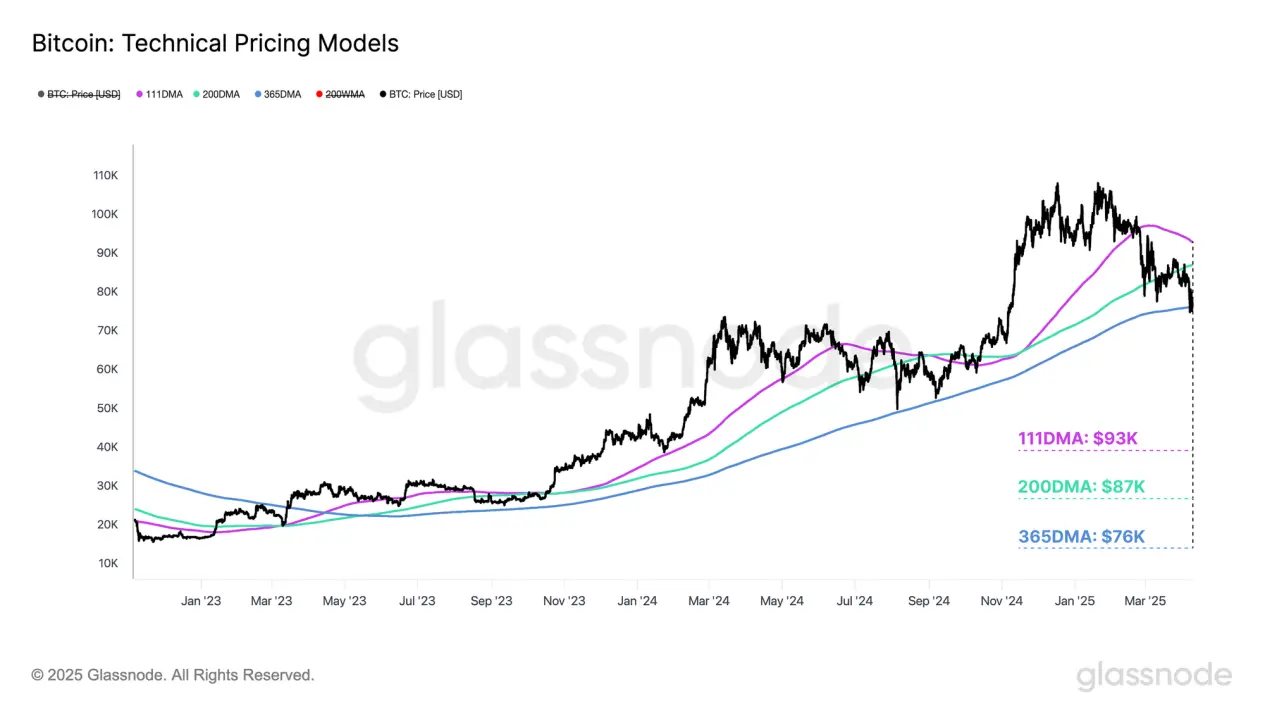
Technical analysis has long been a vital tool for investors, and Bitcoin traders often monitor key moving averages. The 111-day, 200-day, and 365-day moving averages (111DMA, 200DMA, 365DMA) are commonly used to gauge Bitcoin’s market momentum.
The following technical framework can guide analysis:
-
Bitcoin’s initial break below the 111-day MA ($93,000) signaled a major blow to market momentum, followed by no effective rebound attempt.
-
After the first drop, prices oscillated around the 200-day MA ($87,000), widely viewed by technical analysts as the bull-bear dividing line. Market hesitation at this level ultimately led to renewed downside, initiating another leg lower.
-
Recently, prices broke below the 365-day MA ($76,000) for the first time since the 2021 cycle. This key momentum support has not yet been fully lost, but failure to stabilize above it may trigger further downside.
During bull market phases, short-term holders (STH) typically bear the brunt of panic-driven sell-offs. Their behavioral and emotional shifts serve as important indicators for assessing the intensity of market corrections and investor responses.
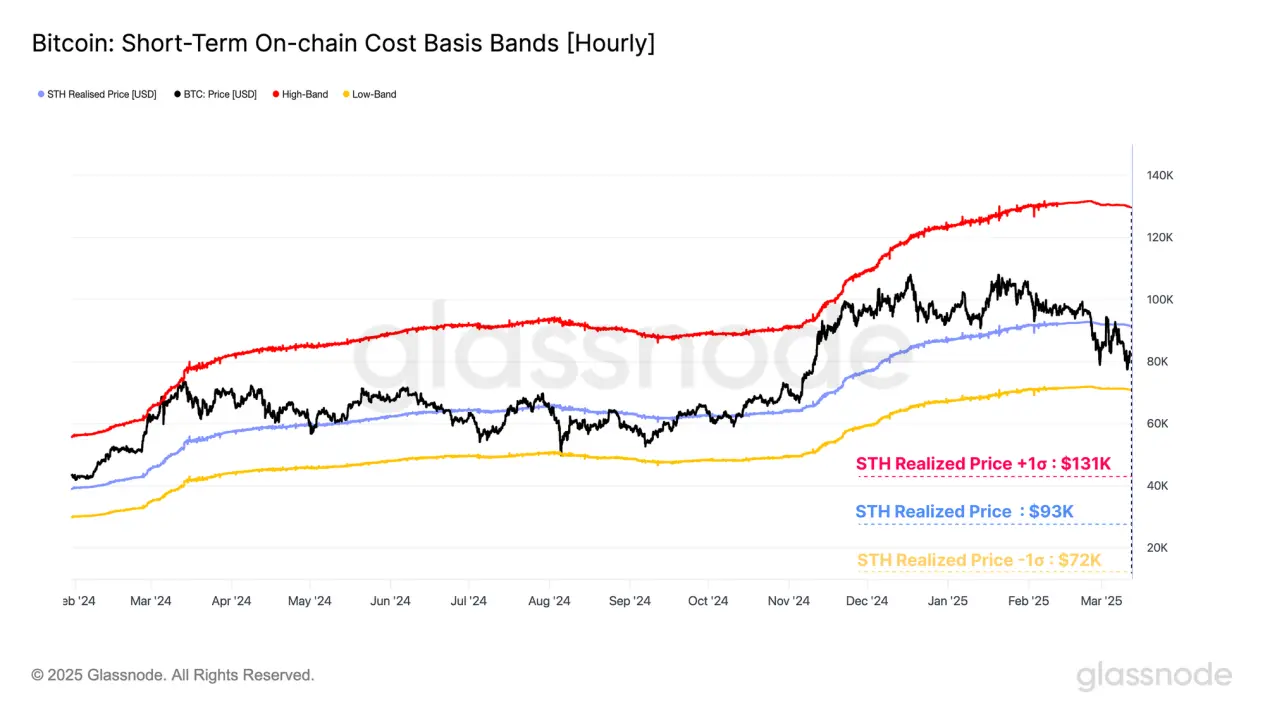
The Short-Term Holder Cost Basis (STH-CB) has historically served as a key benchmark for gauging market momentum during bull runs. A ±1 standard deviation band around this cost basis often defines upper and lower bounds of local price fluctuations.
-
STH Cost Basis +1σ: $131,000
-
STH Cost Basis: $93,000
-
STH Cost Basis -1σ: $72,000
Bitcoin’s initial break below the STH Cost Basis signaled weakening momentum (and coincided with the break below the 111-day MA). Subsequent bounces failed to reclaim this level, confirming a shift in investor sentiment.
Currently, Bitcoin’s spot price has stabilized between the STH cost basis and its -1σ level, forming the current trading range boundaries: $93,000 to $72,000.
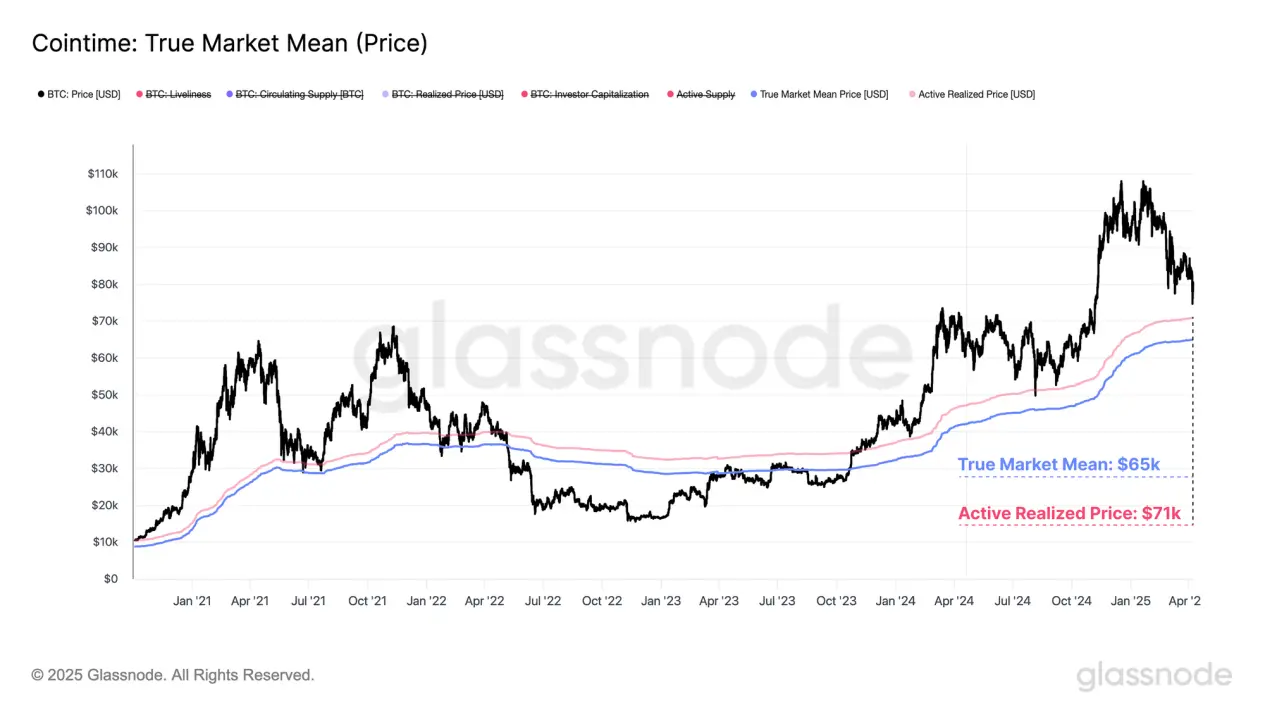
The Active Realized Price and True Market Mean are alternative pricing models typically located near the center of Bitcoin cycles. These models estimate the cost basis of actively participating market participants by excluding lost or long-dormant supply.
Statistically, spot prices trade above or below these models on roughly 50% of trading days, making them important mean-reversion references and useful for delineating bull vs. bear market states.
-
Active Realized Price: $71,000
-
True Market Mean: $65,000
Consensus across multiple on-chain pricing models indicates that the $65,000–$71,000 range is a critical zone for bulls to establish long-term support. A decisive break below this range would place the majority of active investors in loss territory, potentially delivering a significant blow to overall market sentiment.
Conclusion
Escalating uncertainty surrounding U.S. tariff policies continues to weigh on global financial markets. This weakness has spread across nearly all asset classes, as evidenced by sharp pullbacks in major macro indices.
The digital asset market has not been spared, with broad contraction across all sub-sectors. Bitcoin briefly dipped to $75,000—one of its largest drawdowns since the bull market began in January 2023. Ethereum’s decline was even steeper, and many long-tail crypto assets are already deep in bear market territory.
Analysis combining multiple on-chain and technical price models suggests the $65,000–$71,000 range is a critical support zone for bulls to rebuild long-term confidence. If Bitcoin breaks below this range, market sentiment could suffer a major setback, as the vast majority of active investors would be sitting on unrealized losses.
Join TechFlow official community to stay tuned
Telegram:https://t.me/TechFlowDaily
X (Twitter):https://x.com/TechFlowPost
X (Twitter) EN:https://x.com/BlockFlow_News
 @glassnode