Will the US stock rebound last? Three major events will decide its fate
TechFlow Selected TechFlow Selected
Will the US stock rebound last? Three major events will decide its fate
Another wave of selling could be on the horizon.
 Navigating Web3 tides with focused insights
By Xiao Yanyan
Wednesday's sharp rally in U.S. stocks quickly fizzled out, with more than 300 S&P 500 components turning lower within less than two hours—suggesting investors hunting for a market bottom may need to wait a while longer.
That’s exactly what a series of technical indicators are now showing. While U.S. equities could see gains in the coming days or weeks, several key thresholds must still be cleared before a true rebound begins.
The initial surge on Wednesday was fueled by data showing February's consumer price index (CPI) rose at its slowest pace in four months, potentially giving the Federal Reserve grounds to cut interest rates earlier than expected. But inflation is no longer the primary driver for investors; economic growth is, along with trade threats stemming from Trump's tariff policies. Given these factors, investors remain in defensive mode.
"The CPI has become irrelevant," said Patrick Fruzzetti, portfolio manager at Rose Advisors. "It's all about growth now. Tariff headlines are driving the market on a daily basis. These kinds of volatilities will stay with us for some time, until new trade deals are reached—but I don't think that will happen soon."
From a technical perspective, the S&P 500 has struggled after ending a two-year uptrend this week. Chart watchers say the index needs to reclaim its 200-day moving average, currently around 5737. The index is now trading near 5580. Technically, the S&P 500 also appears oversold, another sign that Wall Street has turned bearish on stocks.
So the big question is: can this current bounce last?
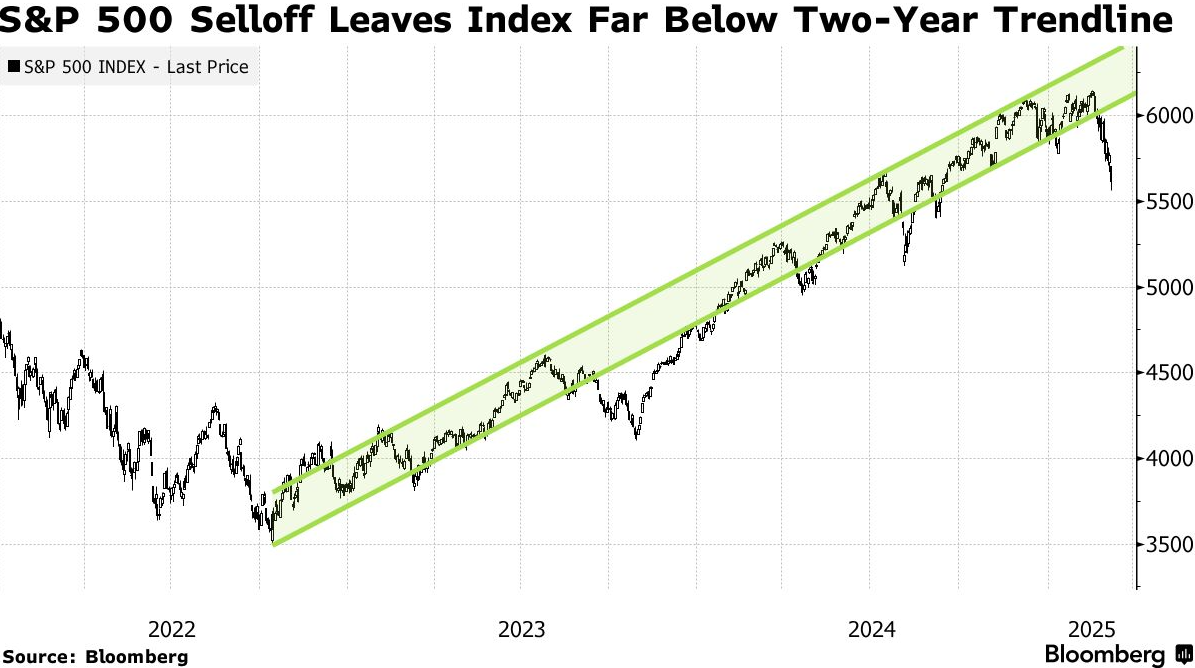
The S&P 500 has decisively broken below its 2-year trendline
"We're not buyers on dips," Stuart Kaiser, head of U.S. equity trading strategy at Citigroup, told clients late Tuesday. He continues to see risks in high-priced tech stocks and believes there's little chance either Trump or the Fed will step in to support the market, especially as the U.S. president warned Americans might feel "a little bit of disruption" from trade wars with Canada and Mexico.
Mark Newton, head of technical strategy at Fundstrat Global Advisors, believes traders cannot rule out the possibility of the S&P 500 falling further to 5500 in terms of index level.
The S&P 500’s 14-day relative strength index dipped just below the critical 30 level on Monday—the first time since October 2023. As of Tuesday’s close, only about 25% of stocks in the index were trading above their 20-day moving average, another signal of bearish sentiment. Traders typically look for fewer than 10% of index constituents above their 20-day moving average before sounding a clear “all-clear” signal.
Chart watchers consider stocks oversold when prices have fallen too far, too fast, leaving little room for further downside. But to confirm that recent market pain has passed, further improvement in technical signals such as breadth and volume is needed.

Market breadth remains well below November's peak
Currently, about 38% of S&P 500 stocks are trading above their 200-day moving average. Ari Wald, Oppenheimer’s senior analyst, noted that this figure usually needs to fall below 20% before traders interpret it as a full capitulation in the stock market.
What unfolds over the next few weeks—including the Fed’s March 19 rate decision, the March 21 “triple witching day” (when stock options, stock index futures, and index options expire simultaneously, amplifying volatility), and month-end portfolio rebalancing—will be crucial in determining whether bears continue pushing indices lower.
John Kolovos, head of technical strategy at Macro Risk Advisors, said whether the S&P 500 can break through 5665—its July 2024 high—is the pivot point between entering a sideways range or enduring further pain.
"We’re setting up for a **decent-sized rally**, but the speed of the recent decline may leave some scar tissue," Kolovos said.
Craig Johnson, chief market technical analyst at Piper Sandler, believes bulls will regain control if the S&P 500 breaks above its 50-day moving average near 5975—a level more than 7% above Tuesday’s closing price.
"Investor sentiment has turned so **extremely bearish** that it’s actually time to turn bullish," Johnson said. "People are more pessimistic now than they were during the pandemic lockdowns in 2020—that’s insane. This isn’t a crisis."

Selling pressure hasn't been intense enough to signal a bottom
Chart watchers want to see moves supported by broad-based volume, rather than a handful of companies lifting major indexes. The Arms Index, also known as the short-term trading index (TRIN), compares the number of advancing and declining stocks with their respective trading volumes.
Todd Sohn, managing director of ETF and technical strategy at Strategas Securities, explained that a TRIN reading above 2.0 indicates active stock selling, while readings below 0.5 signal rising demand. After Tuesday’s selloff, the index stood at 0.8—suggesting that another wave of selling may still lie ahead before the market is ready for a genuine rebound.
Join TechFlow official community to stay tuned
Telegram:https://t.me/TechFlowDaily
X (Twitter):https://x.com/TechFlowPost
X (Twitter) EN:https://x.com/BlockFlow_News