

The American Grand Debt Cycle Everyone Should Understand: Risks, Opportunities, and Reflections
TechFlow Selected TechFlow Selected
The American Grand Debt Cycle Everyone Should Understand: Risks, Opportunities, and Reflections
The dilemma of U.S. debt cannot be resolved anytime soon and will ultimately have to be addressed through the two aforementioned paths for handling debt crises.
This article references Ray Dalio's new book "How Countries Go Broke," and concludes with my personal analysis of the opportunities and risks within America's long-term debt cycle, serving only as supplementary guidance for investment decisions.
First, let me introduce Dalio—the founder of Bridgewater Associates, who has successfully predicted major economic events such as the 2008 financial crisis, European debt crisis, and Brexit. He is often referred to as the Steve Jobs of investing. Now, let’s proceed to the main content.
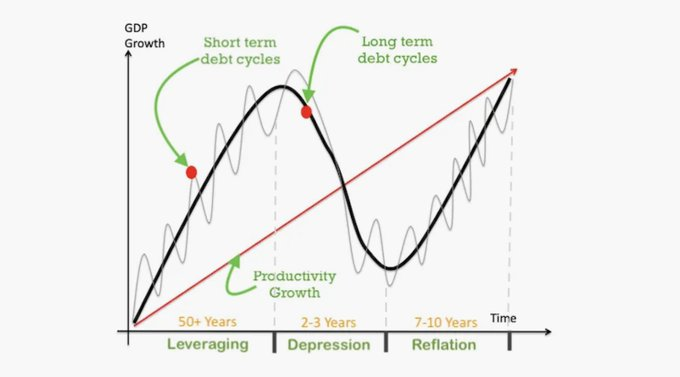
When studying debt in the past, attention was usually focused on credit cycles that align with business cycles (approximately 6 years ±3 years). However, the long-term debt cycle is more fundamental and significant. Since 1700, there have been about 750 currencies or debt markets globally, but today only around 20% remain. Even among surviving currencies, most have experienced severe depreciation—closely tied to what the book calls the “long-term debt cycle.”
The key difference between short-term and long-term debt cycles lies in whether central banks can reverse the cycle. During traditional deleveraging in a short-term debt cycle, central banks lower interest rates and increase credit supply. But during a long-term debt cycle, the situation becomes extremely difficult because debt growth has become unsustainable. A typical path through a long-term debt cycle follows this sequence: healthy private sector → excessive private borrowing and inability to repay → government steps in and over-borrows → central bank prints money and buys government debt to assist (acting as the lender of last resort).
A long-term debt cycle typically lasts about 80 years and consists of five stages:
1) Sound Money Stage: Initially, interest rates are low, and returns from borrowing exceed capital costs, leading to debt expansion.
2) Debt Bubble Stage: As debt expands, the economy booms, and certain asset prices (such as stocks and real estate) begin rising. With increasing asset values and sustained economic prosperity, the private sector gains greater confidence in its repayment capacity and expected returns, fueling further debt expansion.
3) Top Stage: Asset prices enter bubble territory, yet debt expansion continues unabated.
4) Deleveraging Stage: Waves of debt defaults erupt, asset prices plummet, aggregate demand contracts, resulting in a debt-deflation spiral (Fisher effect), nominal interest rates hit zero lower bound, real interest rates rise due to deflation, and debt burdens intensify.
5) Debt Crisis Stage: Both asset and debt bubbles burst. Borrowers who leveraged to buy assets may no longer be able to service their debts. The entire economy faces insolvency and debt restructuring, marking the end of the long-term debt crisis and the beginning of a new equilibrium and cycle.
At each of these distinct phases, central banks must adopt different monetary policies to maintain stability in debt and the economy. Therefore, we can also use monetary policy actions to identify which phase of the long-term debt cycle we are currently in.
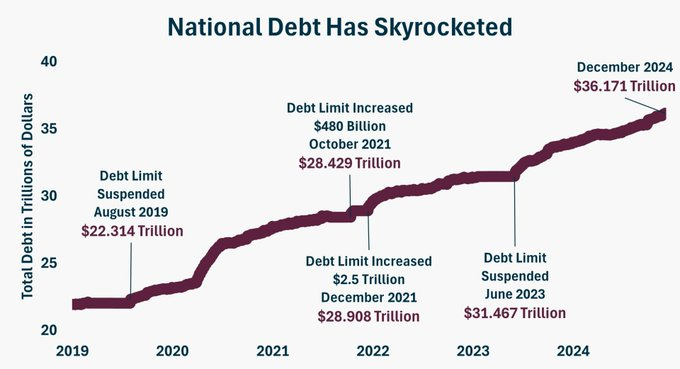
Since 1945, the U.S. has gone through 12.5 short-term debt cycles. This year, U.S. debt interest expenses are projected to exceed $1 trillion, while total government revenue stands at only $5 trillion. In other words, for every $4 the U.S. government collects, $1 goes toward paying interest on debt!
If this trend continues, the U.S. government will find it increasingly difficult to service its debt, eventually being forced into debt monetization (printing money to pay debts), which would further drive up inflation and cause severe currency depreciation. Thus, the U.S. is now in the latter half of the long-term debt cycle—on the verge of Stage 3, the “Top Stage,” meaning a debt crisis may be imminent.
Next, let's review the first long-term debt cycle the U.S. experienced from 1981 to 2000, broken down into several short-term cycles.
First short-term cycle (1981–1989): The second oil crisis in 1979 plunged the U.S. into a "stagflation 2.0" era. From February to April 1980, the U.S. prime lending rate was raised nine times consecutively, climbing from 15.25% to 20.0%. Inflation reached historic highs, as did interest rates. To avoid systemic risk, monetary policy shifted from tight to loose: from May to July 1980, the Federal Reserve cut interest rates three times by 100 basis points each, lowering the rate from 13.0% to 10.0%, totaling a 300 bp reduction. After Reagan took office in 1981, defense spending surged dramatically. Government leverage spiked during this period, with outstanding debt rapidly expanding and peaking in 1984 within this long-term debt cycle, with deficits reaching 5.7% of GDP. In May, Continental Illinois, one of the top ten U.S. banks, suffered a run and received emergency financial assistance from the FDIC on May 17—the largest bank failure resolution in FDIC history. In June, the prime lending rate continued rising until the Plaza Accord in 1985, which forced dollar depreciation. Following the accord, the Gramm-Rudman-Hollings Act of 1985 was introduced, mandating that the federal government achieve a balanced budget by 1991. On October 28, 1985, Fed Chair Paul Volcker stated the economy needed lower interest rates. During this phase, the Fed gradually reduced rates from 11.64% to 5.85% to re-stimulate growth.
However, Alan Greenspan, who became Fed Chair in 1987, tightened monetary policy again. Rising financing costs dampened corporate and household borrowing appetite, and rate hikes contributed significantly to the “Black Monday” stock market crash, further slowing economic growth. In 1987, Reagan signed legislation aimed at reducing fiscal deficits, and government leverage growth began to decline. Leverage across sectors slowed steadily through the end of 1989, and overall societal leverage plateaued.
Second short-term cycle (1989–1992): The Gulf War erupted in August 1990, causing international oil prices to surge sharply. CPI rose to its highest level since 1983, and GDP growth turned negative in 1991. Unemployment rose significantly starting March 1991. To combat stagflation, the Fed adopted an accommodative monetary policy, cutting the federal funds target rate from a peak of 9.8125% down to 3%. Massive fiscal expenditures from war efforts caused a spike in government leverage, driving up societal leverage growth in 1991. On April 1, 1992, Japan experienced a stock market crash, with the Nikkei index falling below 17,000—down 56% from its January 1990 high of 38,957. Stock markets in Japan, the UK, France, Germany, and Mexico all fell in tandem due to deteriorating economies. To counter global recession, the Fed cut rates again by 50 bps on July 2.
Third short-term cycle (1992–2000): The Clinton administration, taking office in 1992, sought to balance the budget through higher taxes and spending cuts. However, favorable post-war economic conditions and strong growth expectations boosted borrowing appetite among households and businesses, pushing up incremental societal leverage. Economic expansion resumed, inflation picked up again, and the Fed began raising rates in February 1994, hiking six times consecutively by a total of 3 percentage points to 6%. By December 1994, short-term rates had risen significantly faster than long-term rates due to the Fed’s aggressive hikes, causing the yield curve to invert. From early 1994 to mid-September, U.S. bond markets lost $600 billion in value, with global bond markets losing $1.5 trillion for the year—known as the infamous 1994 bond market crash.
Then came the Asian financial crisis in 1997 and the Russian debt crisis in 1998, which directly caused the sudden collapse of Long-Term Capital Management (LTCM), one of America’s four largest hedge funds. On September 23, Merrill Lynch and J.P. Morgan led a consortium to take over LTCM. To prevent financial market volatility from hampering U.S. growth, the Fed cut rates by 50 bps in Q3 1998. Meanwhile, enthusiasm for internet companies surged, non-government leverage growth accelerated, with corporate leverage hitting its highest level since 1986, driving up overall societal leverage.
In 2000, the dot-com bubble burst, with Nasdaq plunging 80%. After the burst, both non-government leverage growth and GDP growth declined sharply. Societal leverage growth turned negative, signaling a drop in total leverage. The economy entered recession, inflation fell, triggering another round of credit easing and recovery—marking the end of this debt cycle.
Afterward, during the 2008 financial crisis, U.S. unemployment hit 10%, and global interest rates dropped to 0%, leaving no room to stimulate the economy via rate cuts. The Fed launched its largest-ever debt monetization program—printing money to buy debt. From 2008 to 2020, the U.S. implemented quantitative easing (QE) through central bank balance sheet expansion—essentially money printing, debt monetization, and QE. Starting late 2021, tightening began to fight inflation: Treasury yields rose, the dollar strengthened, and by 2021, the Nasdaq had fallen 33% from its peak. High interest rates also led to losses at the Fed.
Having briefly reviewed one full debt cycle, and recalling earlier that the U.S. is now nearing the brink of the “Top Stage,” where the long-term debt cycle progresses from the private sector to the government to the Fed—what happens when the cycle reaches the central bank?
Step One: The Fed expands its balance sheet and monetizes debt
When a debt crisis hits and rates can’t be lowered further (e.g., already at 0%), the central bank prints money to buy bonds—a process that began in 2008 known as quantitative easing (QE). The U.S. has conducted four rounds of QE, purchasing large amounts of Treasuries and MBS. QE involves buying longer-duration assets, which artificially suppresses Treasury yields and channels money into risk assets, inflating their prices.
The money for QE is created through reserves (funds commercial banks hold at the Fed). When the Fed buys bonds from banks, it doesn’t spend cash—it simply credits the banks’ reserve accounts.
Step Two: When interest rates rise, the central bank incurs losses
The Fed earns interest income and pays interest expenses. Its balance sheet structure is “borrow short, lend long”—paying interest on short-dated liabilities like Reverse Repo (RRP) and Reserves, while earning interest on longer-dated assets like Treasuries and MBS. But since the 2022 rate hikes, the yield curve has inverted, meaning the Fed is paying more on short-term liabilities than it earns on long-term assets—resulting in losses. The Fed lost $114 billion in 2023 and $82 billion in 2024.
Previously, when the Fed made profits, it remitted them to the Treasury. Now, due to losses, these remittances turn into deferred assets (“Earnings remittances due to the U.S. Treasury”), which have accumulated to over $220 billion.
Step Three: When central bank net worth turns deeply negative—entering a death spiral
If the Fed keeps losing money, it could eventually see its net worth plunge deep into negative territory—a true red flag. This marks the onset of a death spiral: rising interest rates cause creditors to recognize problems and sell off debt, pushing rates even higher, triggering further selloffs in debt and currency, ultimately leading to currency depreciation and either stagflation or depression.
At this stage, the Fed faces a dilemma: it must maintain loose policy to support a weak economy and fiscally strained government, while simultaneously needing tight policy (high rates) to prevent currency selloffs.
Step Four: Deleveraging, debt restructuring, and currency depreciation
When debt burdens become too heavy, large-scale restructuring and/or currency depreciation occur, drastically reducing debt levels and value. Currency depreciation wipes out the real purchasing power of currency and debt holders. Only after establishing a new credible monetary system—one capable of attracting investors and savers back—can stability return. Governments often implement extraordinary measures such as wealth taxes and capital controls during this phase.
Step Five: Restoring balance and launching a new cycle
When debt is devalued and the cycle nears its end, the Fed may peg the currency to hard assets (e.g., gold), enforcing a strict transition from rapidly depreciating money to relatively stable money under conditions of tight monetary policy and high real interest rates—thus establishing a new cycle.
Based on the above, we can conclude that the U.S. is currently transitioning from Step Two (central bank losses) to Step Three (deeply negative central bank net worth and entering a death spiral). So what will the Fed do next?
Typically, there are two paths to control debt. One is financial repression—effectively suppressing interest costs. The other is fiscal control, i.e., reducing non-interest deficits. Suppressing interest costs means cutting rates to ease interest payment pressure. Reducing non-interest deficits can be achieved either by cutting spending or raising taxes—both of which the Trump administration is actively pursuing: the Department of Government Efficiency (DOGE) aims to reduce fiscal expenditure, while tariff policies boost government revenue.
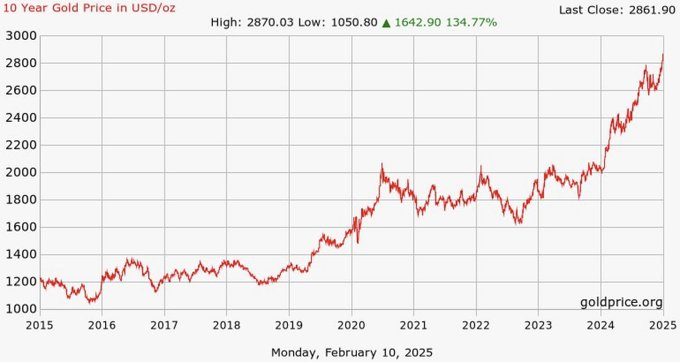
Despite Trump’s vigorous moves, global financial markets aren't fully convinced. Central banks worldwide have been consistently buying gold. Gold is now the third-largest reserve currency globally, behind only the U.S. dollar and euro, surpassing the Japanese yen.
The U.S. currently faces a serious fiscal issue—rolling over old debt with new debt. Issuing new bonds to fill budget gaps creates even higher interest payments, trapping the U.S. in a “vicious debt cycle” that could ultimately lead to an “unpayable” situation.
Under these circumstances, the U.S. Treasury dilemma cannot be resolved quickly. Ultimately, it will still have to follow one of the two crisis-resolution paths outlined above. Therefore, the Fed is likely to choose to suppress interest costs and relieve interest payment pressure. While rate cuts won’t solve the debt problem fundamentally, they can temporarily alleviate some interest burden, giving the government more time to manage its massive debt load.
This move toward rate cuts also aligns closely with Trump’s “America First” agenda. Markets widely believe that Trump’s tariff and fiscal policies, if re-elected, would send U.S. deficits “racing out of control,” damaging U.S. credit and pushing inflation and rates higher. Yet in reality, the dollar’s recent strength stems largely from relatively steeper declines in interest rates abroad (currencies in countries with higher relative interest rates tend to appreciate), and the fall in Treasury prices (rise in yields) is just a normal short-term rebound within a broader rate-decline cycle.
As for market expectations of reflation—unless Trump triggers a fourth oil crisis, there’s no logical reason why he would want to push inflation higher, especially since Americans deeply detest inflation.
Why then has rate cutting remained elusive? Throughout this year, rate cut expectations have repeatedly swung back and forth. I believe the Fed avoids letting cut expectations become overly priced-in; right now, maintaining a “hawkish” stance preserves room for future “dovish” action.
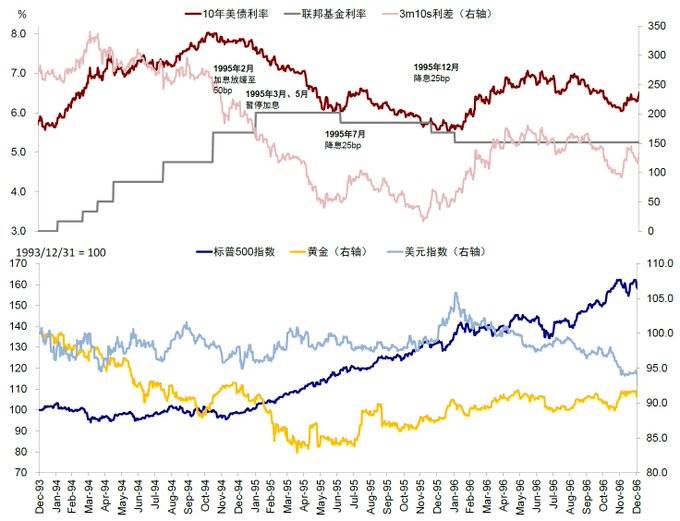
Looking back at historical experience since 1990, the Fed paused rate cuts in August 1989 and August 1995 to assess economic momentum before deciding on the pace and magnitude of further easing. For example, after a “preventive” cut in July 1995, the Fed held steady for three consecutive meetings until the U.S. government shut down twice due to budget disagreements, prompting another 25 bp cut in December 1995.
Therefore, following market consensus blindly often leads to flawed conclusions. Instead, we should “think inversely, act contrarily.” So what opportunities lie ahead?
1. From a dollar-denominated asset perspective, gold remains a strong holding; U.S. Treasuries, especially long-dated ones, are poor investments.
2. At some point, the U.S. will proactively or reactively begin cutting rates. We should prepare accordingly and closely monitor the 10-year Treasury yield.
3. Bitcoin remains a high-quality investment within risk assets, with enduring value resilience.
4. If U.S. equities experience a significant pullback, consider buying quality tech stocks on dips in batches—they still offer attractive risk-return profiles.
Join TechFlow official community to stay tuned
Telegram:https://t.me/TechFlowDaily
X (Twitter):https://x.com/TechFlowPost
X (Twitter) EN:https://x.com/BlockFlow_News


