WOO X Research: Is the bull market still alive? What's really happening? Five indicators to check if we've hit the top
TechFlow Selected TechFlow Selected
WOO X Research: Is the bull market still alive? What's really happening? Five indicators to check if we've hit the top
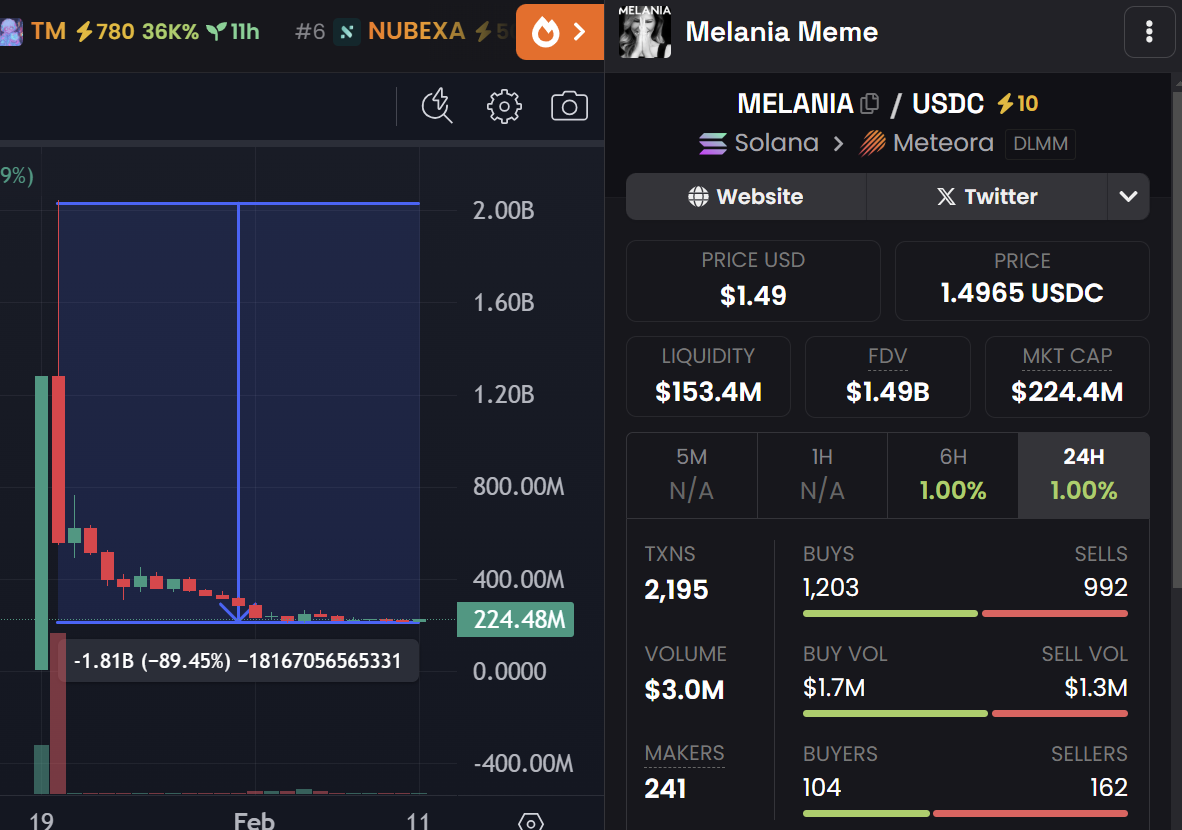
In hindsight, Melania's token launch marked a short-term high.
 Navigating Web3 tides with focused insights
Recently, Bitcoin has continued to hover around $100,000, while most altcoins have seen their prices halved, with declines of 70% or even 80% becoming commonplace. Bitcoin's market dominance (BTCD) has also rapidly increased from a low of 54% in early December 2024 to 61%, providing data-backed evidence that amid Bitcoin price volatility, broad declines across altcoins have become an undeniable reality.
So, what recent events have led the crypto market into an ice age?
-
Trump and his family launching tokens, Deepseek R1 release, U.S. tariff war.
Trump's token launch captured massive market attention, viewed as bullish for the market, but his wife Melania’s subsequent token launch was seen as a "cash grab," not only diverting attention and market liquidity but also undermining overall industry confidence.
The release of Deepseek R1 announced to the world that a state-of-the-art LLM could be built for just $5.5 million—on par with or even surpassing current leading models—triggering concerns about computing power oversupply. NVDA's stock plunged 17% that day. However, fears over computing oversupply are misplaced: more efficient training models actually mean advanced chips and stronger computing power can build even more powerful models, making this short-term negative but long-term positive. In the Web3 space, this scenario prompted market reflection: if a functional AI product can now be built for $5.5 million, why should we buy AI Agent projects valued at over $100 million whose products remain fragmented and incomplete?
On February 1, 2025, Trump signed an executive order imposing 25% and 10% tariffs on imports from Canada, Mexico, and China respectively. Looking back at the 2018–2020 trade war, its impact on the cryptocurrency market was “short-term volatility, long-term bullish.” Combined with a one-month delay in tariffs on Mexico and Canada, the link between tariffs and the crypto market is indirect and secondary—tariffs primarily affect the broader U.S. economy, which in turn affects the crypto market.
What shifts have occurred in crypto narratives recently?
-
Trump-led celebrity token trend, AI Agent bubble burst, SocialFi revival, BNB Chain ecosystem resurgence?
Celebrities usually avoid launching tokens due to regulatory and reputational concerns. But when even U.S. President Trump launched a token, it removed hesitations for other celebrities considering similar moves. However, since no subsequent celebrity can match Trump’s fame and influence, this narrative resembles short-lived PVP hype with very limited sustainability.
The rise of celebrity tokens, combined with the Deepseek R1 release, diverted attention away from the AI Agent sector. The entire sector’s market cap dropped over 60% from its peak, with leading projects like Virtual and AI16Z falling roughly 70% from highs. Newly launched AI projects fared even worse, with most essentially ending in zero value.
Extending from the celebrity token trend, beyond simply announcing token launches on their own Twitter accounts, some accounts were hacked to deploy token contracts (though this may itself be a launch tactic). To verify authentic celebrity involvement, two SocialFi platforms, Clout and Tribe, emerged, linking directly with Twitter for identity verification—similar in concept to the earlier Friend Tech. Amid overall market cooling and severe criticism over insider dumping ("rat farming") by project teams, SocialFi generated less than a week of market excitement.
Going back to February, TST—a test token originating from Binance—sparked a rapid market frenzy after a tweet from CZ. Its market cap surged from under $10 million to a peak of $500 million almost instantly. However, it failed to sustain above the $500 million mark and crashed over 60% the next day, signaling the end of the BNB Chain-driven market narrative.
Reviewing these recent crypto narratives, one key characteristic stands out: extremely short lifespans. This suggests the current market is in a zero-sum state, where one sector’s surge means capital flight from another, with no truly sustainable, high-quality investment sectors emerging. Could this be a sign that the market has peaked? Next, we use three metrics to assess the current market stage.
Reference: dexscreener
Top-Timing Indicator: Not Peaked Yet
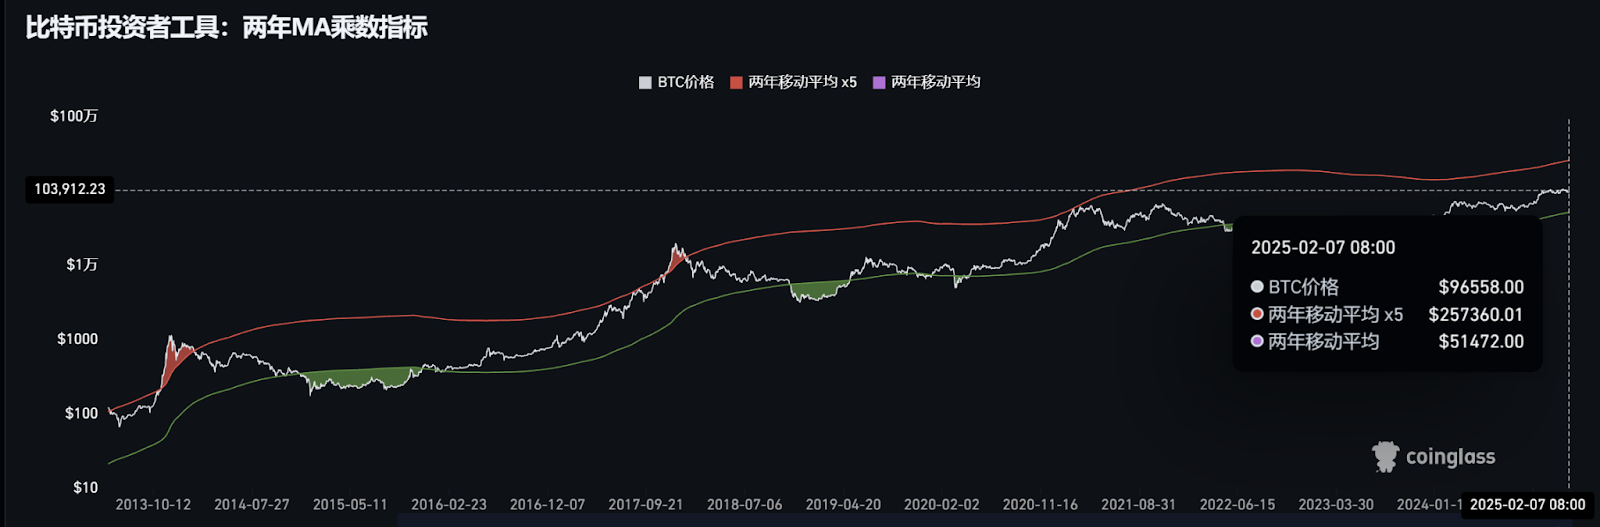
The Two-Year MA Multiplier indicator serves as a long-term investment tool, highlighting periods when buying or selling Bitcoin generates substantial returns. It uses the 2-year moving average (equivalent to the 730-day line, green line) and five times that moving average (red line).
Historically: When price falls below the 2-year MA (green line), it signals a bottom-feeding buying opportunity, generating excess returns. When price exceeds 2-year MA x 5 (red line), it signals a top-exit selling opportunity, yielding significant profits.
Currently, Bitcoin’s price remains far below the 2-year MA x 5 level ($257,360). According to this signal, the overall crypto market has not yet peaked.
Reference: dexscreen
AHR999 Indicator: Slightly Above DCA Range
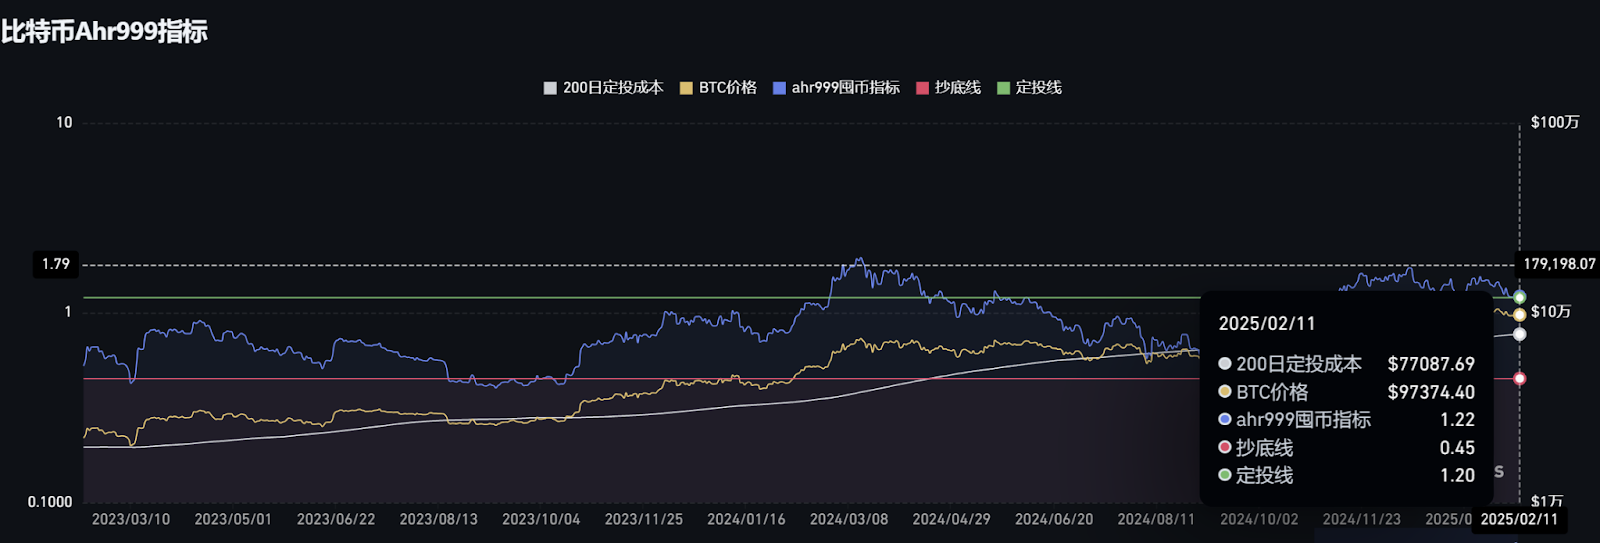
This indicator reflects short-term Bitcoin DCA (dollar-cost averaging) returns and the deviation of Bitcoin’s price from its expected valuation.
-
When the AHR999 index is below 0.45, it’s time to accumulate;
-
When the AHR999 index is between 0.45 and 1.2, it’s suitable for DCA;
-
When the AHR999 index exceeds 1.2, prices are relatively high and unsuitable for action.
In the long term, Bitcoin’s price shows a certain positive correlation with block height. Using DCA allows users to control short-term costs, keeping them mostly below Bitcoin’s actual price.
The current AHR999 value is 1.22, barely within the DCA range. By this metric, current prices are “not cheap,” but still far from a market top.
Reference: coinglass
Pi Cycle Top Indicator: Top Likely at Least $145,000
This indicator uses two data sets to determine whether Bitcoin is overheated:
111-day moving average (111DMA, red line)
Double the 350-day moving average (350DMA x 2, green line)
Usage:
When the 111DMA rises and crosses above 350DMA x 2, it typically indicates Bitcoin has reached a top, serving as a sell signal.
How to interpret this indicator?
The Pi Cycle Top Indicator examines whether short-term prices have broken above the average cost basis of long-term holders, thus gauging market overheating. When the 111DMA (red line) crosses above 350DMA x 2 (green line), it often signals excessive optimism and FOMO (fear of missing out)—a typical overheating signal suggesting it may be time to consider selling.
According to the latest chart data, on November 6, 2024, Bitcoin was priced at approximately $96,549, while 350DMA x 2 stood at around $145,916—indicating the market is nowhere near a top.
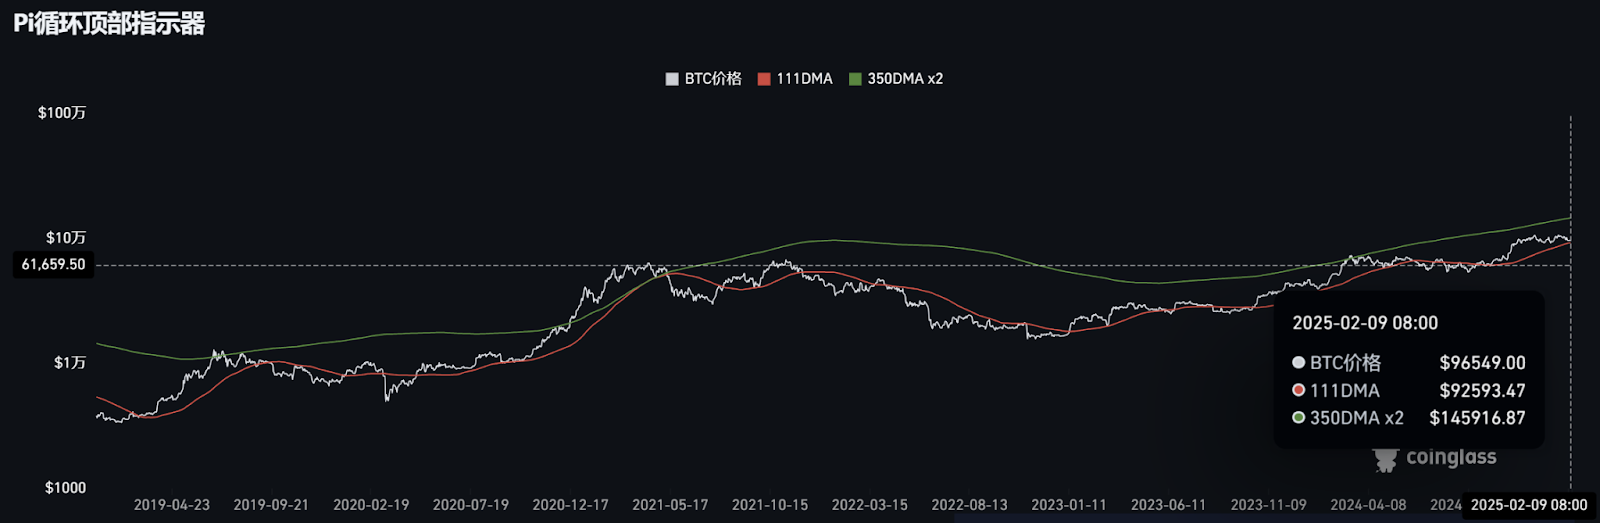
Reference: coinglass
Join TechFlow official community to stay tuned
Telegram:https://t.me/TechFlowDaily
X (Twitter):https://x.com/TechFlowPost
X (Twitter) EN:https://x.com/BlockFlow_News
 @WOOXResearch