
10 Charts to Help You Understand Solana's Super Weekend
TechFlow Selected TechFlow Selected
10 Charts to Help You Understand Solana's Super Weekend
Solana saw inflows of approximately $300 million within a week, primarily from Ethereum, Base, and Arbitrum.
 Navigating Web3 tides with focused insights
Author: Ignas | DeFi
Translation: TechFlow
Last weekend was one of the craziest in the history of crypto. Decentralized exchange (DEX) trading volume hit an all-time high, Solana stood out across multiple dimensions, and capital flows revealed significant market shifts.
Below are 10 charts that quickly illustrate the data and trends behind this phenomenon.
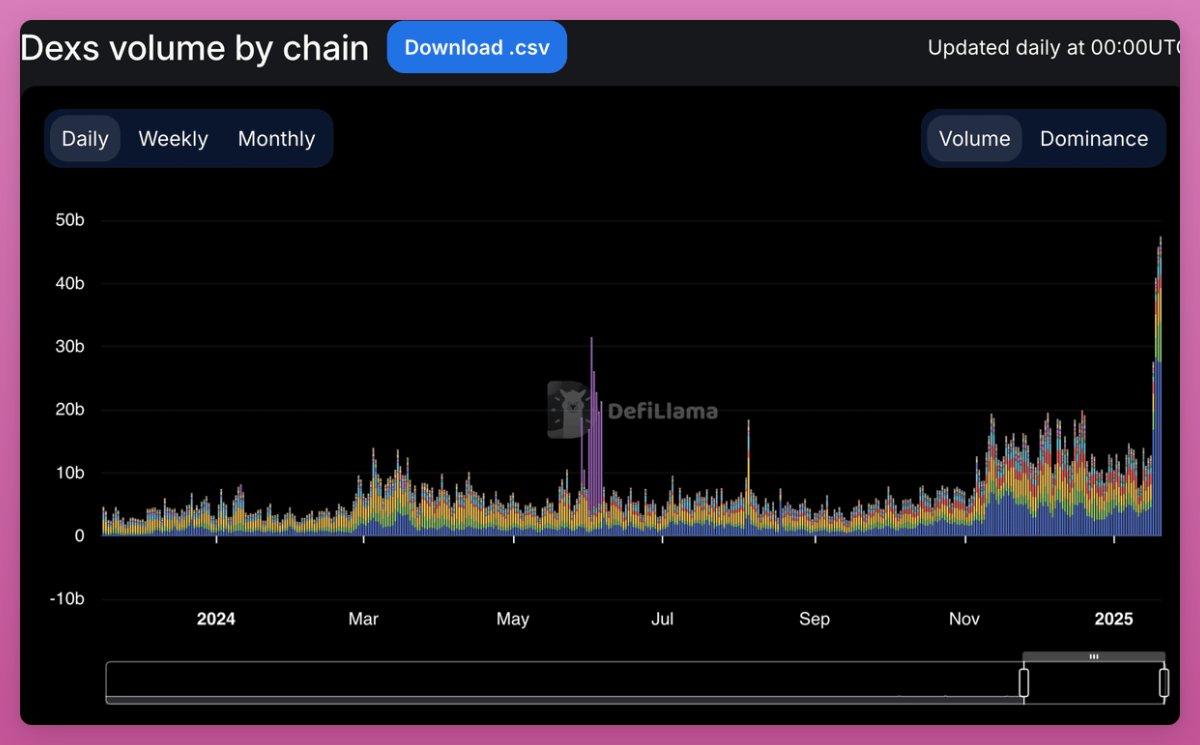
1. DEX Trading Volume Reaches All-Time High
Solana's decentralized exchange (DEX) trading volume reached $27 billion, far surpassing Ethereum's $5 billion.
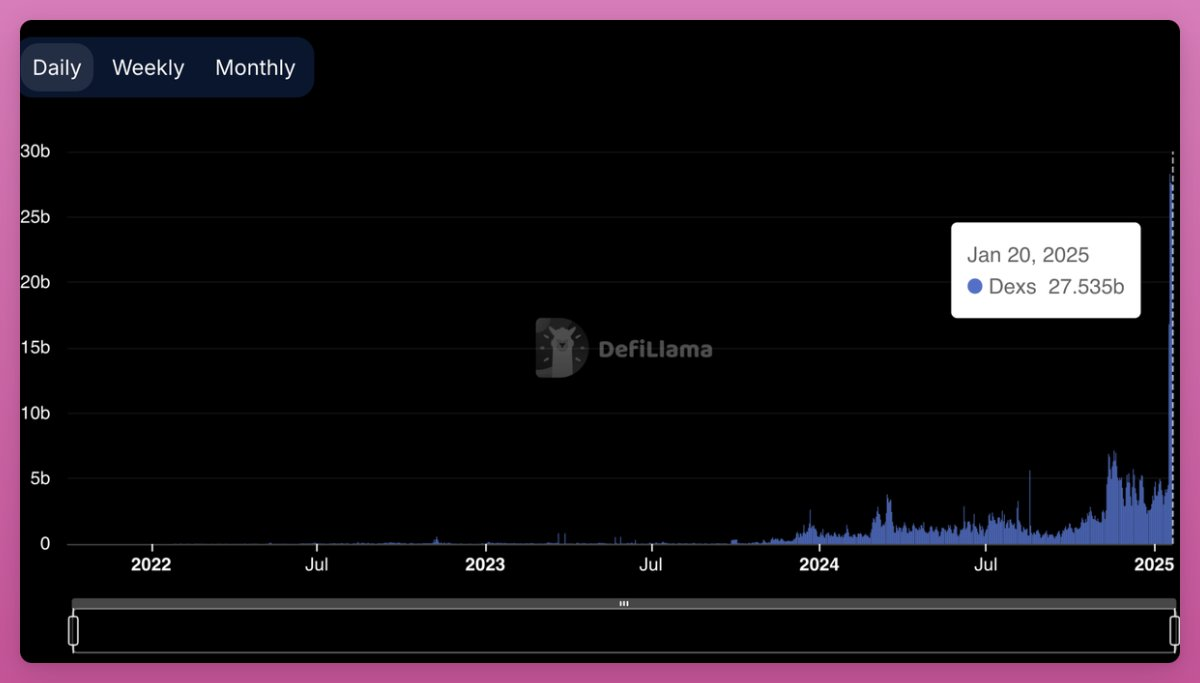
2. Solana DEX Trading Volume Surges
Solana’s DEX trading volume skyrocketed from an average of around $5 billion to $27 billion, a 5.4x increase.
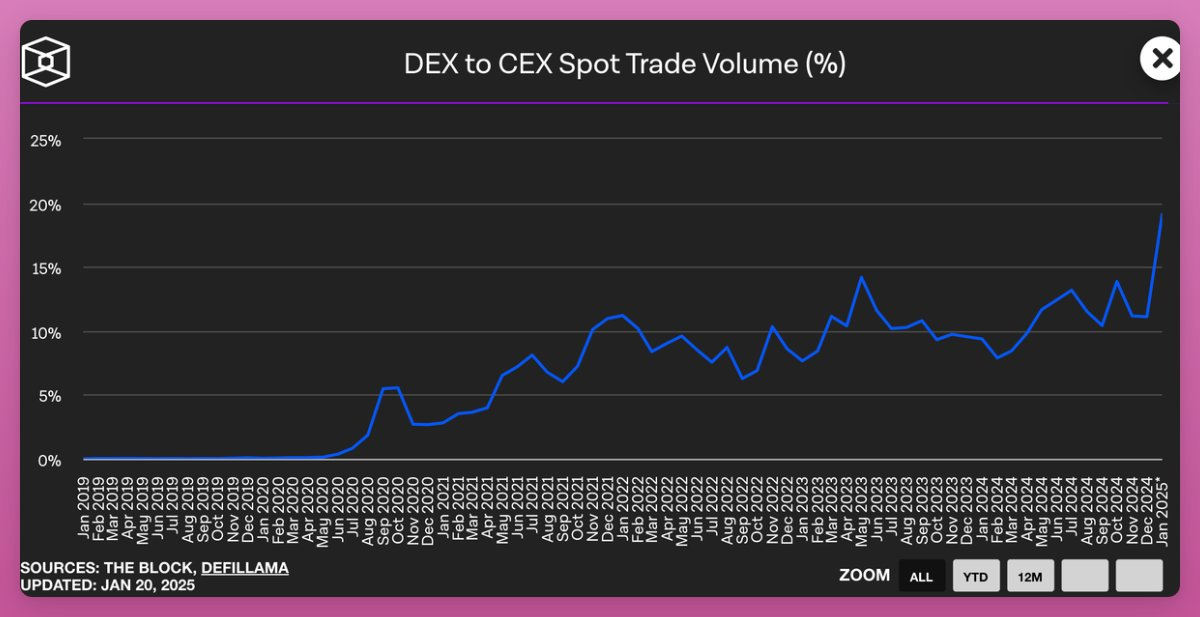
3. DEX-to-CEX Trading Volume Ratio Hits Record High
As a result of this trend, the ratio of DEX to centralized exchange (CEX) trading volume reached a record high of 19%.
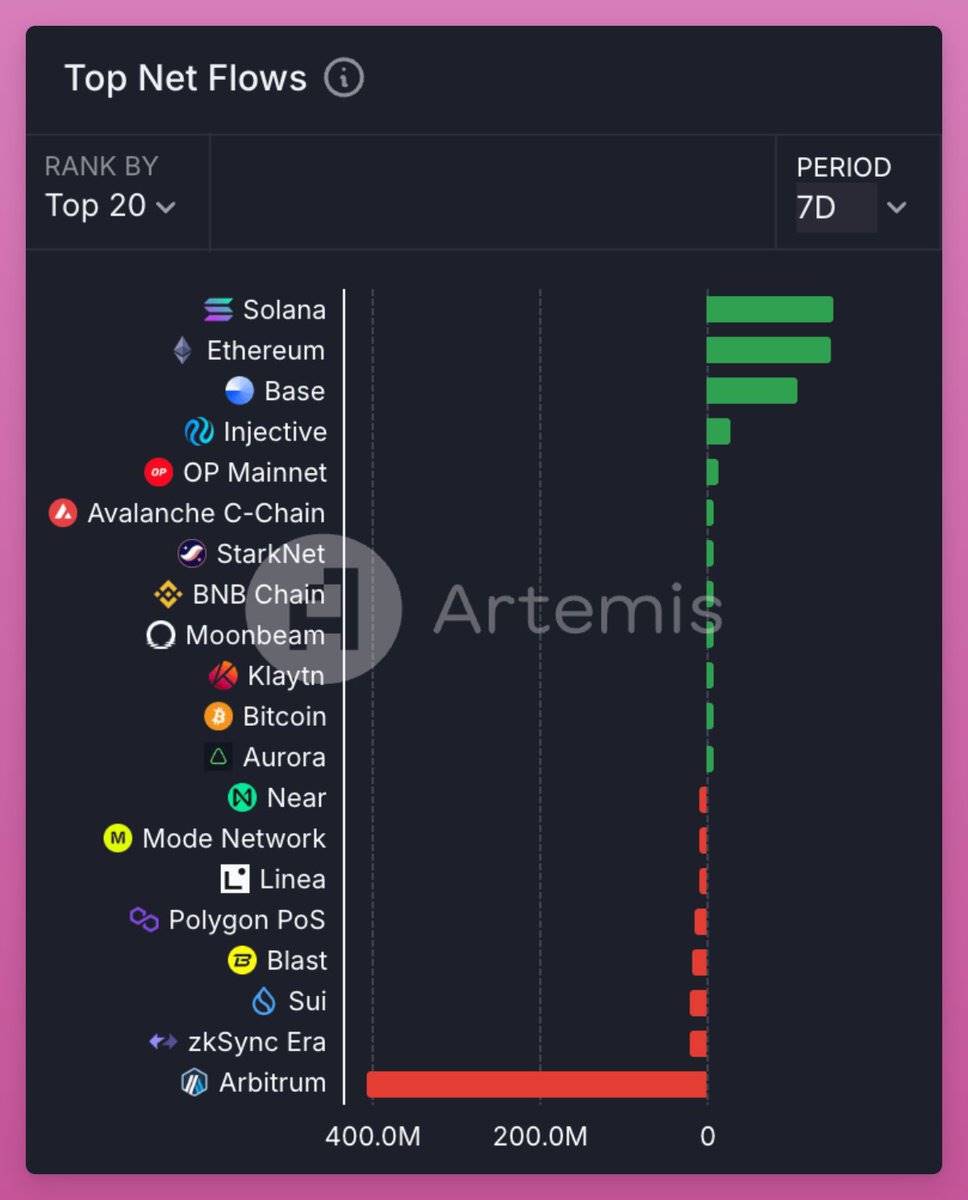
4. Capital Flows from Arbitrum to Solana, ETH, and Base
Data shows Solana recorded a net inflow of $153 million over the week, while Arbitrum lost $405 million.
(Could this be related to Hyperliquid’s cross-chain bridge?)
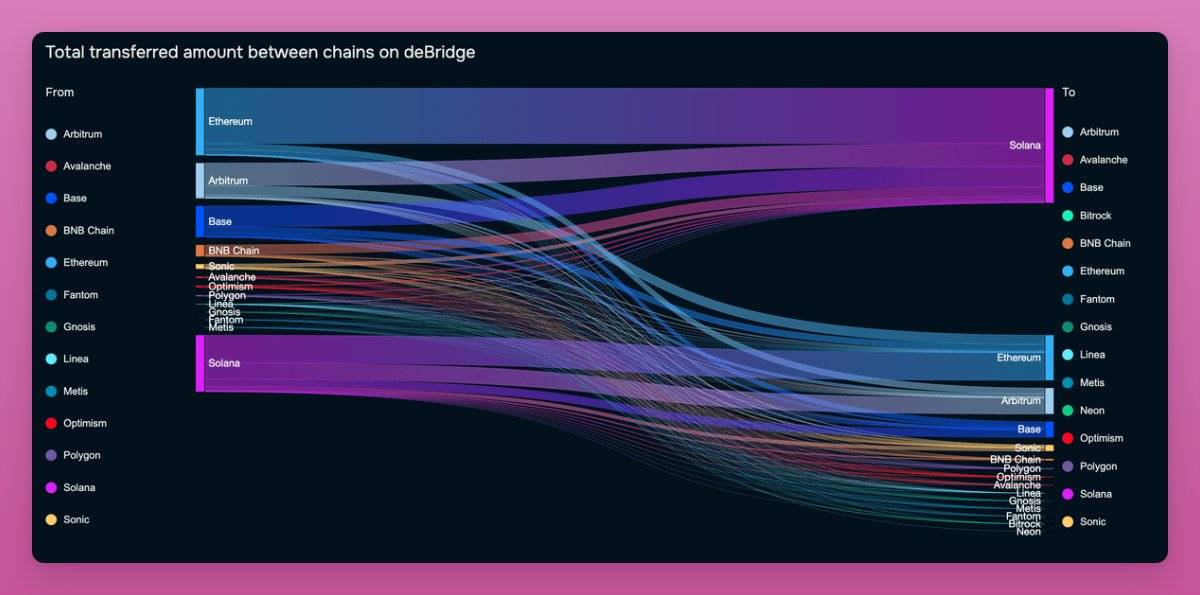
5. Visual Analysis of Capital Flow into Solana
According to data from DeBridge, Solana saw approximately $300 million in capital inflows over the week, primarily from Ethereum, Base, and Arbitrum.
Meanwhile, outflows from Solana totaled about $140 million.
6. Phantom Activity Spikes
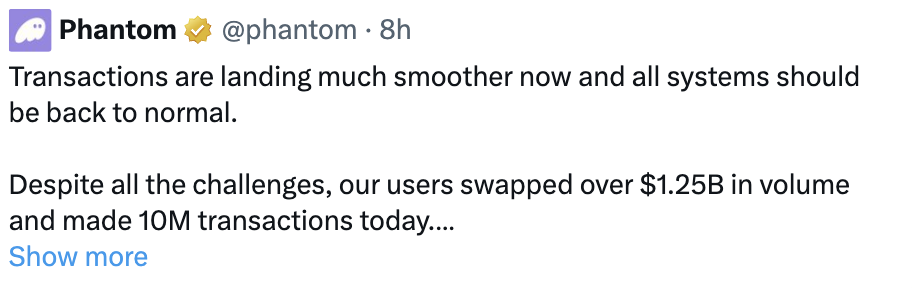
Phantom reported over 8 million requests per minute. The total transaction volume processed through Phantom reached $1.25 billion across 10 million transactions.
With the current fee rate at 0.85%, Phantom earned approximately $10.6 million in fees during this period.
@phantom: "Trading has now resumed smoothly, and all systems are operating normally.
Despite significant challenges, our users today achieved over $1.25 billion in trading volume and completed 10 million transactions—an outstanding performance!"
7. SOL Performs Strongly on $TRUMP Launch Day
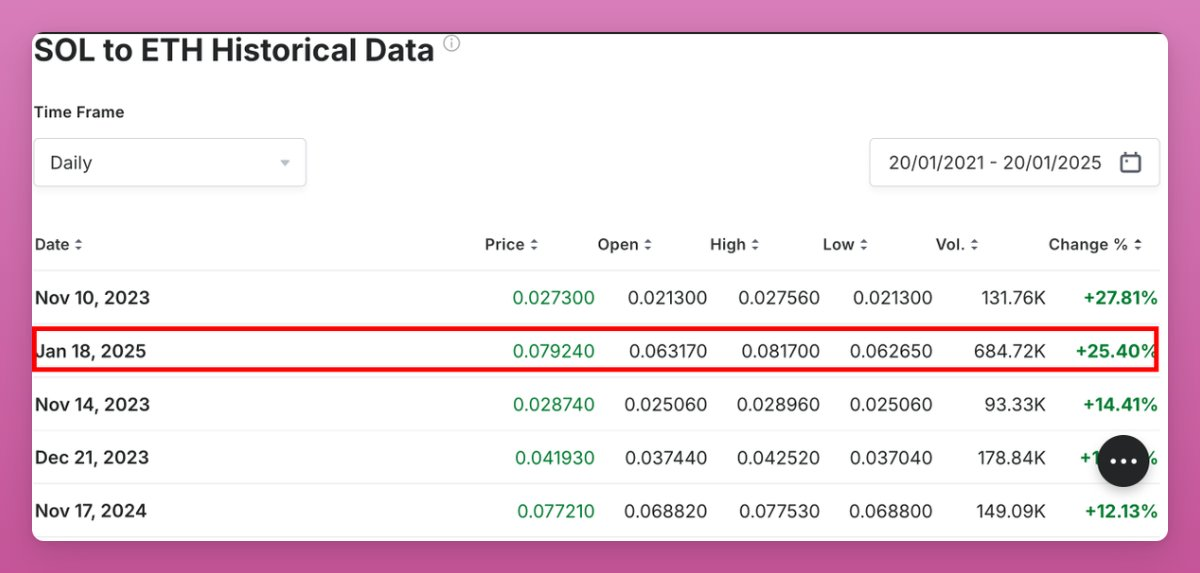
On the day the $TRUMP token launched, SOL’s price against $ETH posted its largest single-day gain since 2021, surging by 25%.
This repricing further dampened sentiment in the Ethereum community and intensified calls for reform within the Ethereum Foundation.
The possibility of SOL overtaking ETH has become a hot topic of discussion.
8. Solana’s Challenge: Soaring Transaction Fees
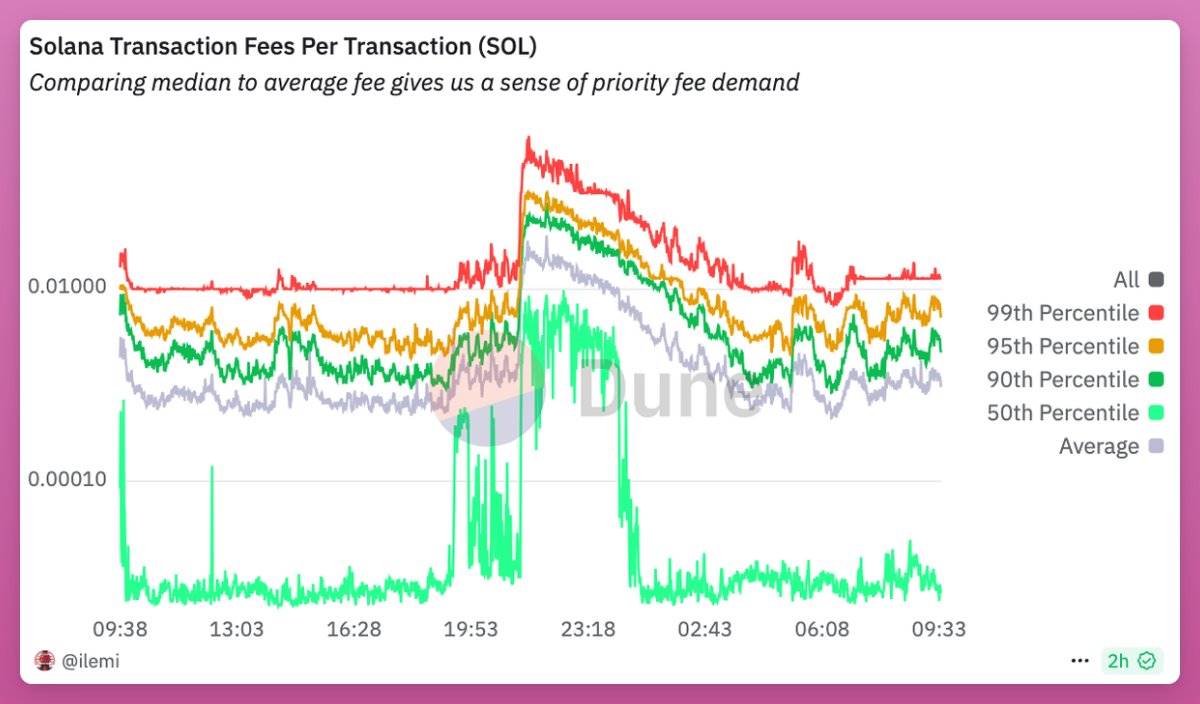
Despite strong performance, Solana’s transaction fees spiked an average of 20x during this period, leaving many users unable to complete transactions.
9. High Fees Benefit SOL Stakers
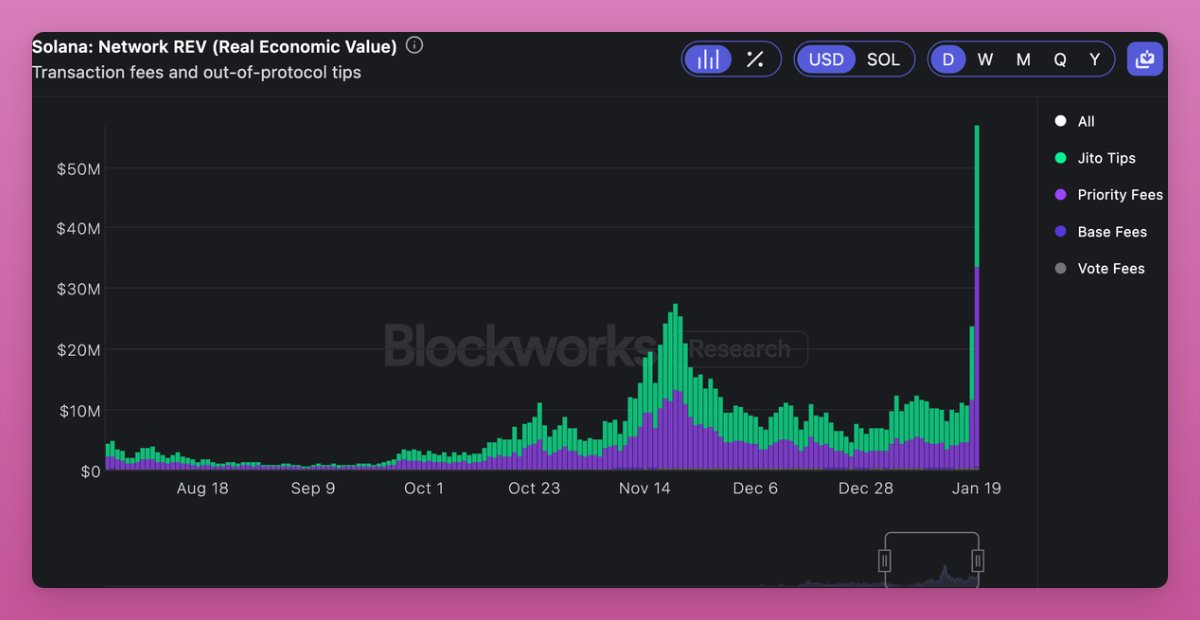
Elevated fees translated into gains for SOL stakers, with total fee revenue reaching $57 million. Of this, priority fees accounted for $33 million and Jito Tips contributed $23.5 million.
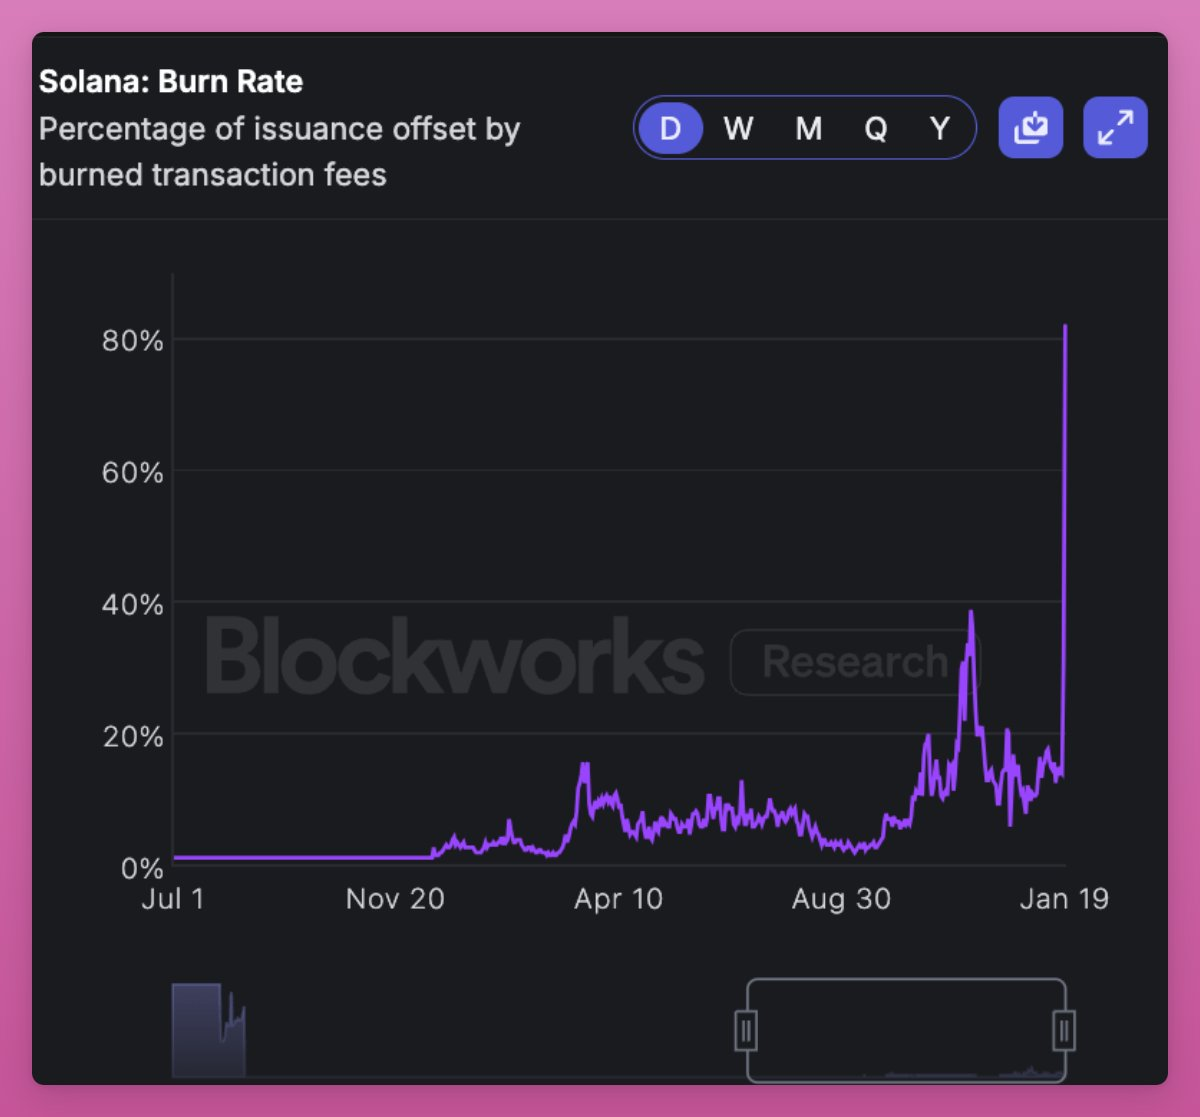
10. Additionally, $SOL Burn Amount Reached a Record $16.7 Million
However, don’t rush to promote the “ultra-sound money” narrative just yet—because even on this record-breaking day, the amount burned represented only 81% of SOL’s daily issuance.
Summary: Solana’s Weekend
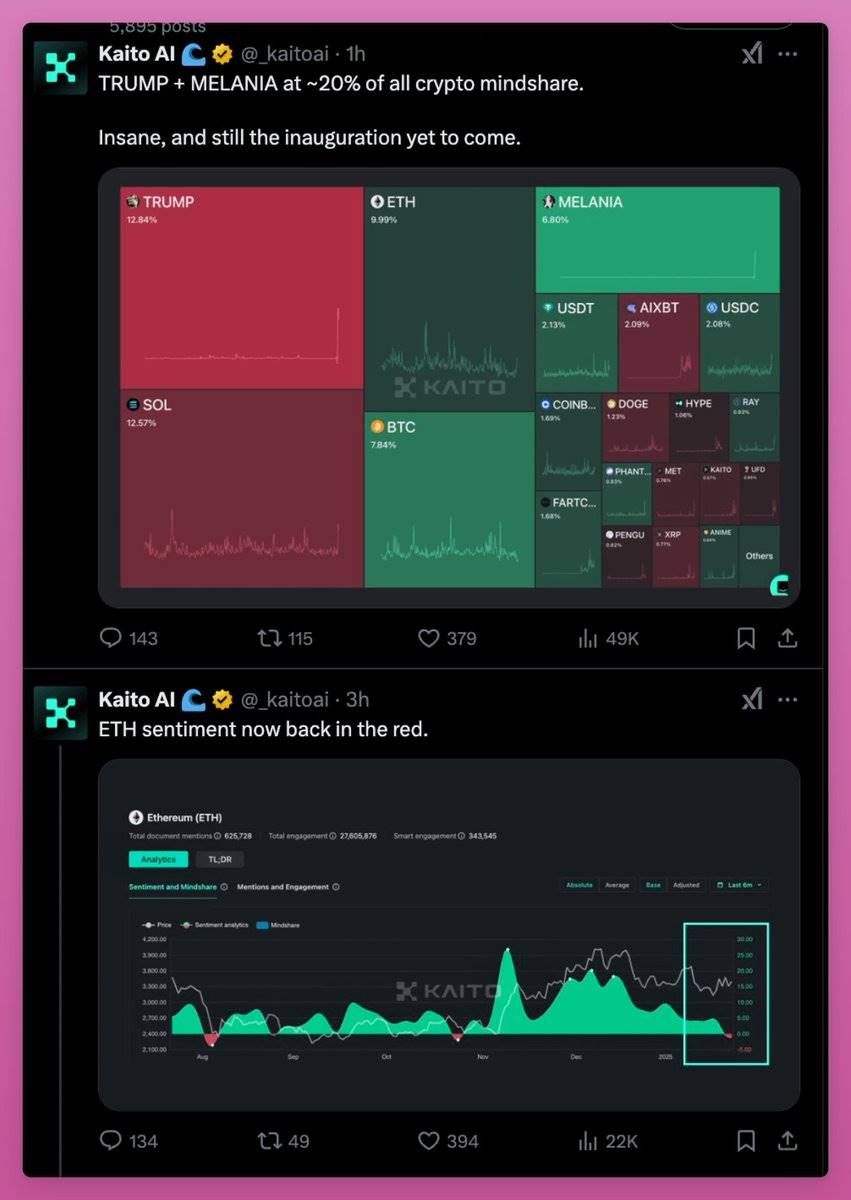
This weekend was unquestionably Solana’s: $TRUMP, MELANIA, and $SOL dominated market attention. Meanwhile, market sentiment around ETH turned negative once again.
Join TechFlow official community to stay tuned
Telegram:https://t.me/TechFlowDaily
X (Twitter):https://x.com/TechFlowPost
X (Twitter) EN:https://x.com/BlockFlow_News
 Ignas | DeFi Research