a16z: 5 Metrics You Need to Watch to Understand the Development of the Crypto Industry
TechFlow Selected TechFlow Selected
a16z: 5 Metrics You Need to Watch to Understand the Development of the Crypto Industry
The crypto industry is well-positioned to attract more users and developers.
 Navigating Web3 tides with focused insights
Written by: Daren Matsuoka, Partner at a16z crypto
Translated by: Luffy, Foresight News
2024 has been an exciting year in the history of the cryptocurrency industry. Crypto activity and usage have reached all-time highs, blockchain infrastructure has significantly improved with lower transaction fees, stablecoins have achieved product-market fit, the convergence between crypto and artificial intelligence has become increasingly clear, Bitcoin and Ethereum ETFs have been approved, and the legislative and regulatory landscape is now paving a positive path forward for the industry. All of this sets the stage for another thrilling year ahead.
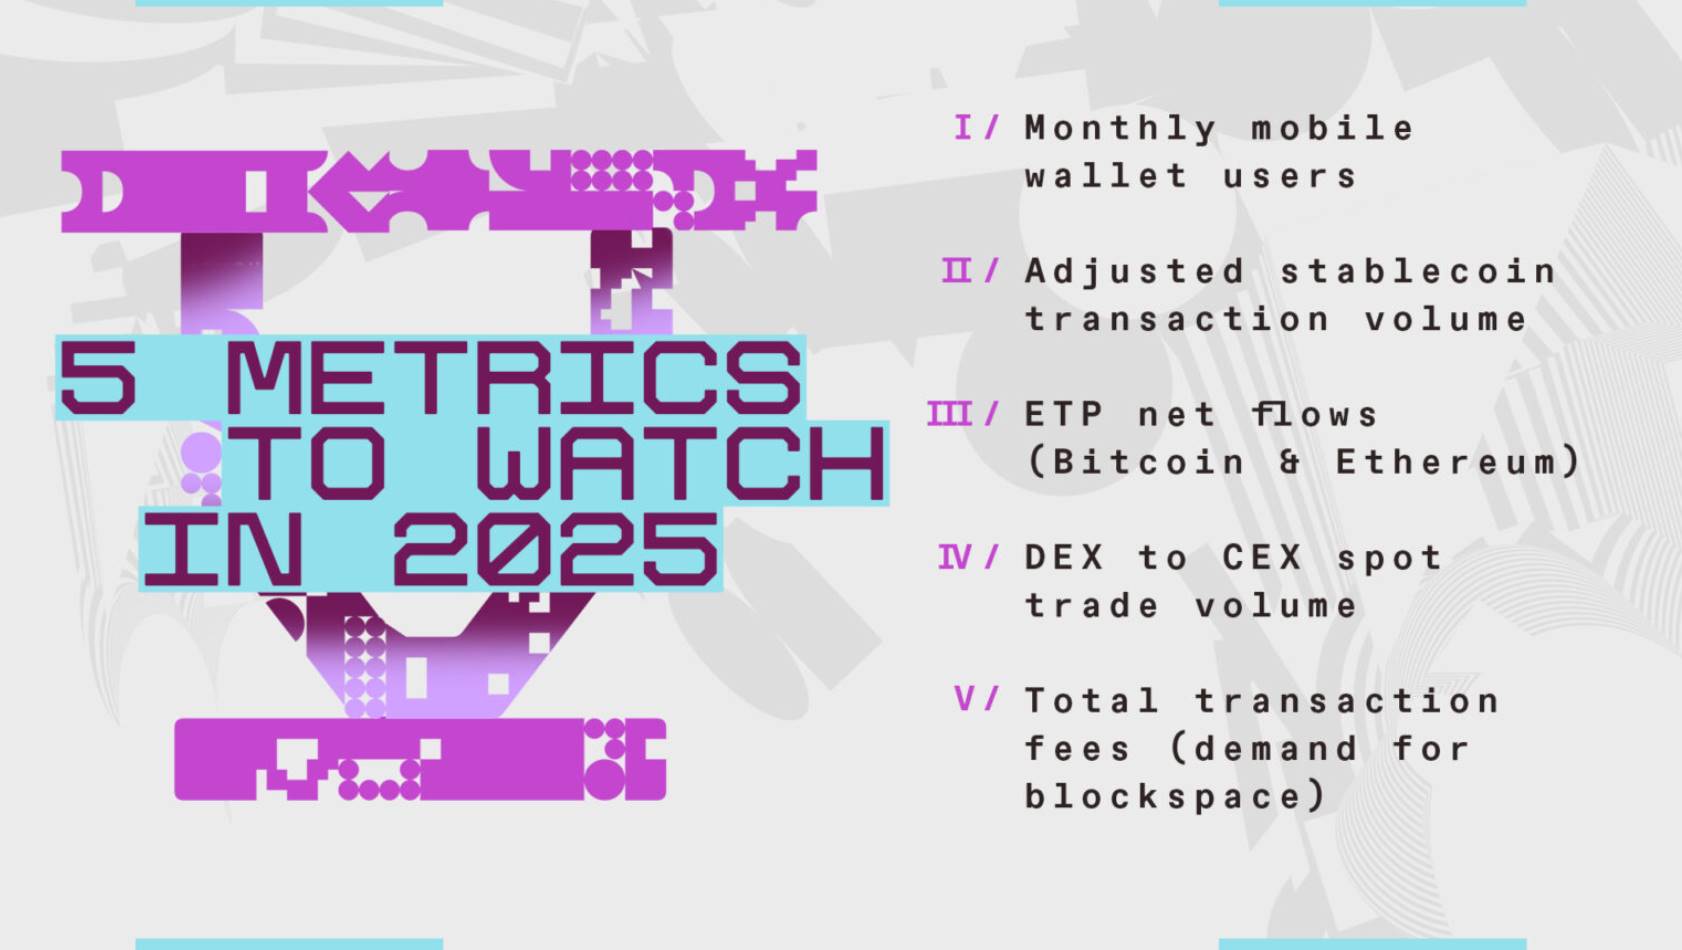
As we think about the next phase of crypto development, here are five key metrics we’ll be closely watching to track the industry’s continued progress.
Monthly Mobile Wallet Users
To unlock the next wave of crypto user growth, we need experiences that feel more like Web2 applications. Mobile wallets will play a crucial role: hundreds of millions of "passive" crypto holders—people who own crypto but don’t frequently transact on-chain—could become active users. To make this happen, developers need to keep building new consumer applications, and consumers need wallets to participate.
Last month, mobile wallet users hit a record high, surpassing 35 million for the first time. This growth was driven by increased adoption across well-known wallets like Coinbase Wallet, MetaMask, and Trust Wallet, as well as newer entrants such as Phantom and World App.
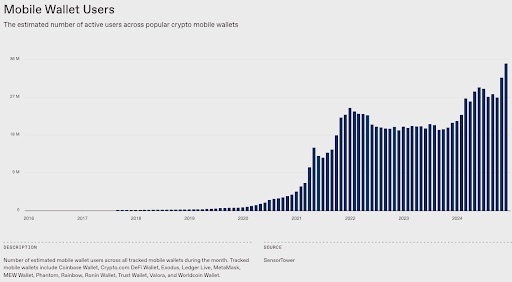
For developers, consumer wallets present some of the industry’s toughest challenges—striking the right balance between security, privacy, and ease of use is no small feat. But with blockchain infrastructure now capable of supporting hundreds of millions, even billions, of on-chain users, the time is ripe to build the next generation of mobile wallets. In 2025, we’ll be closely tracking these developments.
You can track monthly mobile wallet users here.
Adjusted Stablecoin Transaction Volume
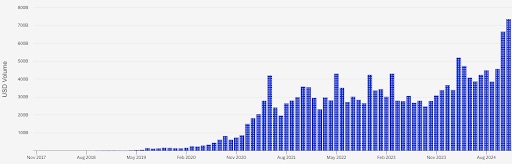
With infrastructure improvements dramatically reducing transaction costs, stablecoin activity increased in 2024. Notably, stablecoins are used not only for crypto trading but also for cross-border payments and remittances, purchasing goods and services, and as a store of value in countries suffering from high inflation. Stablecoins are already the lowest-cost way to send dollar-denominated payments, and we expect more businesses to begin accepting them.
Driven by these favorable trends, blockchain-based value settlement should continue growing in 2025. While we can easily measure this volume using on-chain data, isolating genuine stablecoin usage remains challenging. Transactions can be initiated manually by end users or automatically by bots, and some on-chain activity doesn't resemble traditional settlement patterns.
Luckily, Visa has developed a clear and simple methodology that reveals actual stablecoin usage while filtering out non-organic activity caused by bots and other forms of artificial inflation.
If stablecoin adoption—one of crypto’s clearest use cases—takes off in 2025, this metric will be one to watch.
You can track stablecoin transaction volume here.
ETF Net Flows
Last year, the U.S. SEC approved Bitcoin and Ethereum ETFs—an important milestone that made crypto more accessible to both retail and institutional investors. However, it will take time for distributors—such as Goldman Sachs, JPMorgan, and Merrill Lynch—to integrate these products into mainstream investment portfolios.
One way to measure ETF activity is “net flows,” representing the net amount of Bitcoin or Ethereum flowing into or out of ETFs (excluding pre-existing products like Grayscale’s Bitcoin and Ethereum Trusts that were later converted into ETFs). So far, Bitcoin ETFs have seen net inflows of 515,000 BTC, while Ethereum ETFs have recorded 611,000 ETH in net inflows.
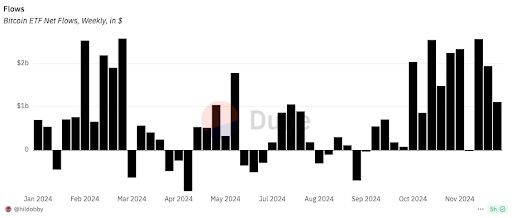
As more institutional investors seek exposure to crypto assets, ETF net flows should increase. By monitoring on-chain deposits and withdrawals from addresses confirmed as ETF custodians, we can track this data in real time.
You can track ETF net flows here and here.
Dex vs. Cex Spot Trading Volume
As users enter the blockchain ecosystem, we expect decentralized exchanges (DEXs) to gain share relative to centralized exchanges (CEXs) in crypto trading. After all, decentralization is core to crypto’s original promise of decentralized finance (DeFi). Over recent years, DEXs’ share of spot trading volume has steadily grown to around 11%, and we expect this trend to continue into 2025.
Recently, rising volumes on high-throughput chains like Coinbase’s Base and Solana—driven by new users entering the space—have pushed DEX trading volume to all-time highs.
As more consumer-facing applications launch, DEX trading volume could grow further.
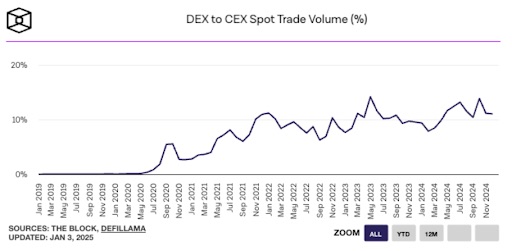
This will be a key metric as we monitor the shifting balance between decentralized, crypto-native activity and centralized crypto trading.
You can track DEX vs. CEX spot trading volume here.
Total Blockchain Transaction Fees
Total transaction fees (in USD) reflect the aggregate demand for block space on a given blockchain—that is, real economic value being transacted.
However, this metric has nuances, as most projects are actively working to reduce fees for users. That’s why it’s also important to consider per-unit transaction cost—the price of a specific quantity of blockchain resources. Ideally, total demand (total fees) grows while gas prices (per-unit resource cost) remain low.
In November 2024, Solana’s fees surpassed Ethereum’s for the first time in history (see chart below). Notably, this milestone occurred despite Solana’s per-transaction costs being far lower—sending a dollar-pegged stablecoin (USDC) costs about $5 in fees on Ethereum, versus less than one cent on Solana. This is a significant development we’ll continue to monitor.
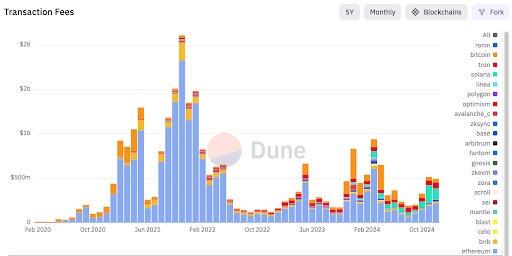
Many ecosystems and their associated fee markets are maturing, making this an ideal time to start measuring the economic value facilitated across various blockchains. In the long run, demand for block space—as measured by total dollar value of fees paid—may be the single most important metric for tracking progress in the crypto industry. Why? Because it reflects participation in valuable economic activity and users’ willingness to pay for it.
You can track demand for block space via transaction fees here.
Summary
We track many metrics across the crypto industry, but this year we’ll be focusing on these five. With expanded investor access, mature infrastructure enabling new applications, and breakout products like stablecoins gaining traction, the industry is well-positioned to attract more users and developers. Let’s see what new innovations emerge this year—and ultimately drive changes in these key indicators.
Join TechFlow official community to stay tuned
Telegram:https://t.me/TechFlowDaily
X (Twitter):https://x.com/TechFlowPost
X (Twitter) EN:https://x.com/BlockFlow_News
 a16z
a16z