








Mastering Binance Alpha: Short-Term Speculation or Long-Term Value Investing?
TechFlow Selected TechFlow Selected
Mastering Binance Alpha: Short-Term Speculation or Long-Term Value Investing?
Listing on Binance Alpha is a long-term positive for the token; it's advisable to research quality projects and look for opportunities to buy the dip, waiting for long-term appreciation.
 Navigating Web3 tides with focused insights
Author: Nan Zhi, Odaily Planet Daily
Since launching Binance Alpha on December 18, Binance has listed a total of 38 tokens. The first batch saw relatively modest gains, largely because most were high-market-cap tokens; in contrast, WHALES from the fifth batch surged significantly due to its extremely low market cap. So how should one invest?
In this article, we use detailed data to answer several key questions:
-
What is the short-term listing effect?
-
What is the medium- to long-term listing effect?
-
Do different blockchains exhibit distinct price patterns?
-
Is there a correlation between listing performance and market capitalization?
Data Overview
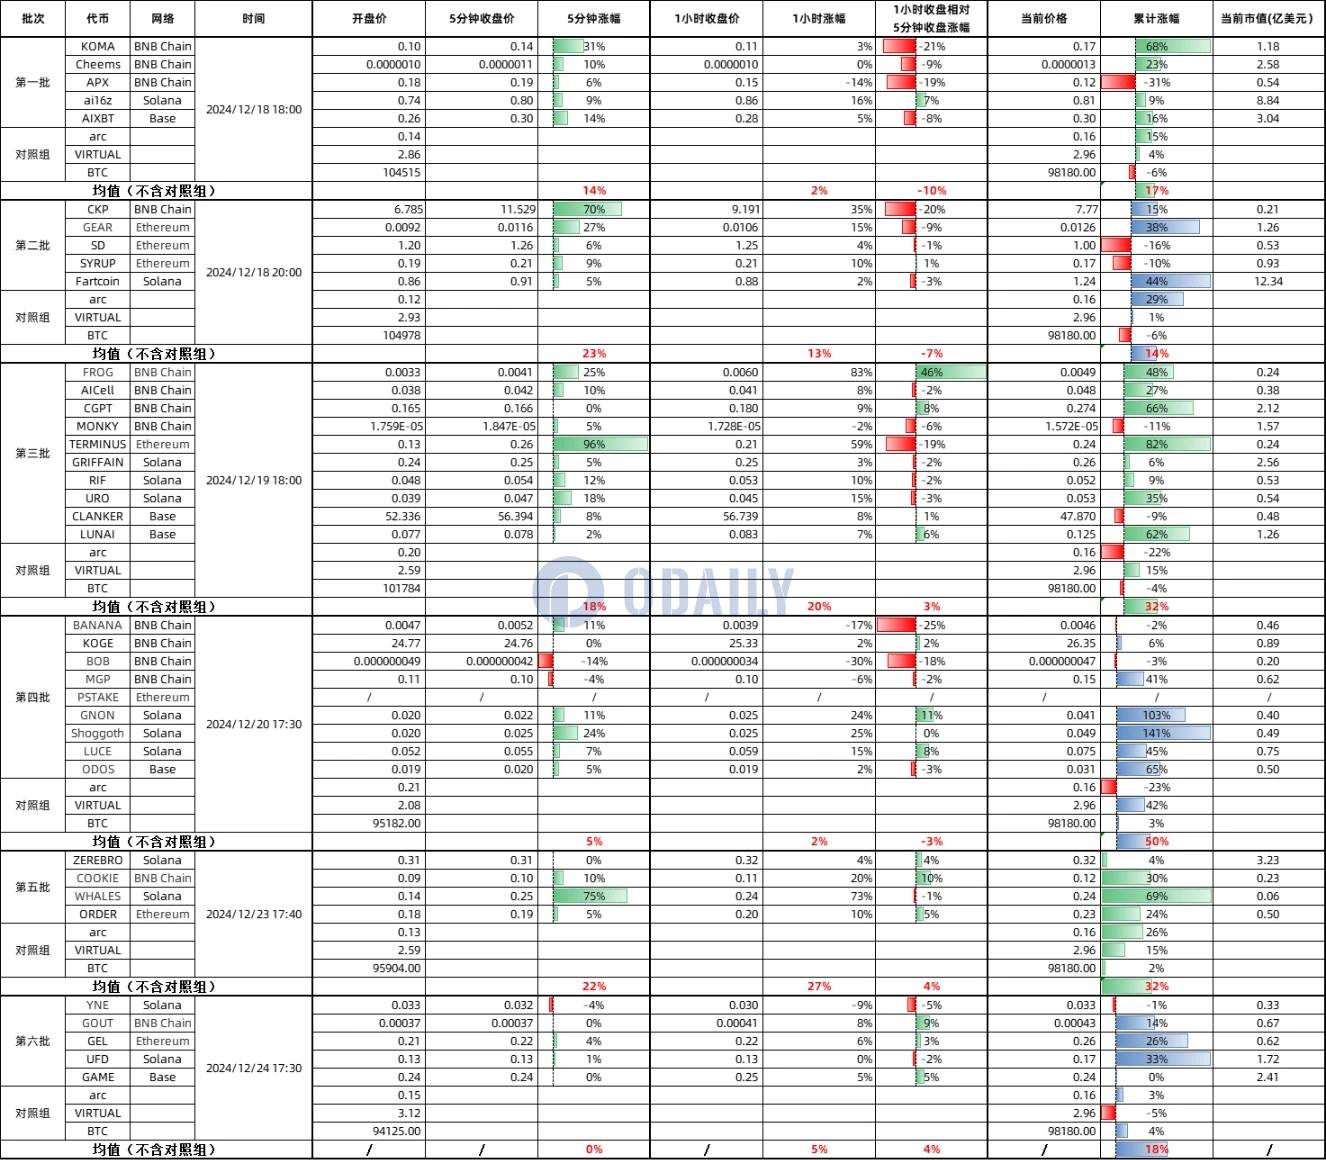
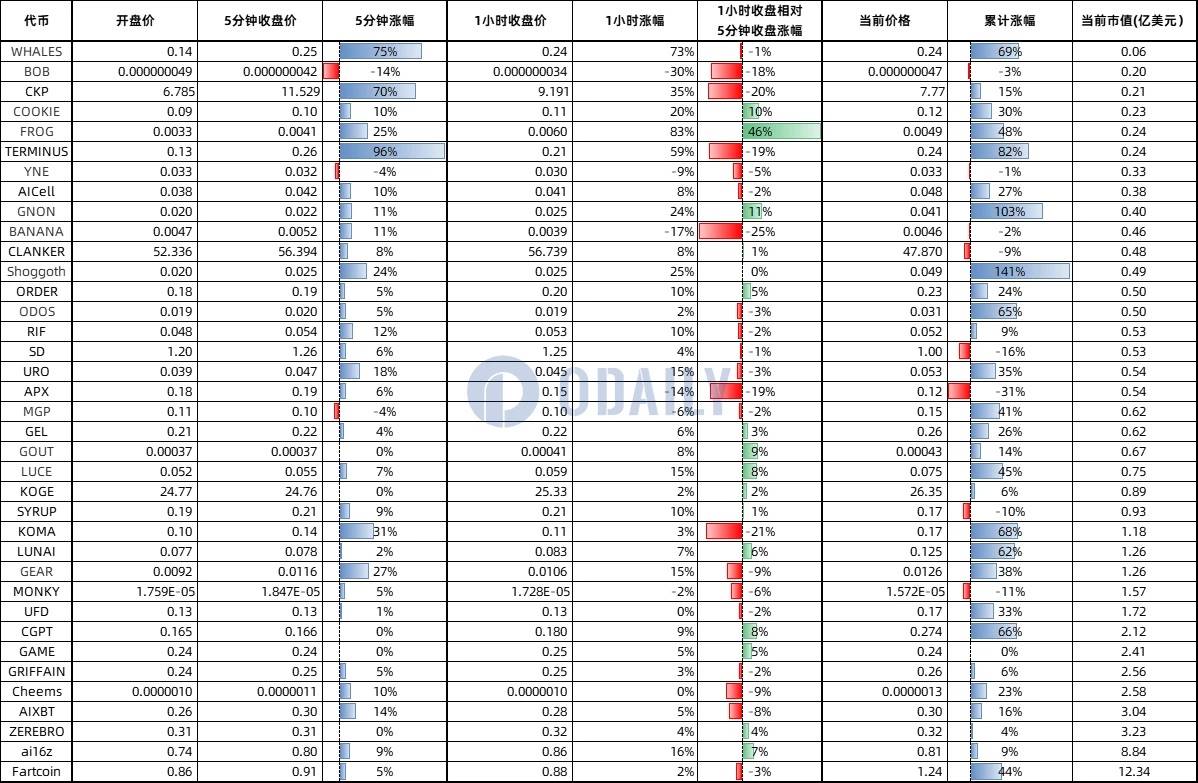
The table below shows the 5-minute, 1-hour, and cumulative price changes since listing for all 38 tokens across six rounds of Binance Alpha. All price data comes from TradingView's 5-minute candlestick charts; market caps refer to circulating market caps from CoinGecko.
To objectively assess whether cumulative returns outperformed the broader market, this article selects three reference tokens: arc on Solana, VIRTUAL on Base, and BTC. (Odaily note: PSTAKE was excluded due to lack of a sufficiently liquid trading pair, resulting in extreme price volatility.)
What Is the Short-Term Listing Effect?
From the table, we can see that the average 5-minute price change across Rounds 1 to 6 was positive in every case—14%, 23%, 18%, 5%, 22%, and 0% respectively—indicating a clear short-term listing effect for Binance Alpha, though significantly weaker than main Binance listings. For comparison, Moonshot’s average 5-minute listing gain is around 30%, making it somewhat comparable. (Recommended reading: CHILLGUY Up 12x in a Day, But Most People Can't Capture Moonshot's Gains, Becoming a Meme Trendsetter, Does Moonshot Really Have a Listing Effect?.)
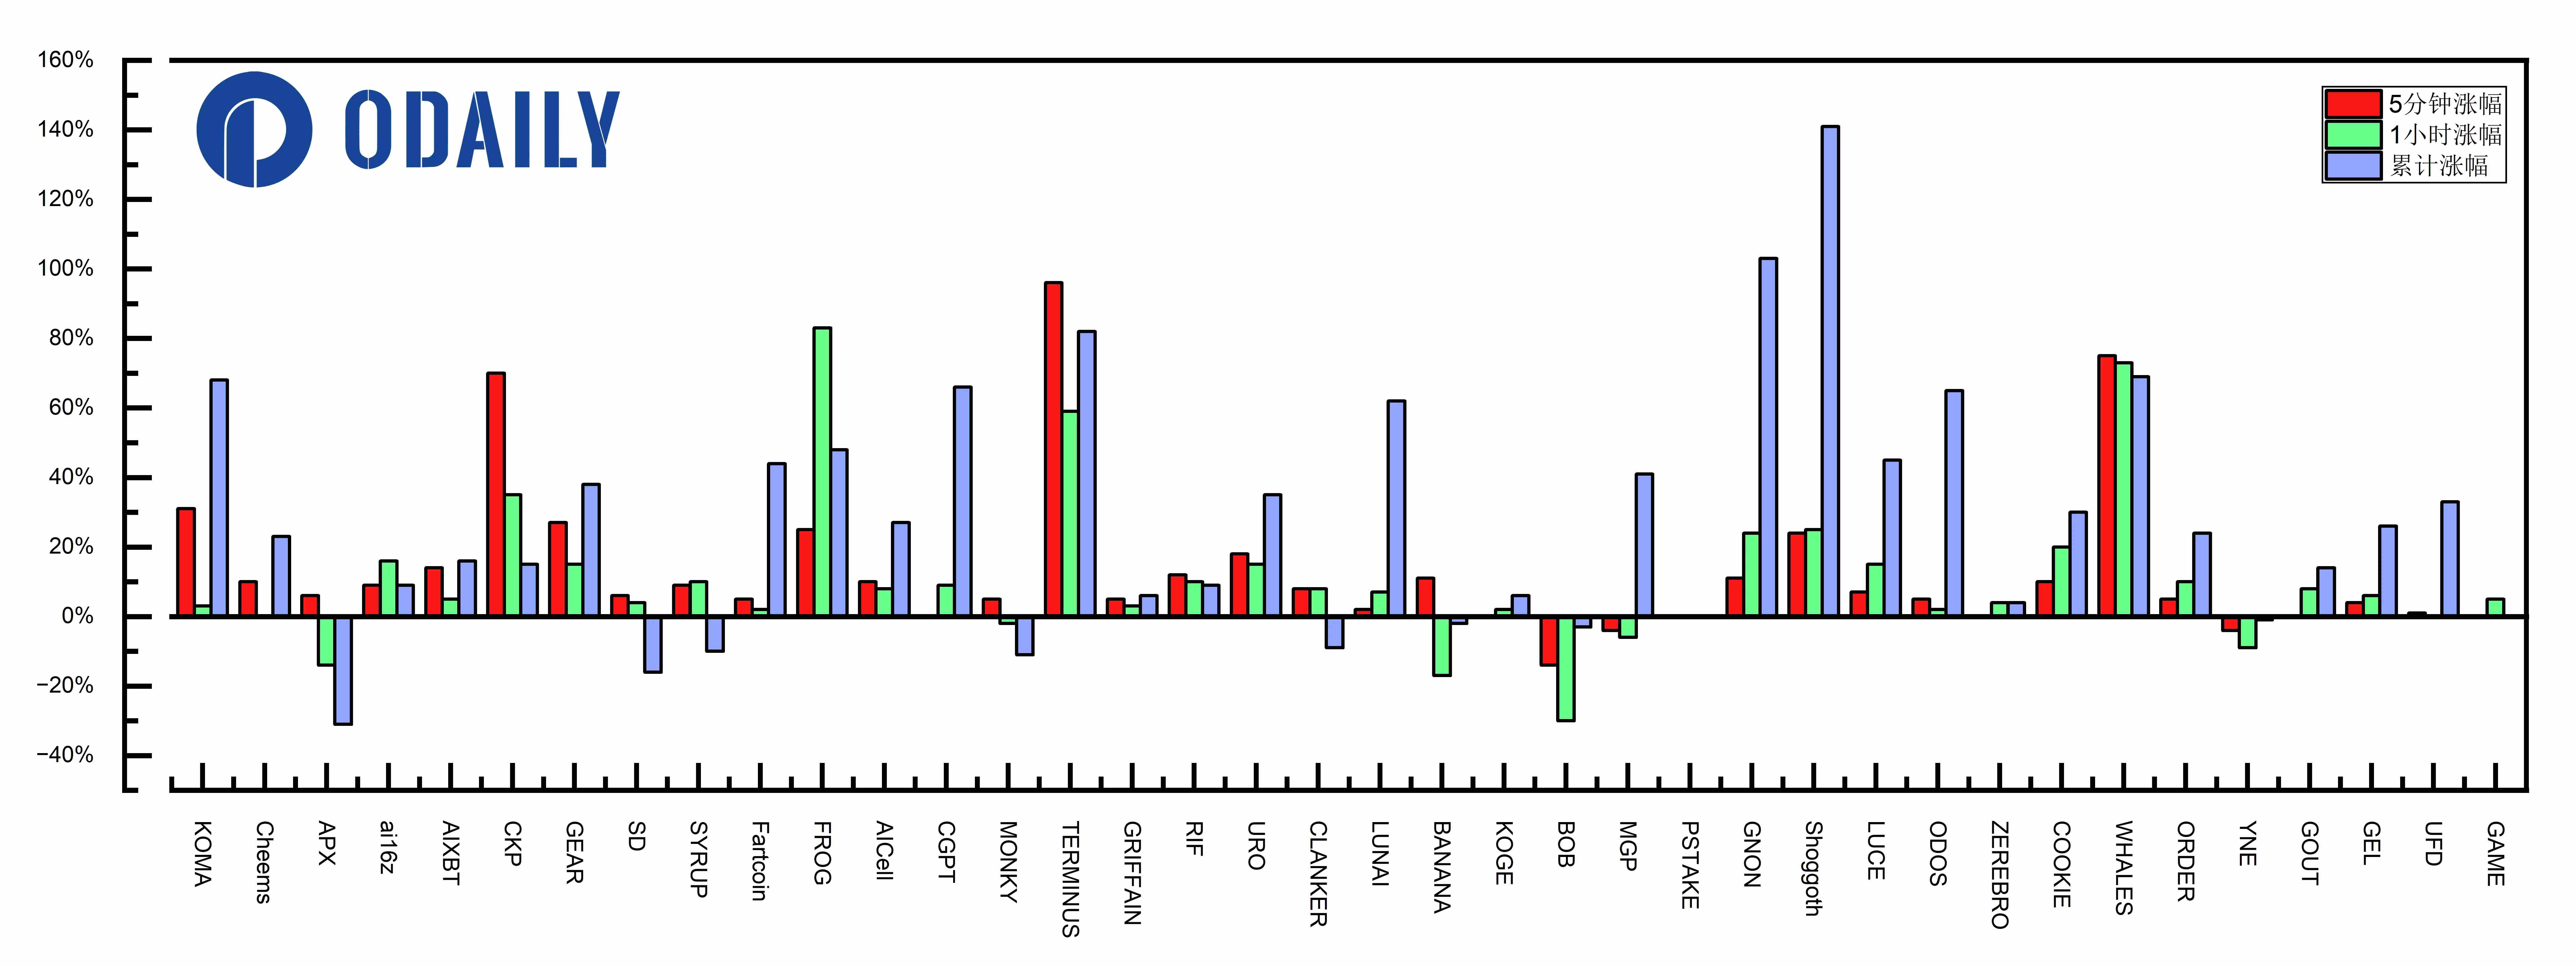
However, further analysis reveals that short-term gains are primarily driven by one or two standout tokens, with most seeing negligible increases.
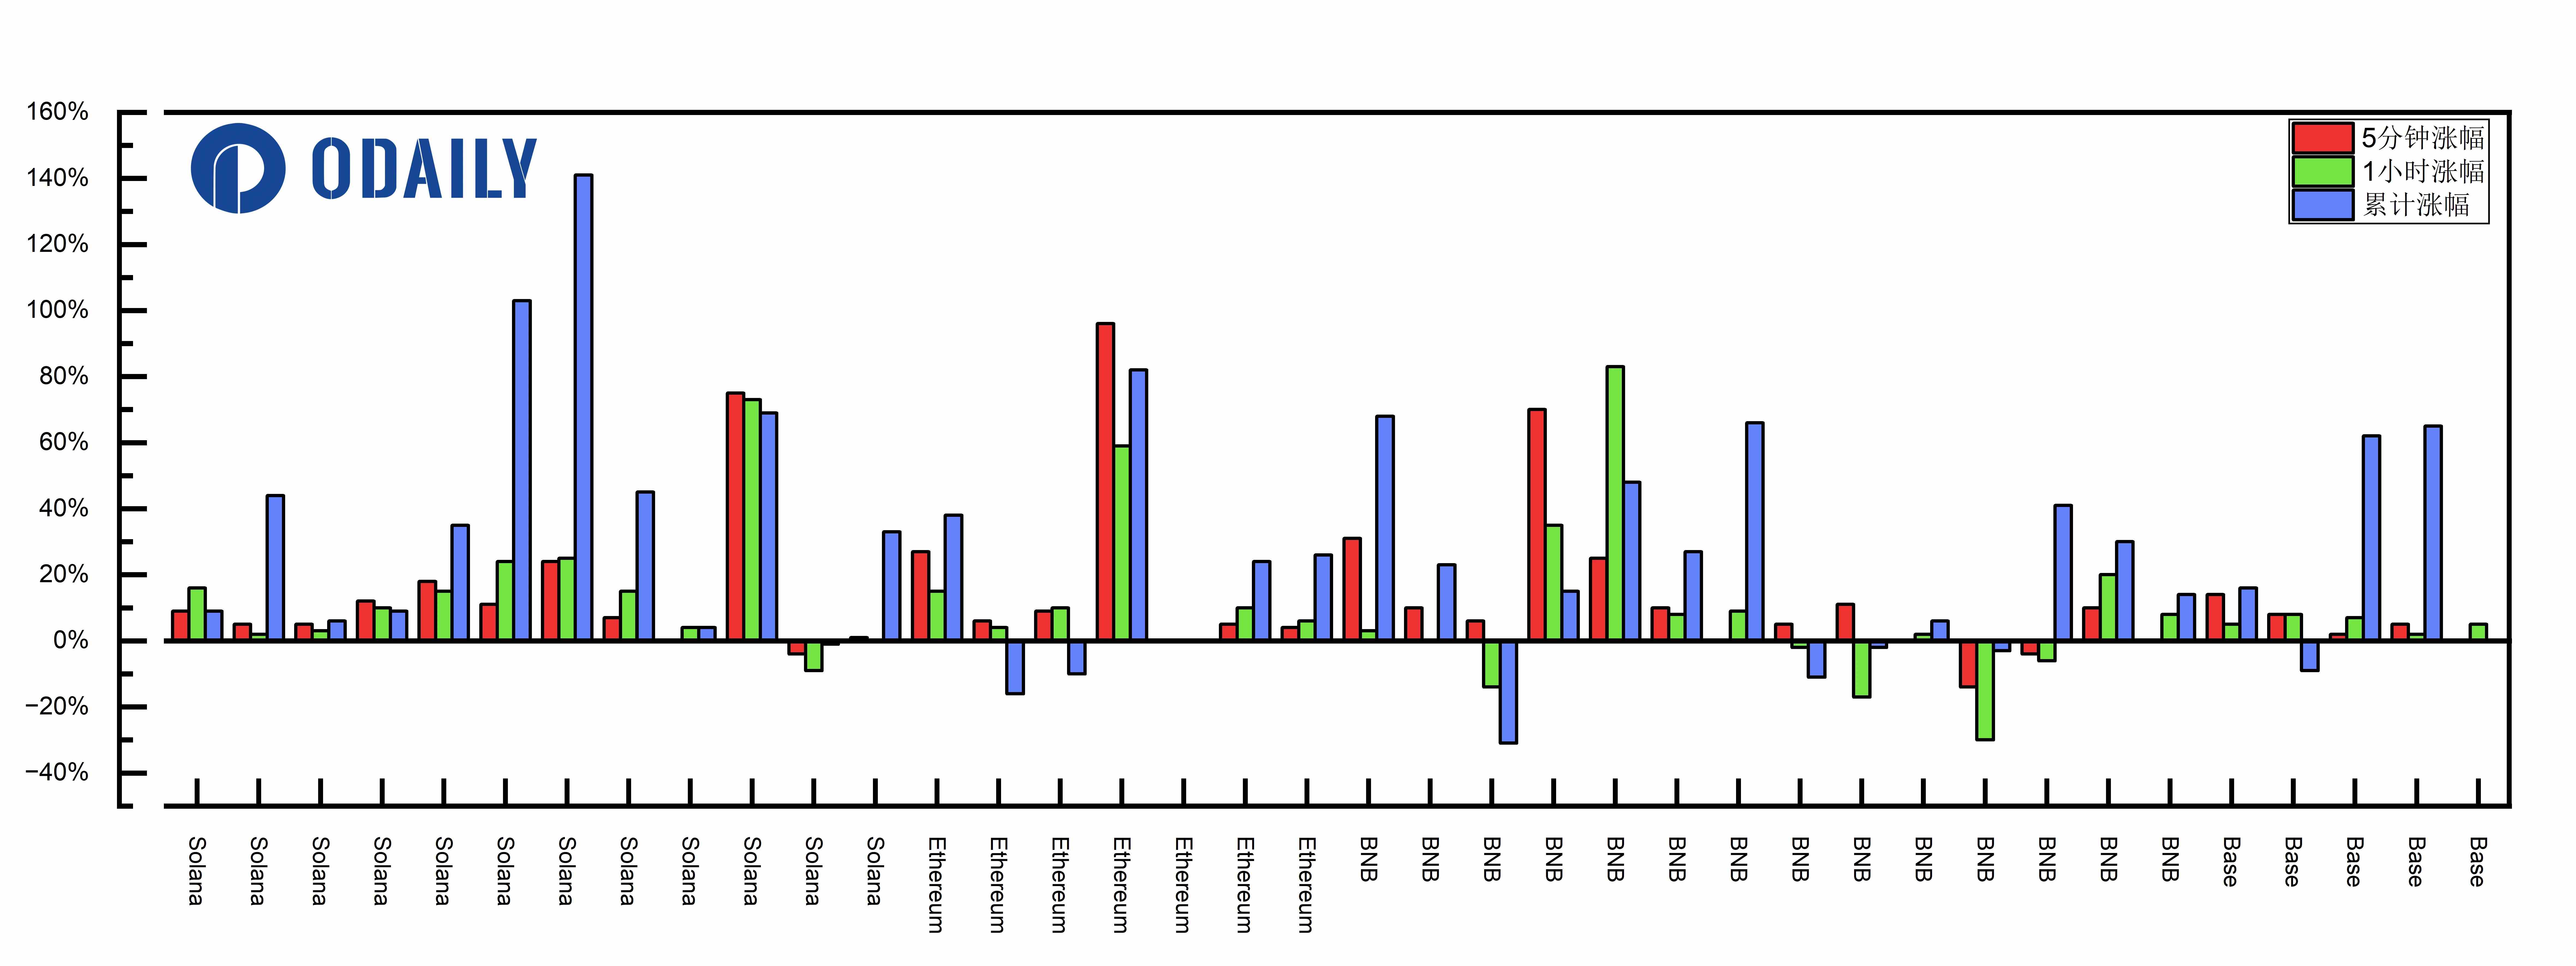
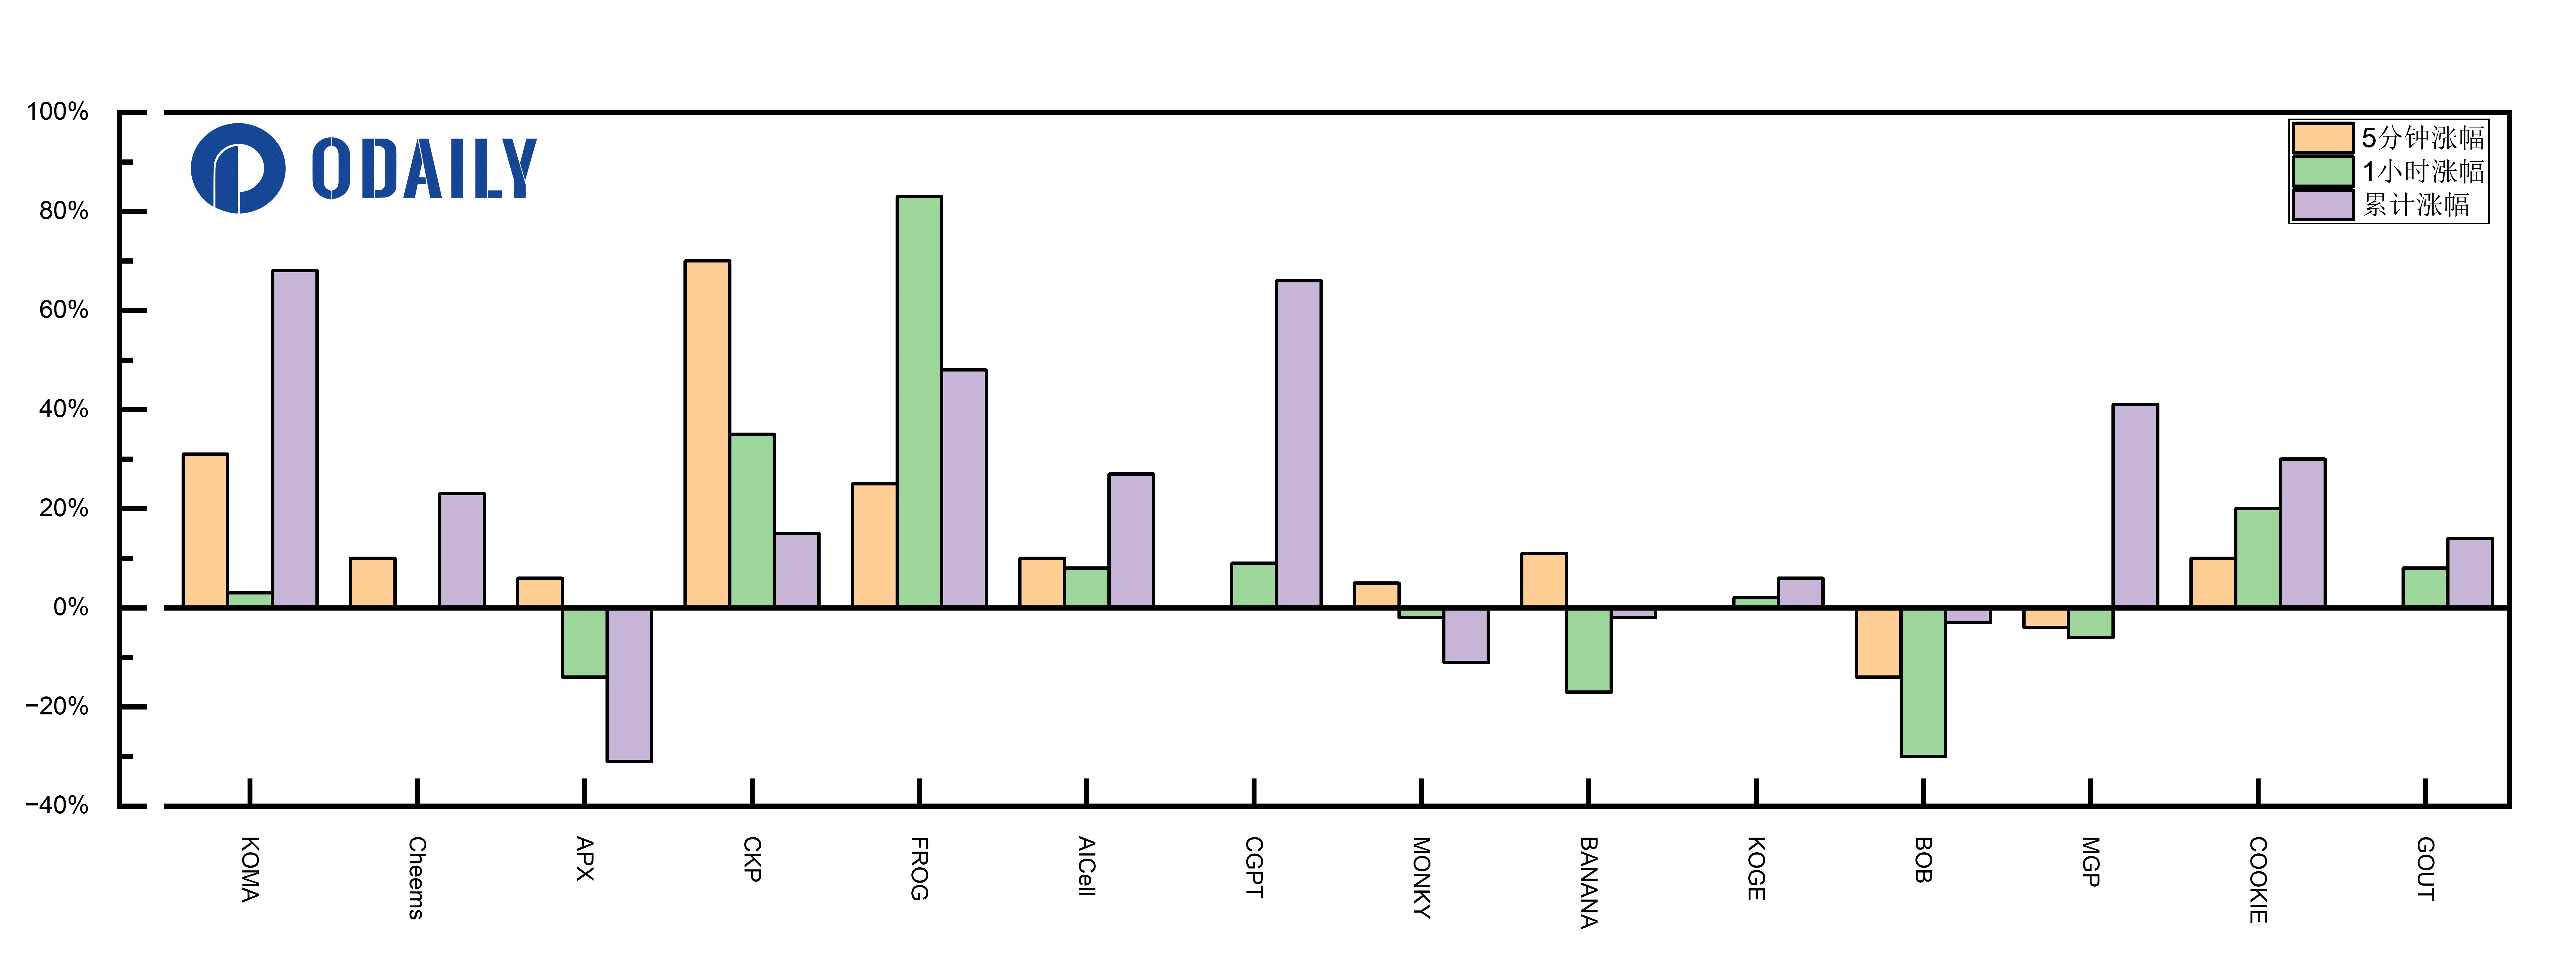
The chart below shows price changes over three timeframes, clearly indicating that only a few bars (5-minute gains) stand out in red, while most remain small.
What Is the Medium- to Long-Term Listing Effect?
Using the 1-hour closing price as a benchmark, most tokens maintain positive gains one hour after listing (green bars above the zero line).
For users who may not buy immediately, comparing the 1-hour close to the 5-minute close (green bar below red bar indicates relative decline), the relative performance across the six rounds is -10%, -7%, +3%, -3%, +4%, and +4%. This means delayed entry could result in short-term losses.
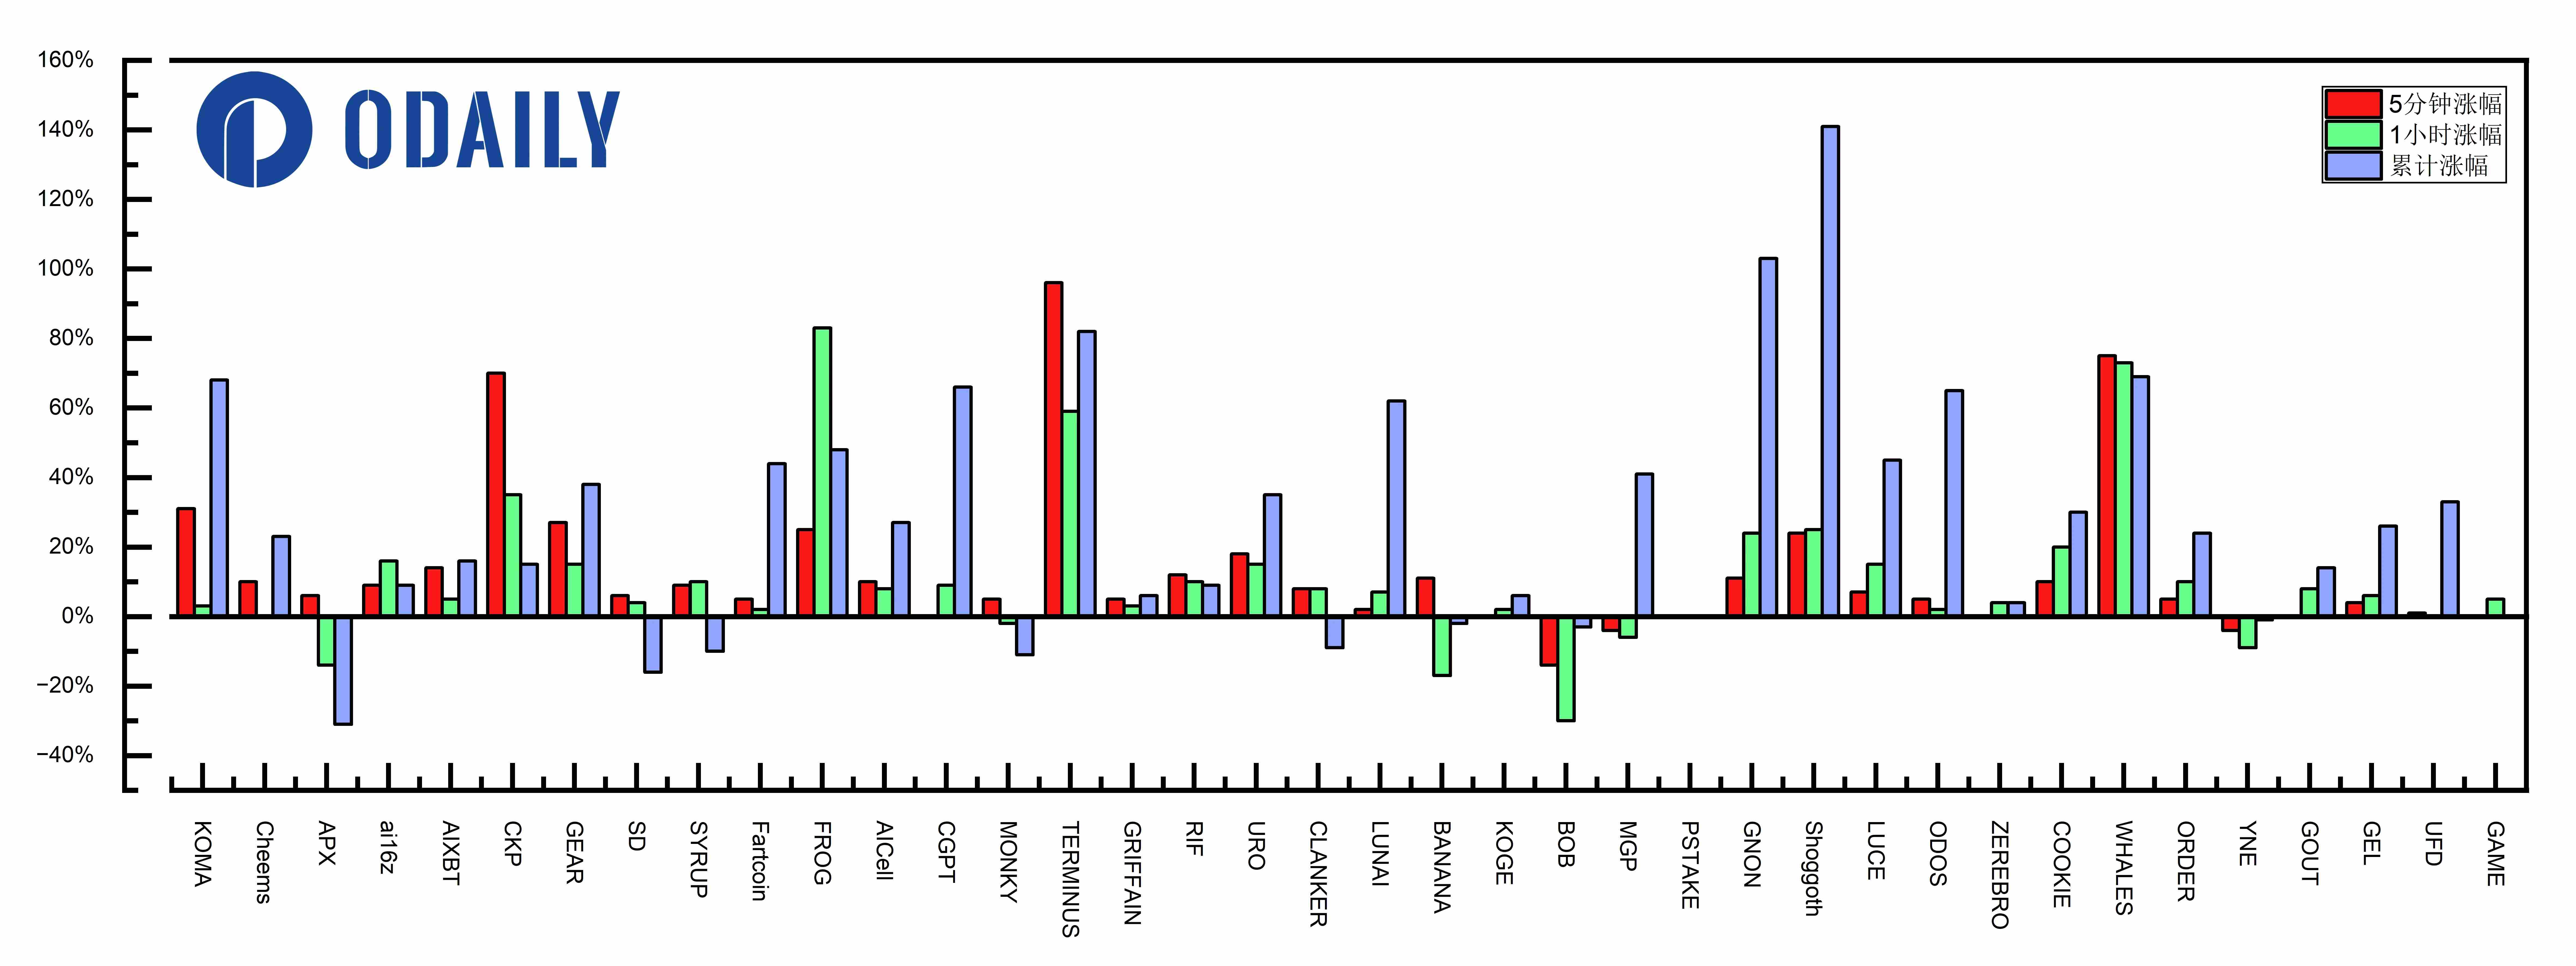
How do they perform long-term? The blue bars clearly show that long-term gains after listing on Binance Alpha are significantly stronger than short-term spikes. For most investors, a better strategy may be to research quality projects post-listing, wait for pullbacks, and then position for long-term growth.
Are these long-term gains simply due to a rising crypto market, or are they influenced by the Binance Alpha listing itself? By comparing against our control group—arc, VIRTUAL, and BTC—we observe that the first three batches launched during a market downturn, yet still delivered positive returns. Overall, being listed on Binance Alpha appears to be a genuine long-term positive catalyst for tokens.
Do Different Blockchains Exhibit Distinct Price Patterns?
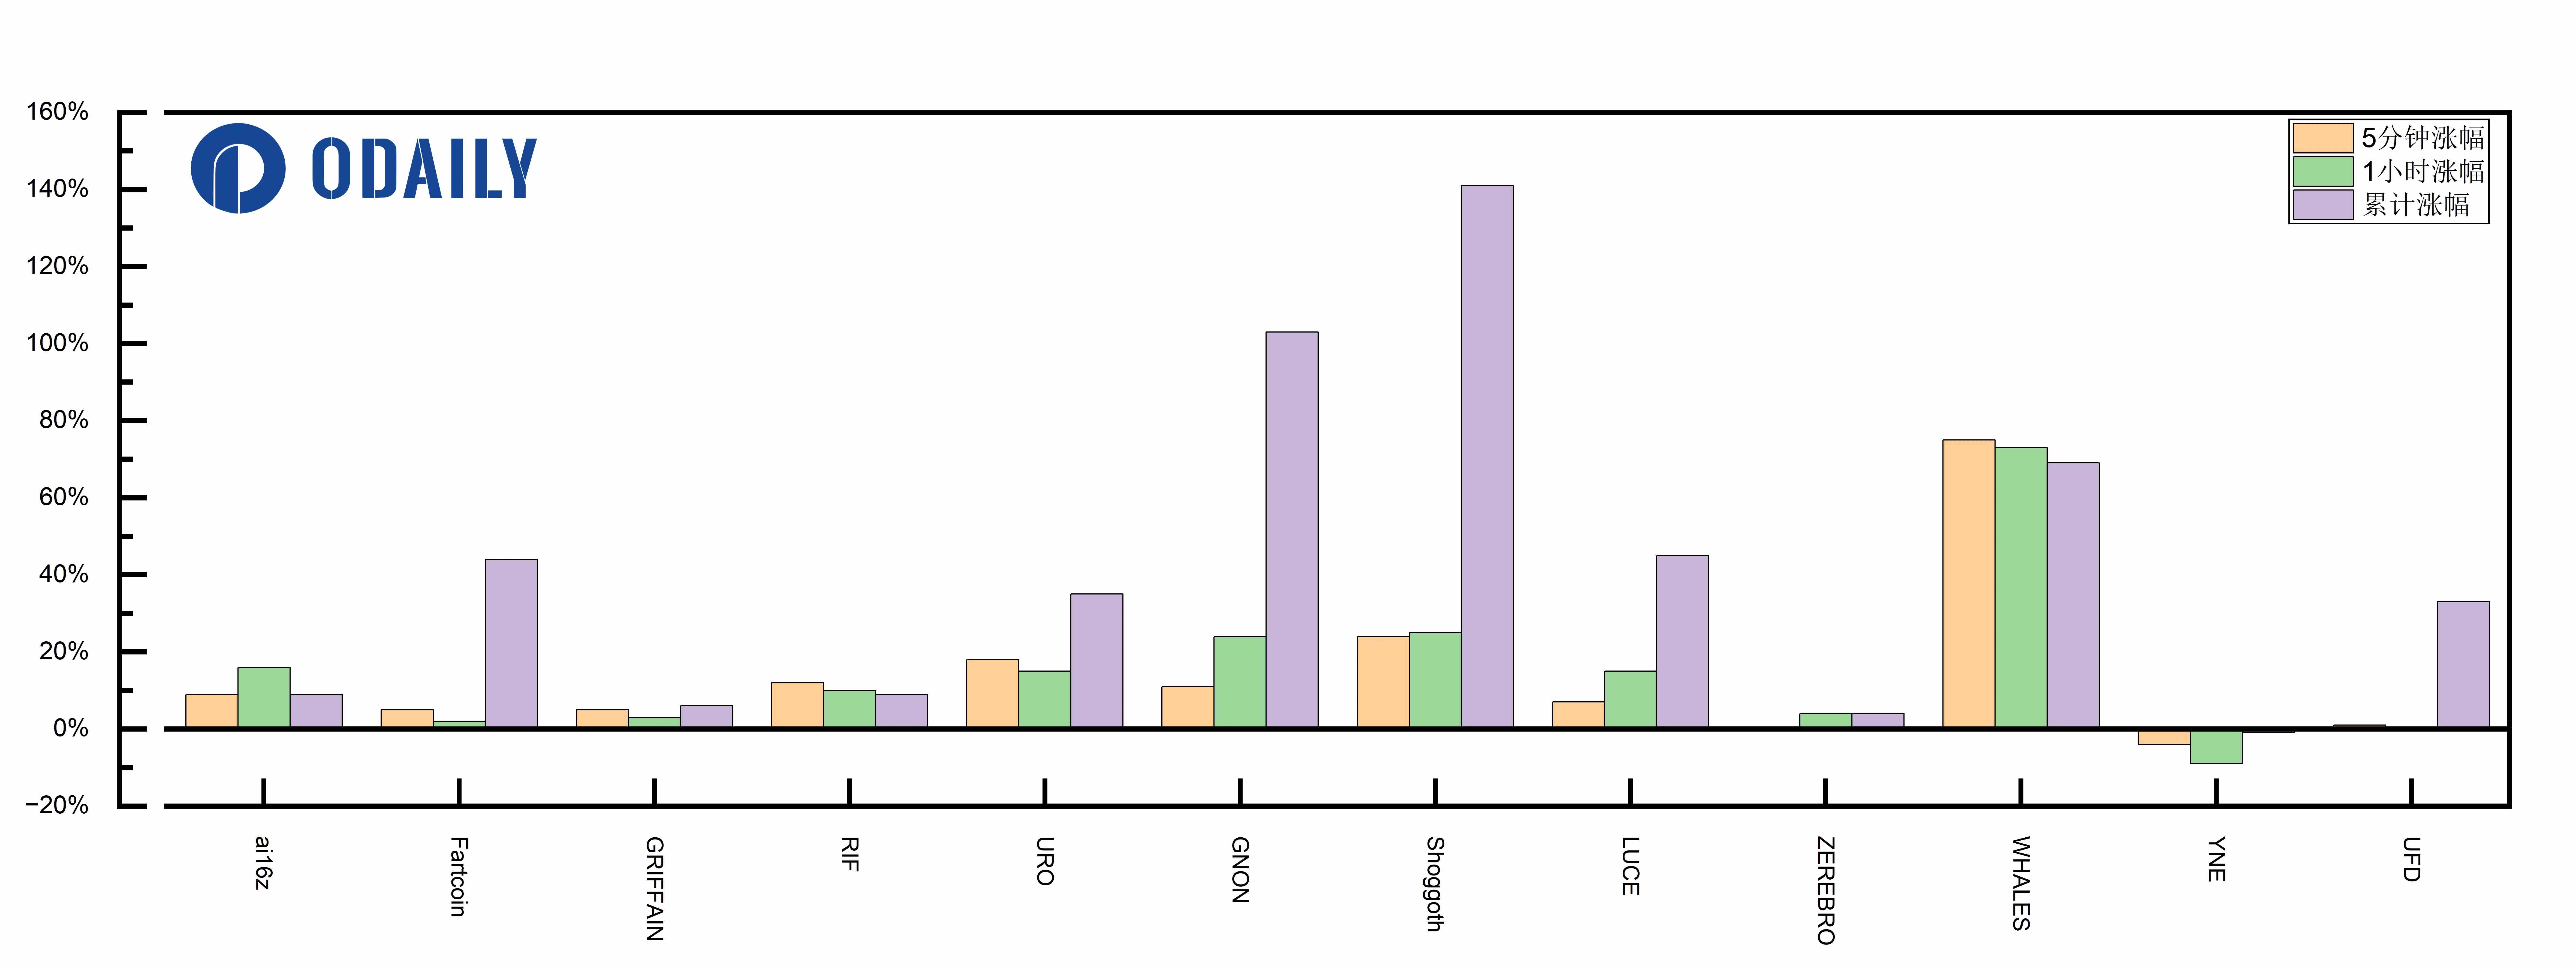
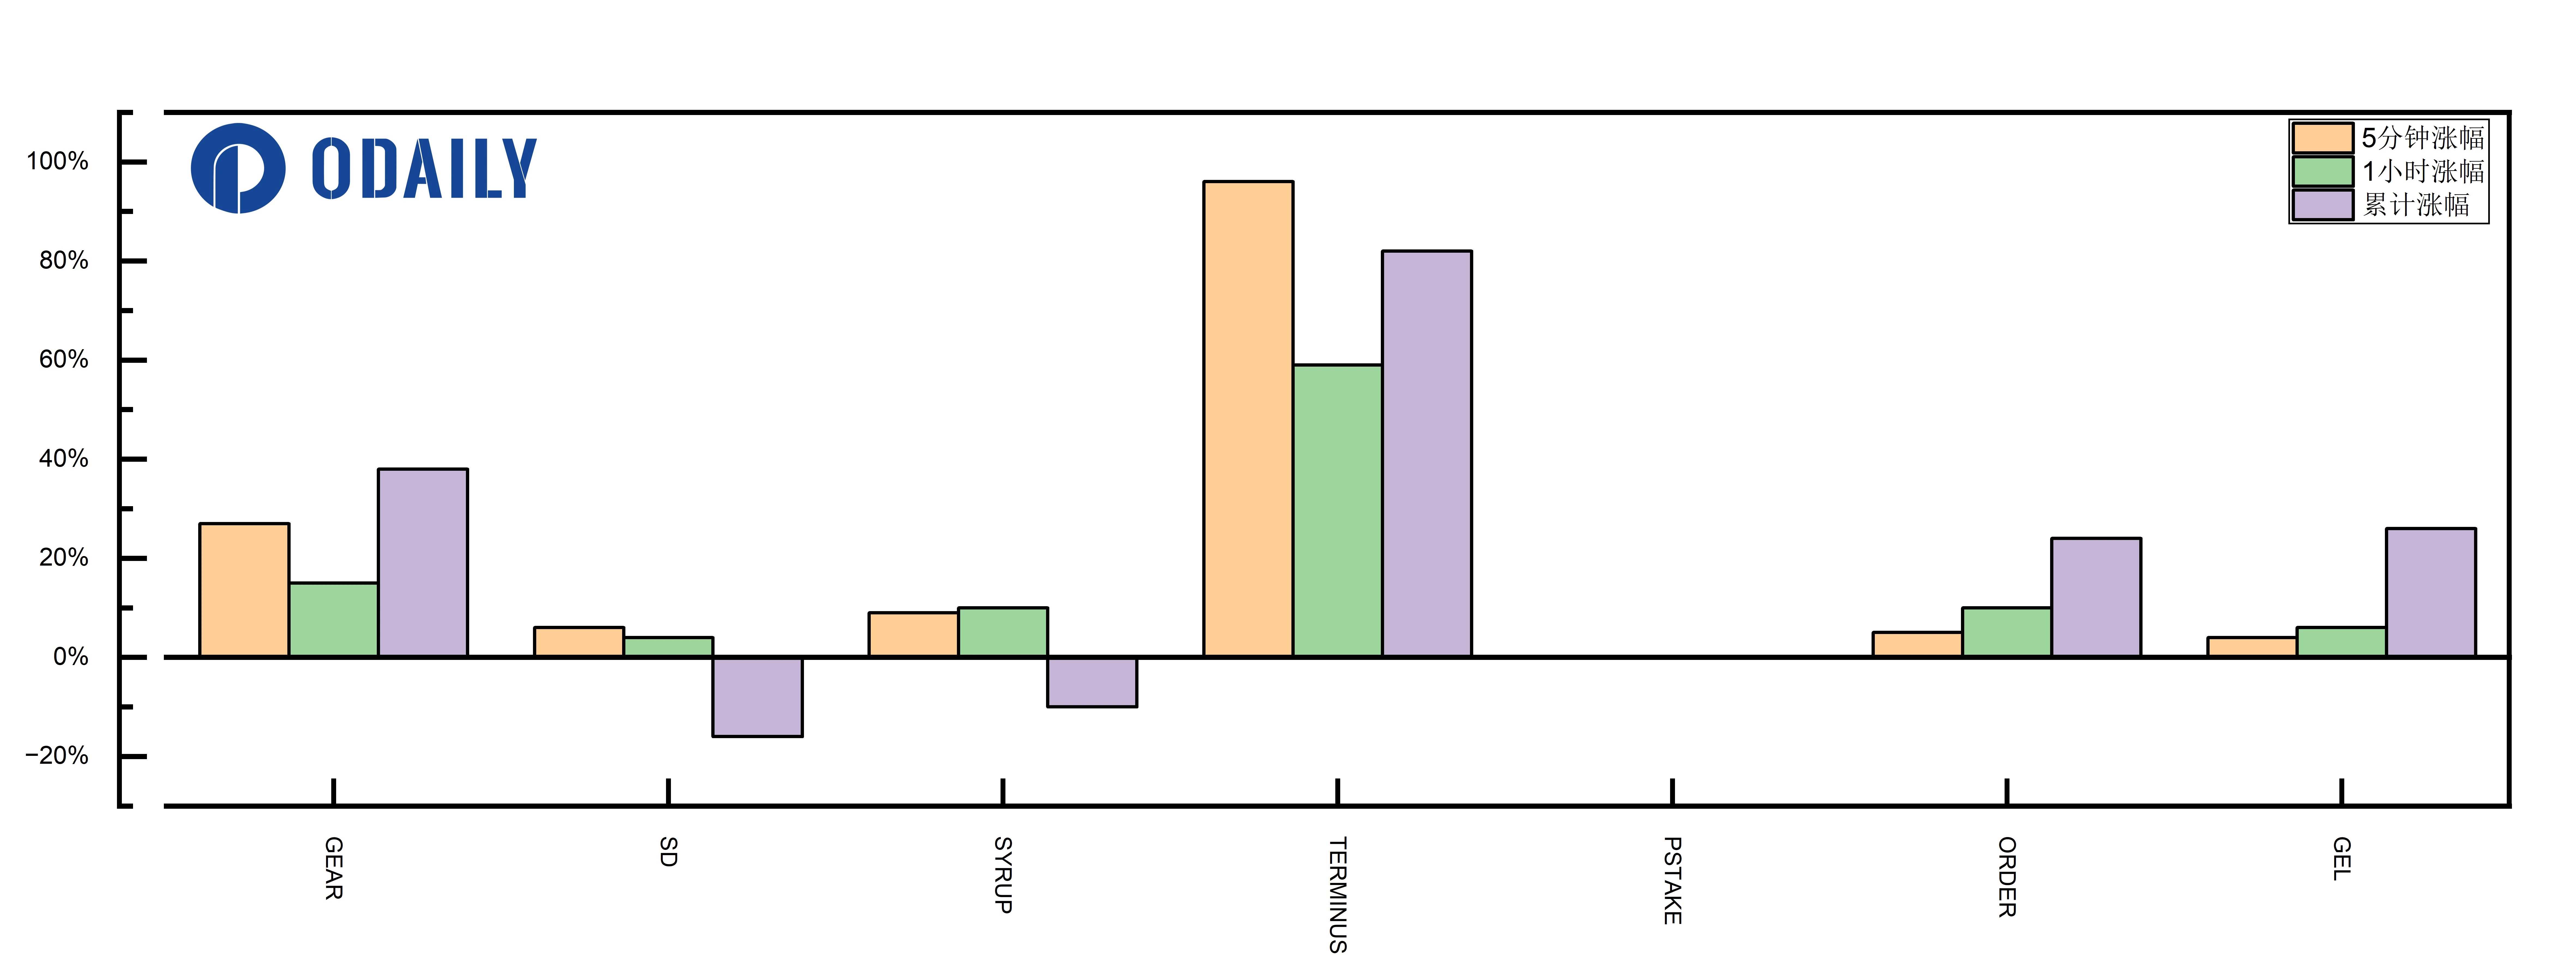
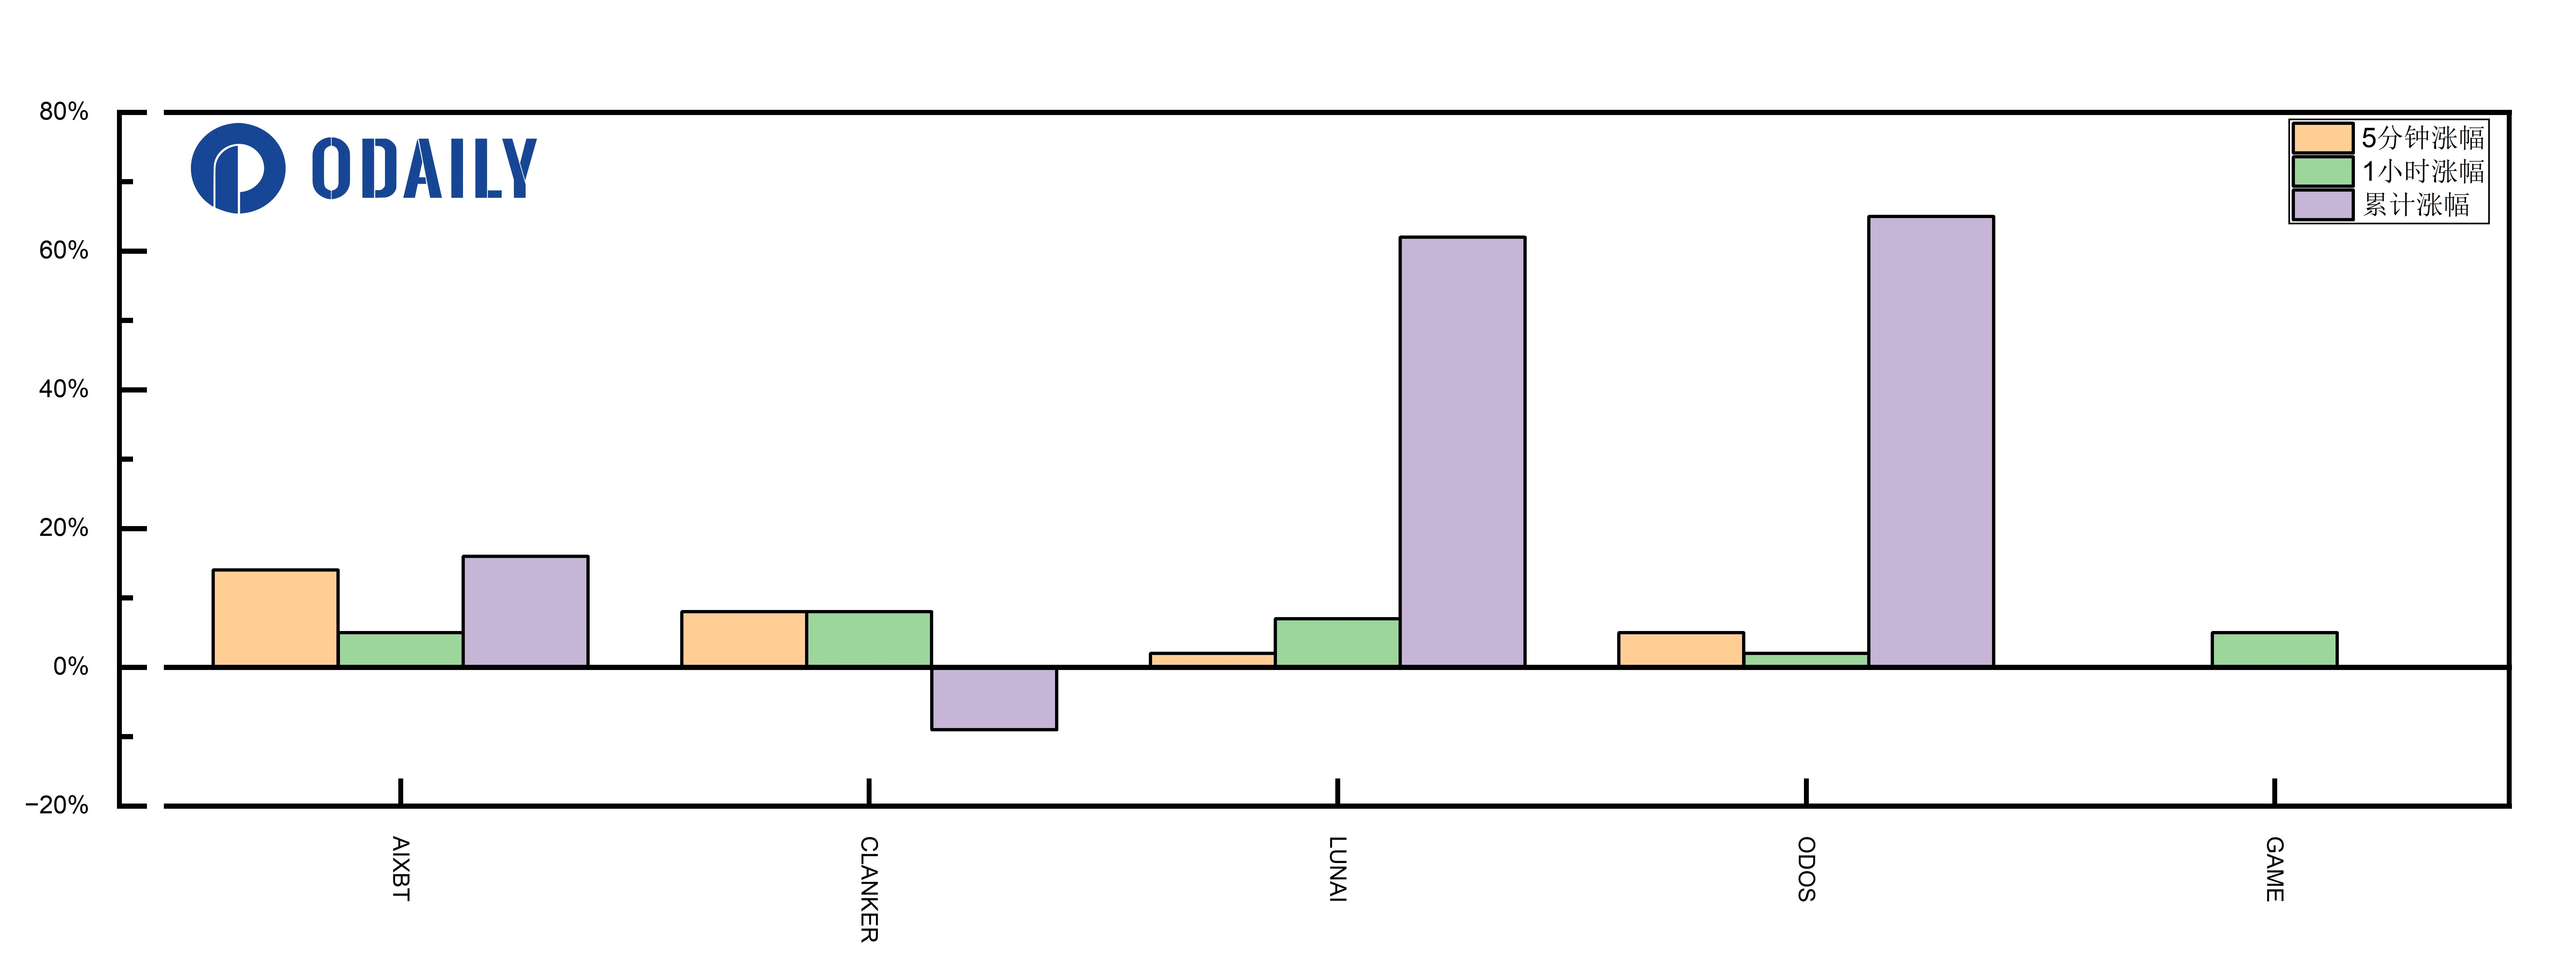
Organized by blockchain, the data tables and charts are shown below. Performance differences across chains are stark: Ethereum leads clearly in 5-minute gains, while Base lags the most; in long-term gains, Solana pulls far ahead, with the other three chains showing similar results.
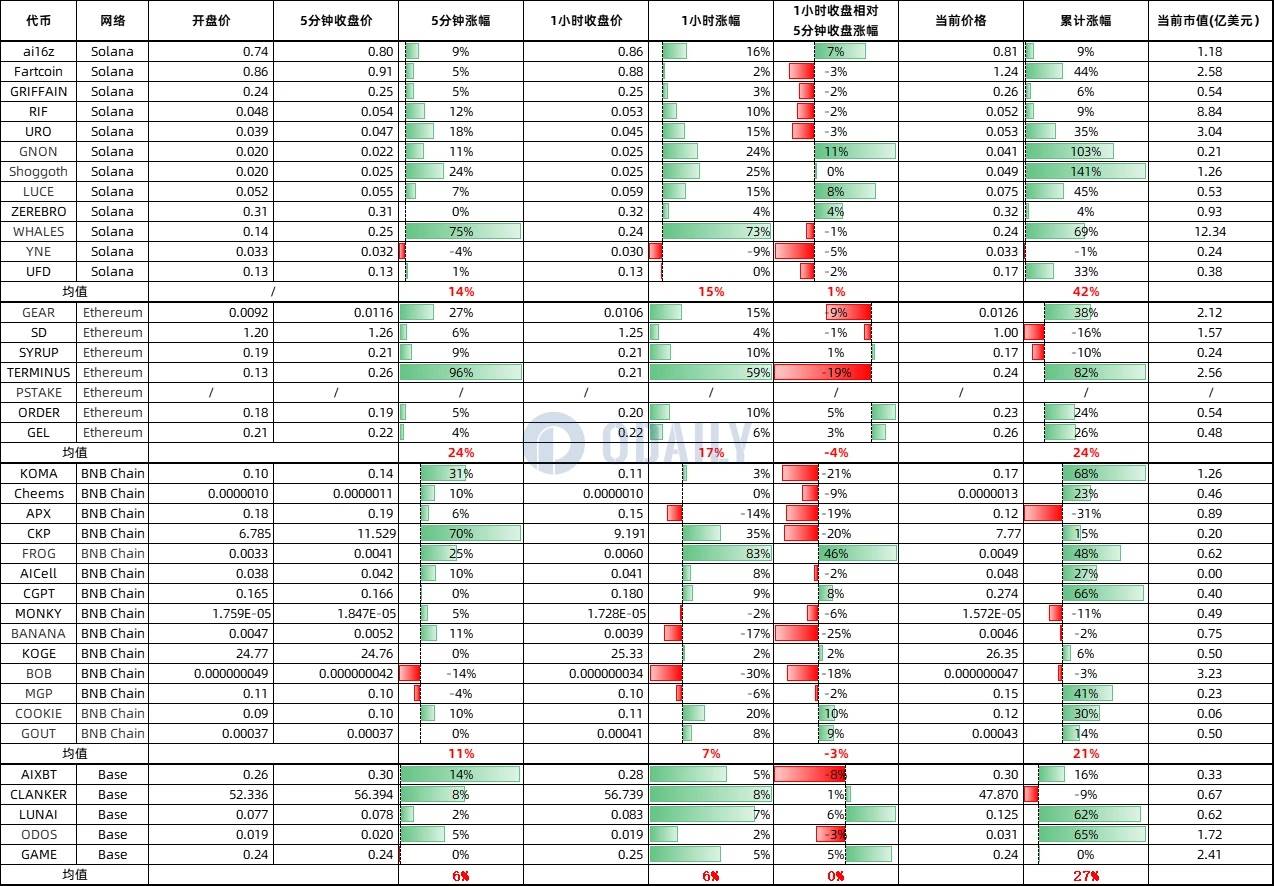
Solana token data is shown below. The 5-minute and 1-hour price changes are relatively similar, but long-term gains are far superior, suggesting Solana may be the most promising chain to focus on within Binance Alpha.
Ethereum data is shown below. The gap between 5-minute and 1-hour gains is much wider compared to Solana. The average 5-minute gain is 24%, dropping to 17% at 1 hour, with cumulative gains since listing only reaching 24%. Given the high gas costs required to secure early entry on Ethereum, coupled with limited overall upside, its current investment appeal appears weakest among the chains.
BNB Chain data is shown below. The divergence between 5-minute and 1-hour performance widens further, but notably, the best long-term performers (purple bars) are those that showed only modest gains at the 1-hour mark.
Base data is shown below. Gains are primarily driven by LUNA and ODOS. With a small sample size, it's too early to identify clear underlying patterns.
Is There a Link Between Listing Performance and Market Cap?
Sorted by ascending market cap, the data across timeframes is shown below. It’s evident that the strongest short-term gainers are all low-market-cap tokens, though they also experience the sharpest pullbacks within 1 hour. Long-term gains, however, show no clear correlation with initial market cap.
Join TechFlow official community to stay tuned
Telegram:https://t.me/TechFlowDaily
X (Twitter):https://x.com/TechFlowPost
X (Twitter) EN:https://x.com/BlockFlow_News
 Odaily






