Over-leveraging Triggers Cascading Liquidations? 8 Data Charts to Help You Understand the Market Situation
TechFlow Selected TechFlow Selected
Over-leveraging Triggers Cascading Liquidations? 8 Data Charts to Help You Understand the Market Situation
Traders on Coinbase began heavily selling an hour before the massive downturn occurred.
Author: Ltrd
Translation: 1912212.eth, Foresight News
This crash marked the largest liquidation since 2021. I'd like to analyze the entire situation from a market microstructure perspective.
First, we need to identify where the heaviest selling pressure originated. We found that traders on Coinbase began aggressively selling nearly an hour before the major downturn occurred.
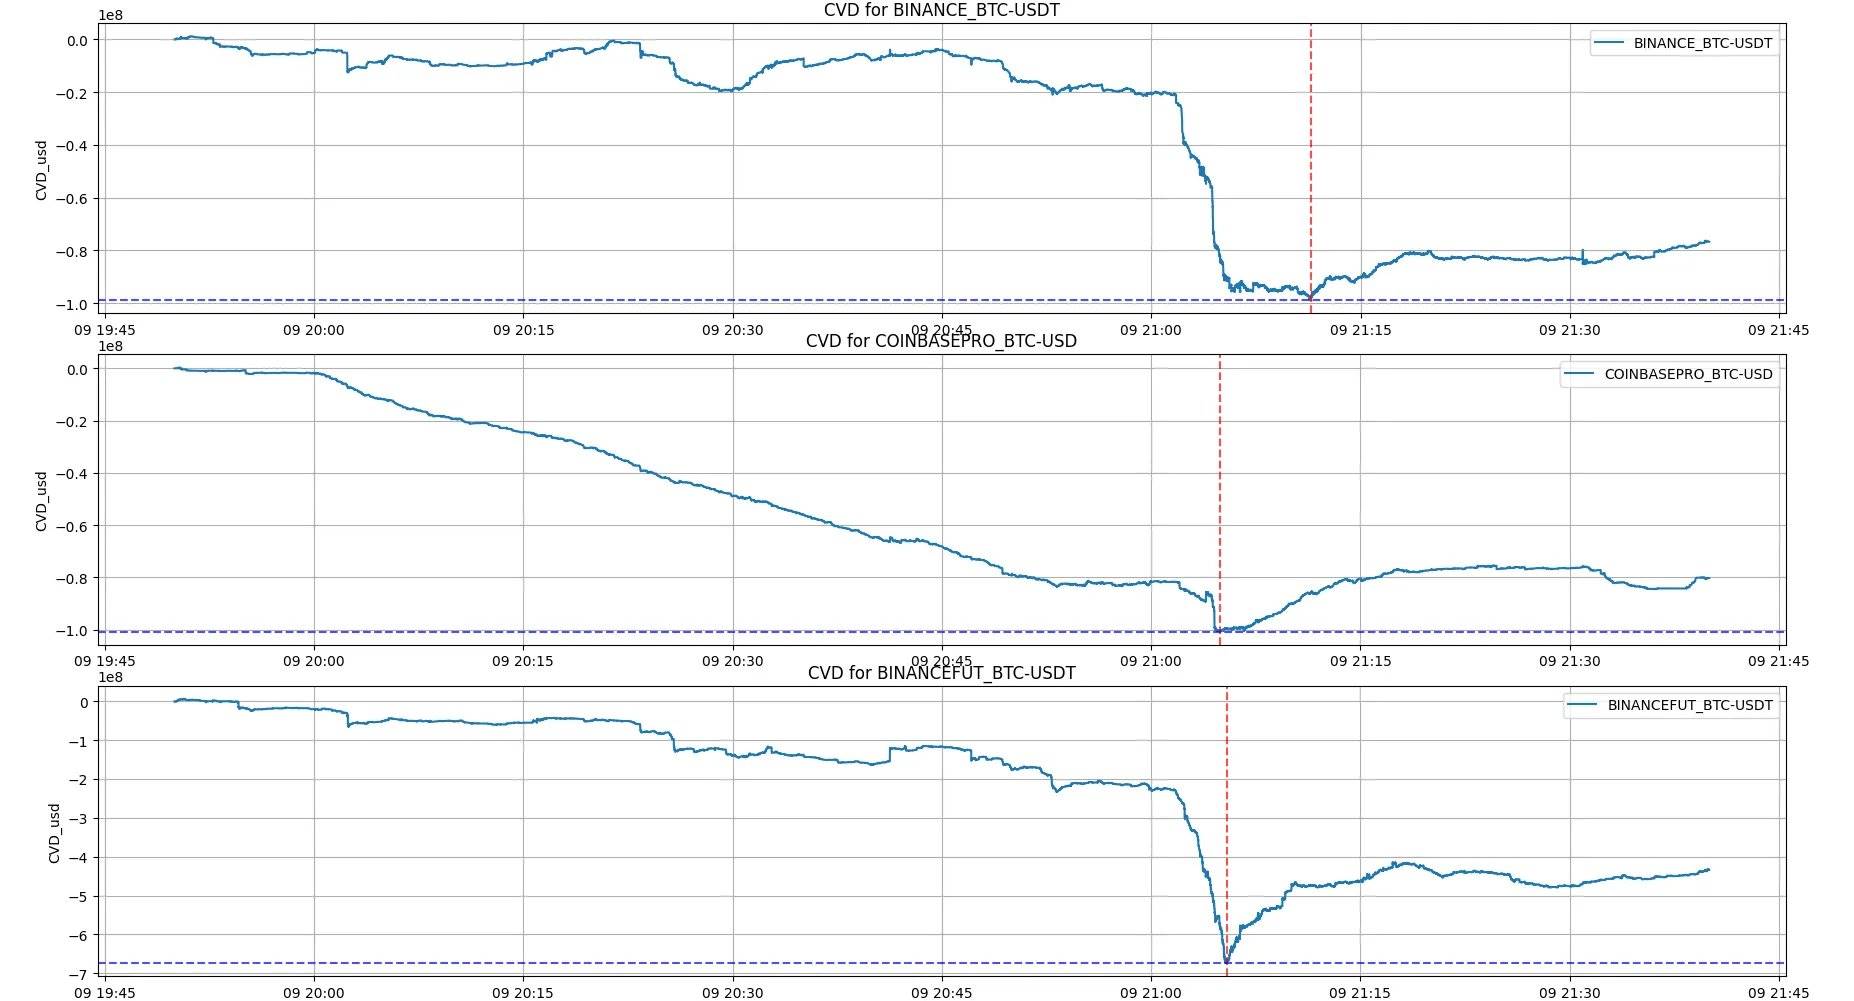
Certainly, the largest price drop was triggered by a cascade of liquidations, but this sustained selling pressure played a crucial role in pushing prices into the zone where leveraged positions were forcibly liquidated. So how do we determine if the market is overheated? It's simple—by observing funding rates and the growth of open interest. These two factors are currently the main drivers of the market, indicating excessive leverage usage.
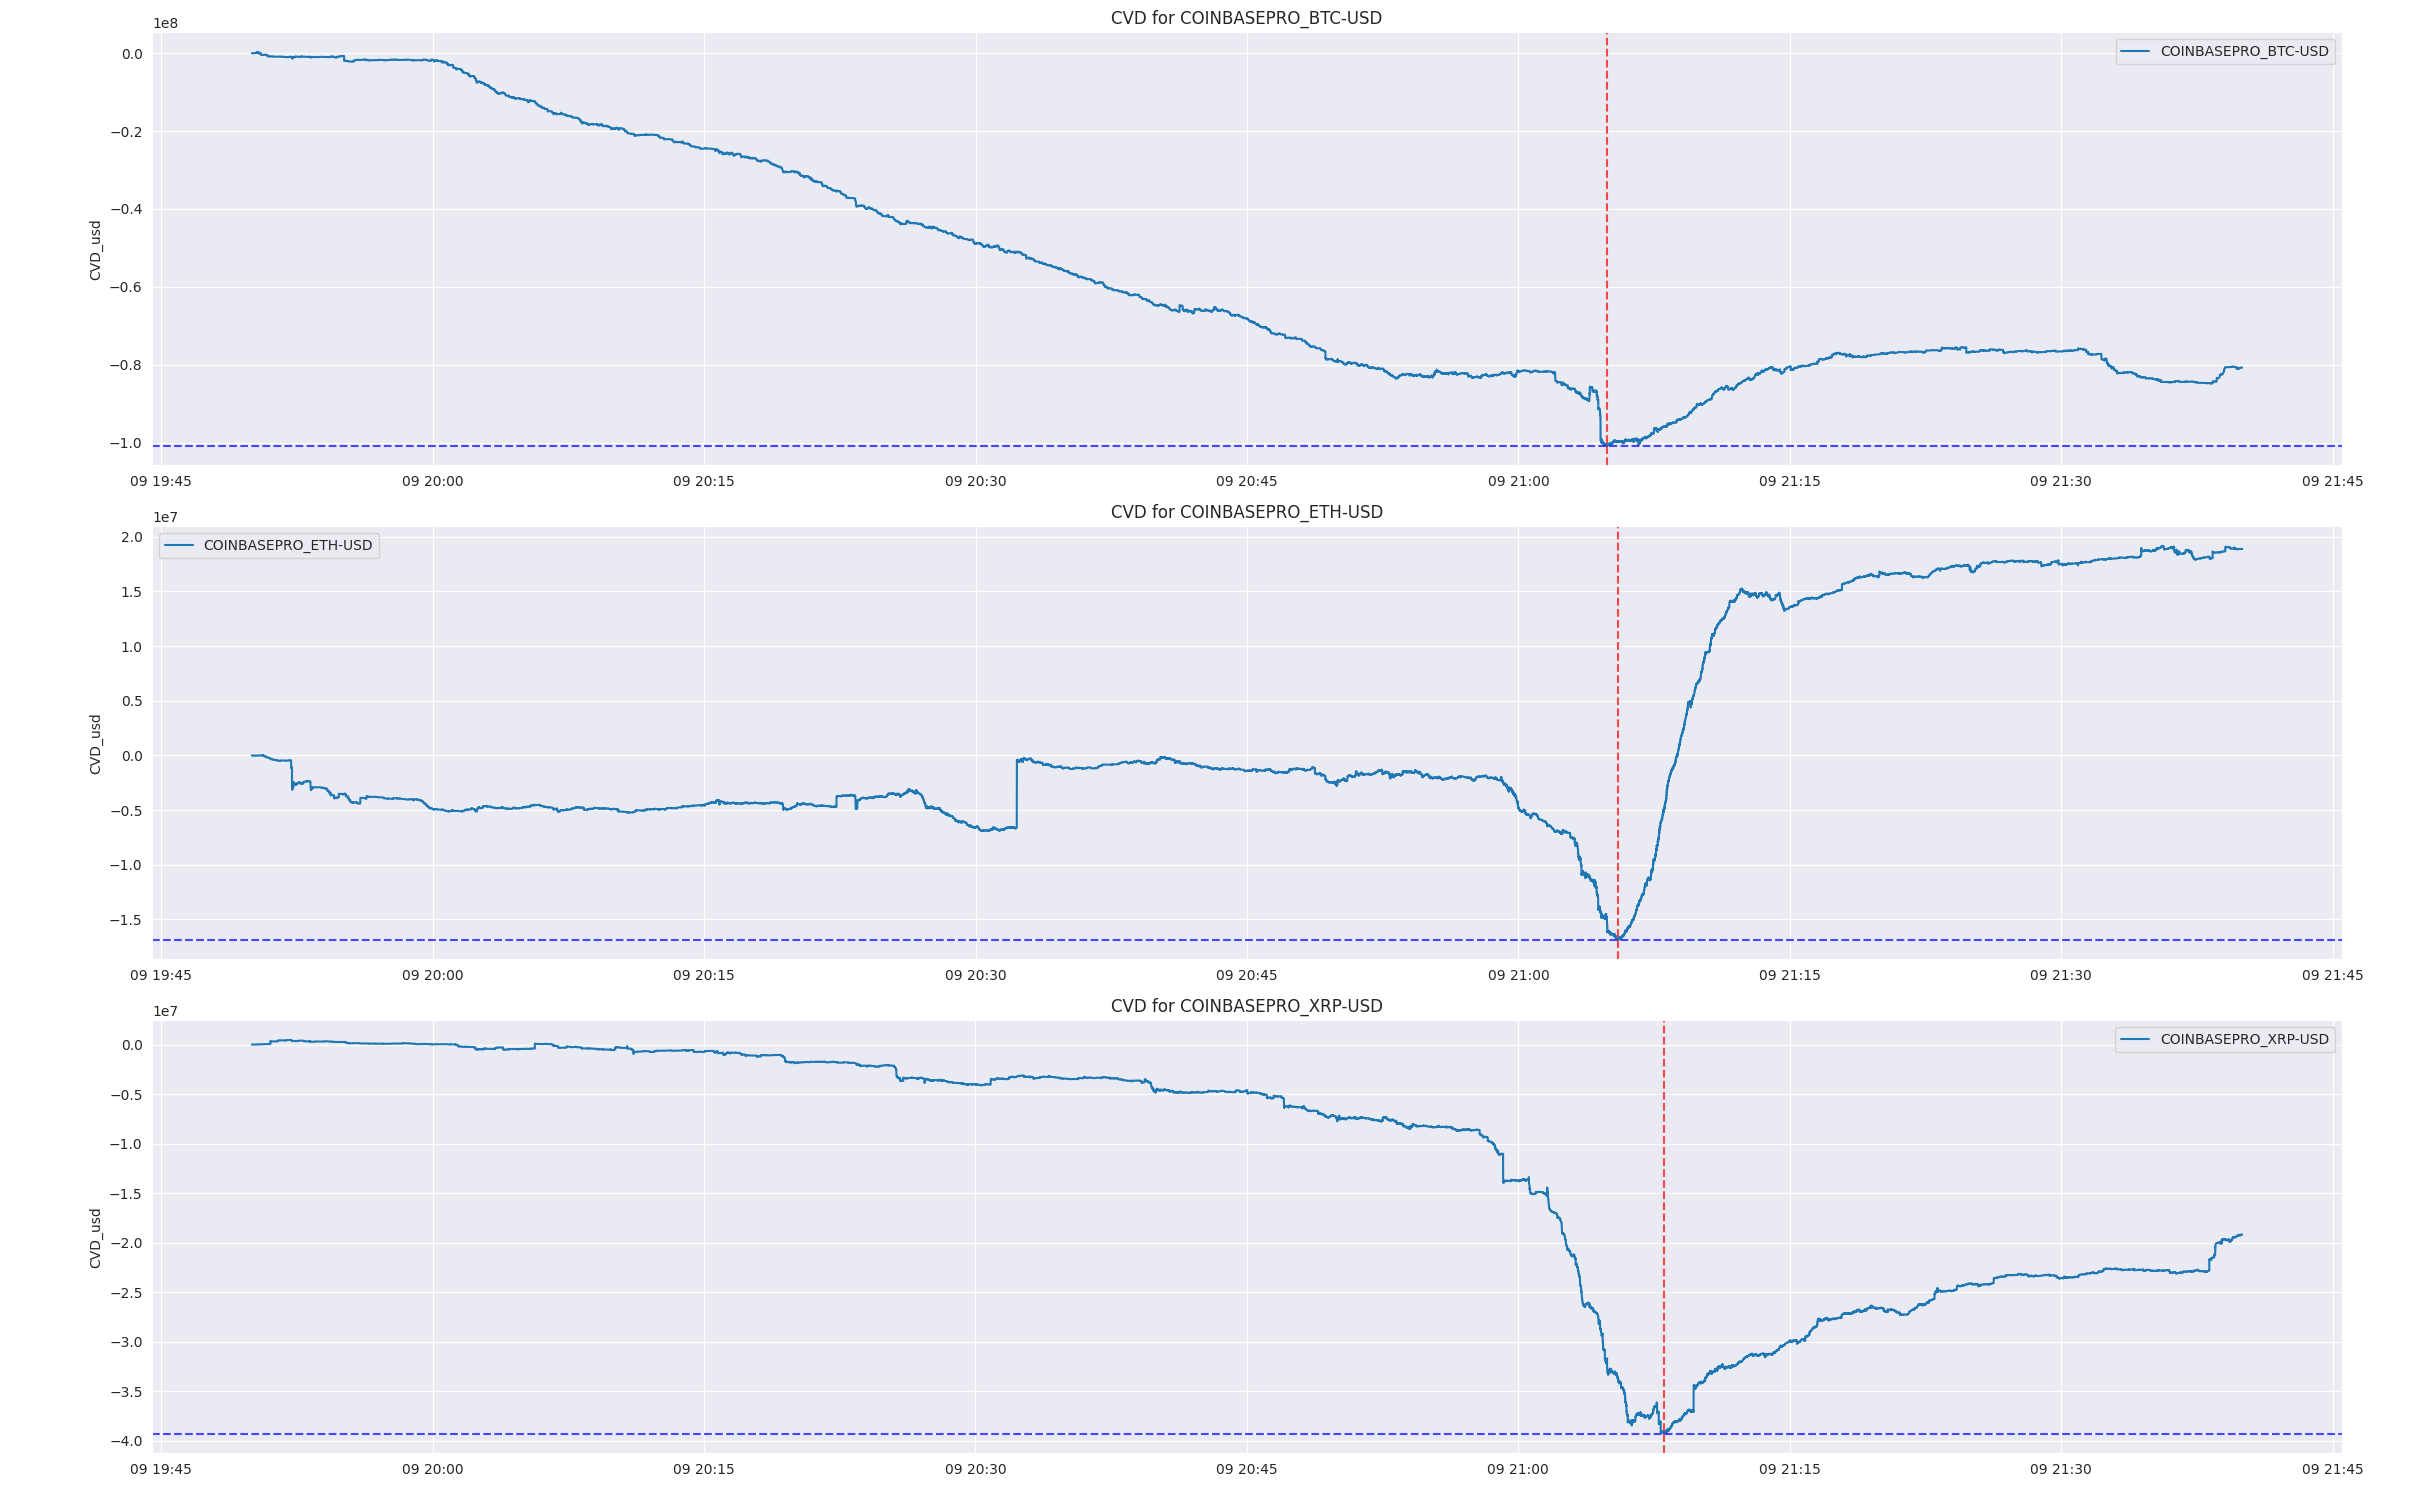
After the crash, strong buying emerged for ETH. Its relative strength over recent days is also evident—could it be that someone is accumulating?
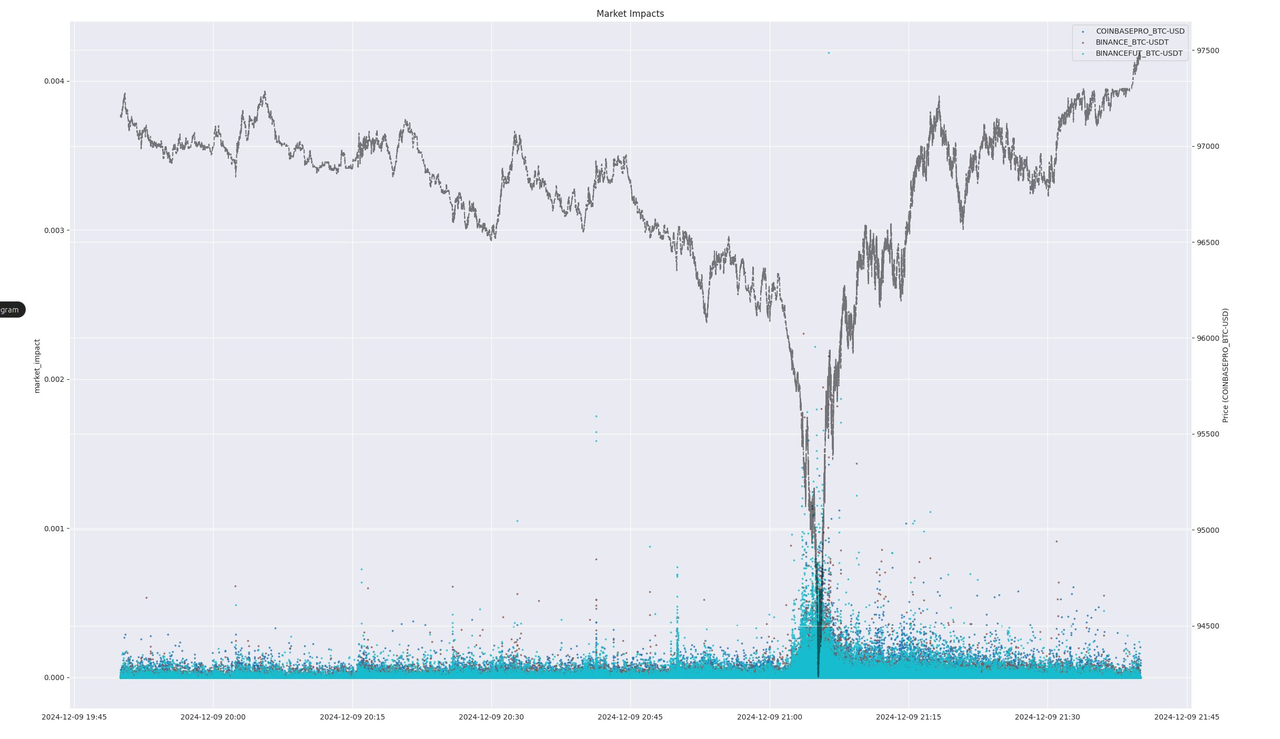
I personally love analyzing market impact. If I could focus on just one market characteristic, it would definitely be market impact. Here, you'll see something shocking—the market impact of XRP on Coinbase is quite substantial.
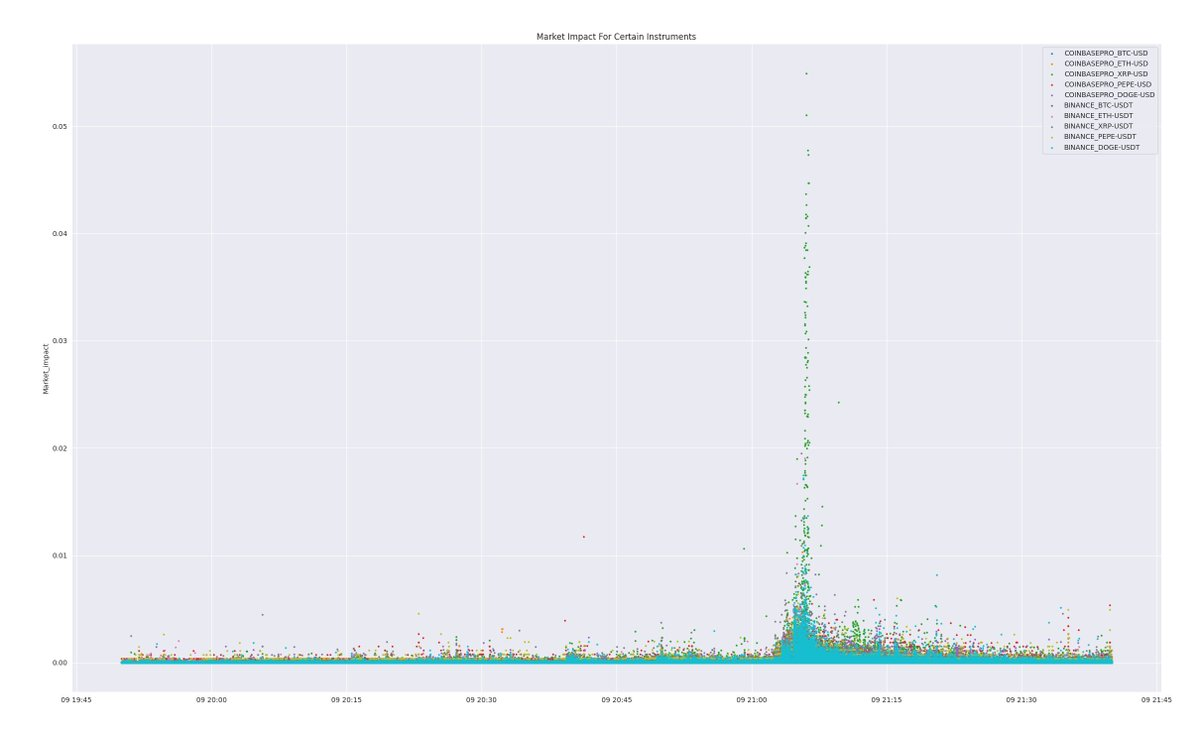
In what should be a relatively mature large market, we witnessed a series of large sell orders that drove the market down more than 5%. We don't yet know exactly what happened, but clearly, this is unusual.
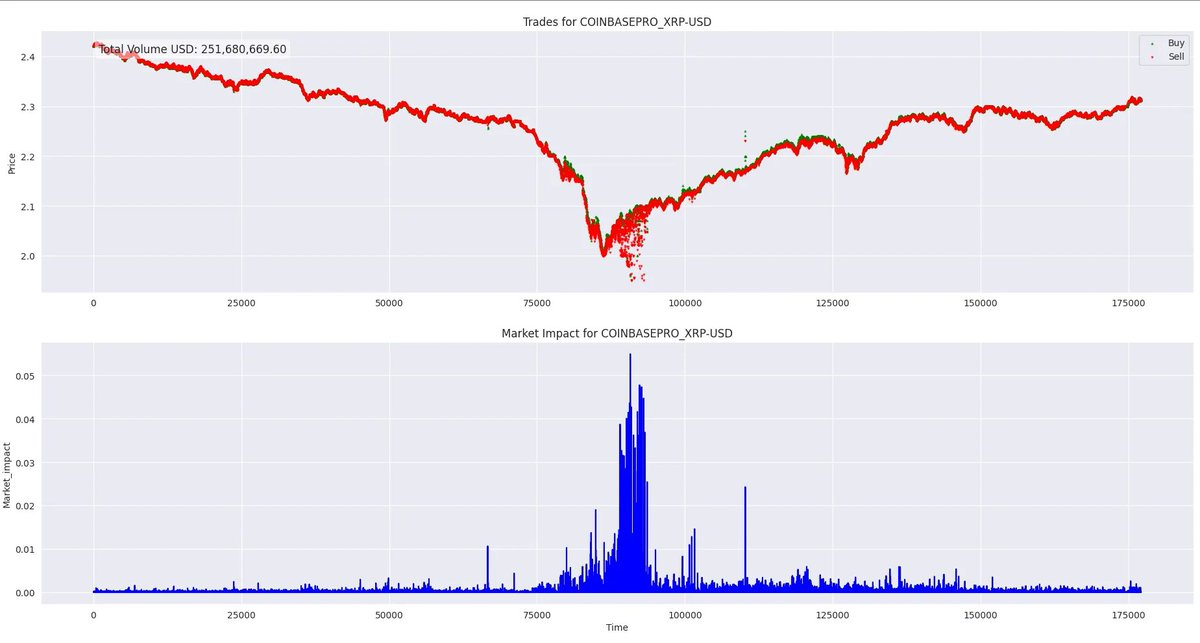
You can see these sell orders are abnormal. This pattern may warrant attention in the coming days. Perhaps a major player was forced to dump.
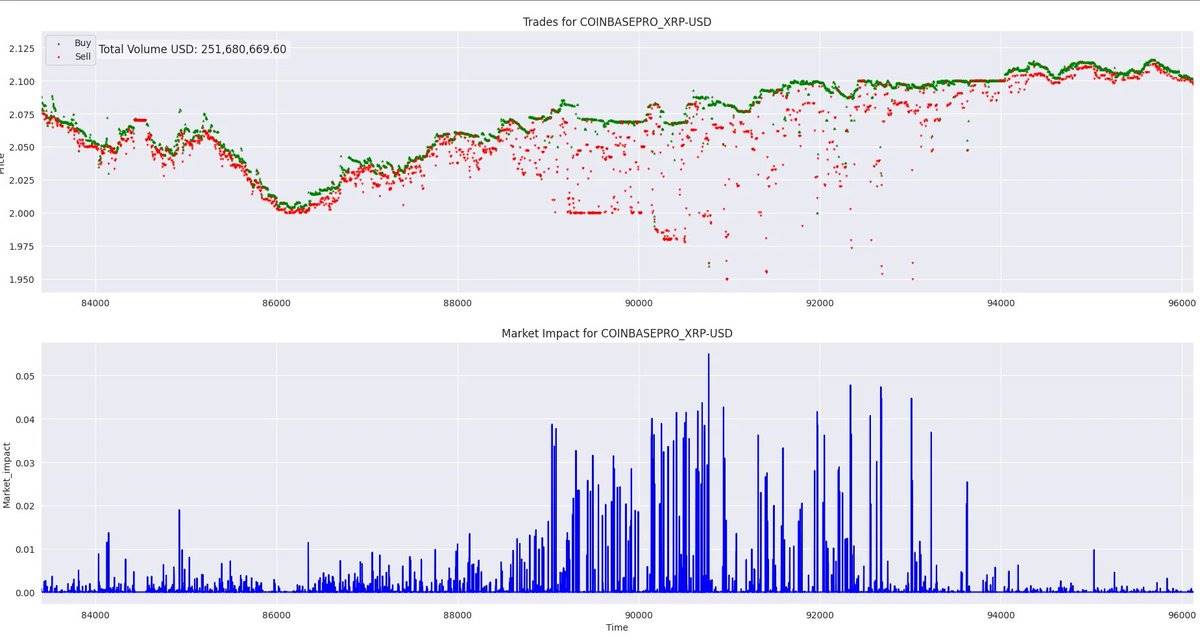
When similar situations occur, they're typically chain reactions of forced liquidation sell orders. Market makers absorb this selling pressure and hedge accordingly, causing signals to propagate across exchanges. For perpetual futures exchanges, this means stop-losses and liquidations get triggered, amplifying the overall impact—especially when such events unfold within minutes.
Assets like XRP, even with market capitalizations comparable to the largest U.S. companies, can still surge by hundreds of percentage points. Relative to their market cap, XRP liquidity in the market remains poor.
In a heated market, the next common phenomenon is a rapid price reversal from the lows. At this point, there are massive liquidations, liquidity constraints, and many profitable players looking to buy the dip.
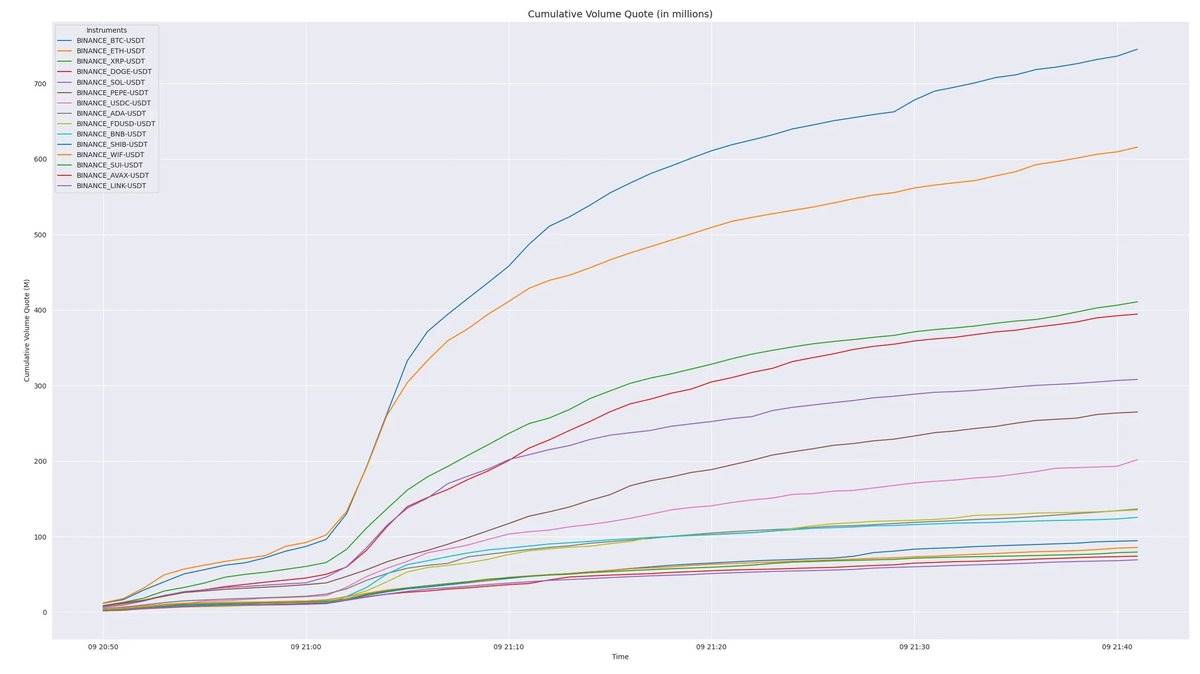
The volume chart shows cumulative trading volume during the crash. Surprisingly, both USDC and FDUSD saw significant volume, but ADA’s volume was exceptionally high.
Join TechFlow official community to stay tuned
Telegram:https://t.me/TechFlowDaily
X (Twitter):https://x.com/TechFlowPost
X (Twitter) EN:https://x.com/BlockFlow_News