

Is the Bitcoin cycle theory dead?
TechFlow Selected TechFlow Selected
Is the Bitcoin cycle theory dead?
How is Bitcoin performing after the fourth halving, and how does this cycle differ from previous ones?
Author: Viee, Core Contributor of Biteye
Editor: Crush, Core Contributor of Biteye
Community: @BiteyeCN
Bitcoin cycle theory, especially its correlation with Bitcoin halving events, has long been regarded as a key tool for predicting Bitcoin's price movements. Historically, Bitcoin halvings have typically led to price increases. However, current market performance and underlying factors suggest that the effectiveness of this theory may be weakening.
This article reviews Bitcoin’s four cycles from 2011 to 2024 and explores market changes in the current cycle.
01 Foundations of Bitcoin Cycle Theory
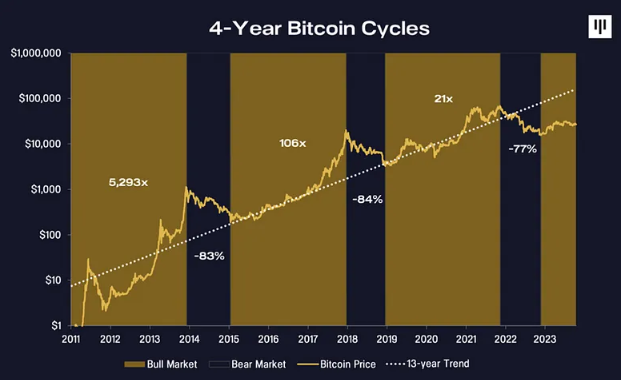
Bitcoin’s block reward halves every 210,000 blocks, roughly every four years. This mechanism is designed to control Bitcoin’s supply and increase its scarcity. Historically, halving events have been followed by significant price increases, forming observable cycles. For example:
2012 Halving: Bitcoin’s price surged from around $12 to over $1,000 by the end of 2013.
2016 Halving: Bitcoin rose to nearly $3,000 shortly after the halving and reached an all-time high near $20,000 by the end of 2017.
2020 Halving: After the May 2020 halving, Bitcoin rapidly climbed to a new all-time high in 2021.
The significant price rallies following the 2012, 2016, and 2020 halvings established clear bull market cycles, lending broad credibility and trust to the Bitcoin cycle theory.
The fourth Bitcoin halving occurred on April 20, 2024. However, post-halving performance has fallen short of expectations.
02 Post-Halving Price Data
If we align historical Bitcoin halving dates to the same starting point on a timeline and compare subsequent prices relative to the price on the halving day, it becomes evident that the current cycle is performing the weakest.
Although the market broke through a new cyclical all-time high before the April halving, this did not alter the relatively lackluster performance of the current cycle.
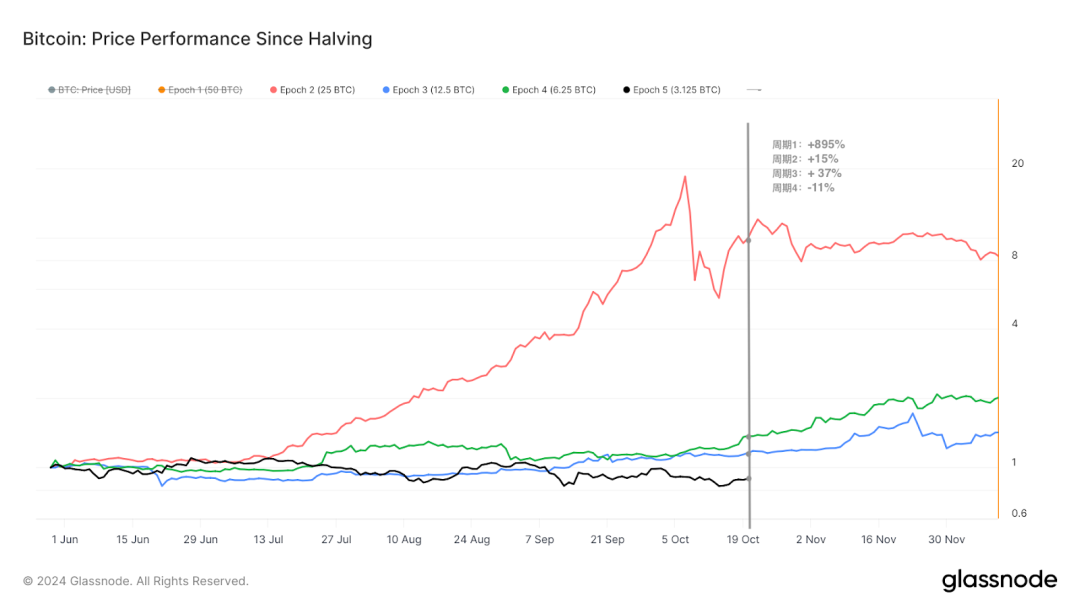
Source: Glassnode
Below are the price changes approximately 144 days after each halving event (compared to the price on the halving day):
-
Cycle 1: +895%
-
Cycle 2: +15%
-
Cycle 3: +37%
-
Cycle 4: -11%
The current cycle shows a weaker price reaction post-halving compared to previous ones, with Bitcoin underperforming. Why is this happening? How does this cycle differ from earlier ones?
03 Bitcoin Moving Toward Stability
The 2023–2024 Bitcoin cycle shares some similarities with past cycles but also exhibits notable differences.
Following the FTX collapse at the end of 2022, the market experienced about 18 months of steady upward movement. With the approval of Bitcoin ETFs, new capital continued to flow in, pushing prices to a peak of $73,000 before entering a three-month period of range-bound consolidation.
During this phase, from May to July, Bitcoin underwent its deepest cyclical correction, with a pullback exceeding 26%. While significant, this decline was shallower than in previous cycles, and volatility was reduced—indicating a more stable market structure and Bitcoin’s maturation as a financial asset.
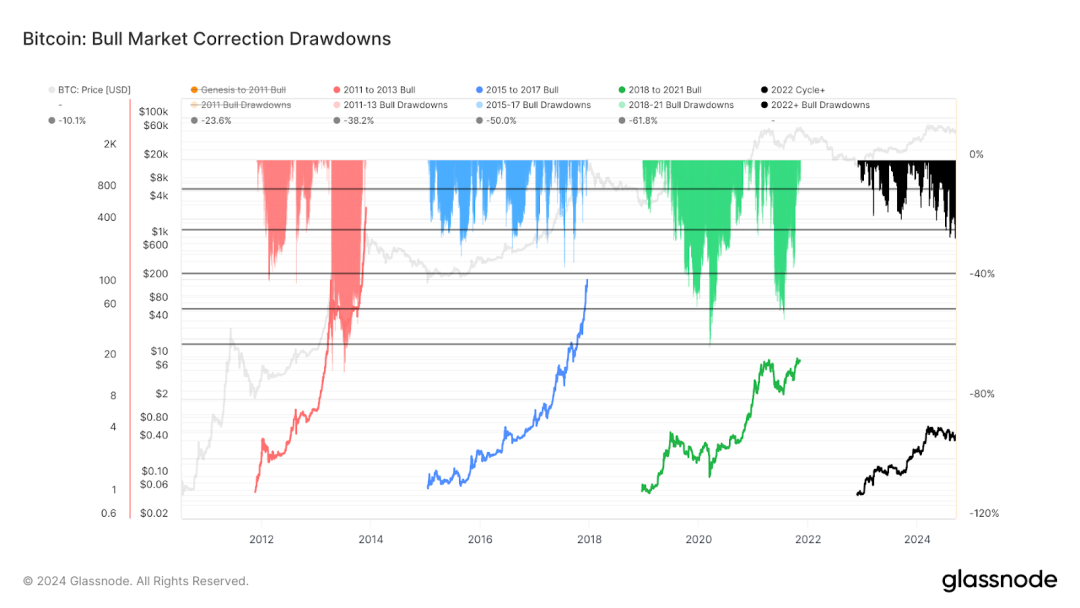
Source: Glassnode
Let’s examine another technical indicator, the MVRV Z-Score, which further highlights differences across cycles.
The MVRV Z-Score is a relative metric calculated as: (Market Value – Realized Value) / Standard Deviation of Market Value. A high value indicates that Bitcoin is overvalued relative to its realized value, potentially signaling downside risk. Conversely, a low value suggests undervaluation.
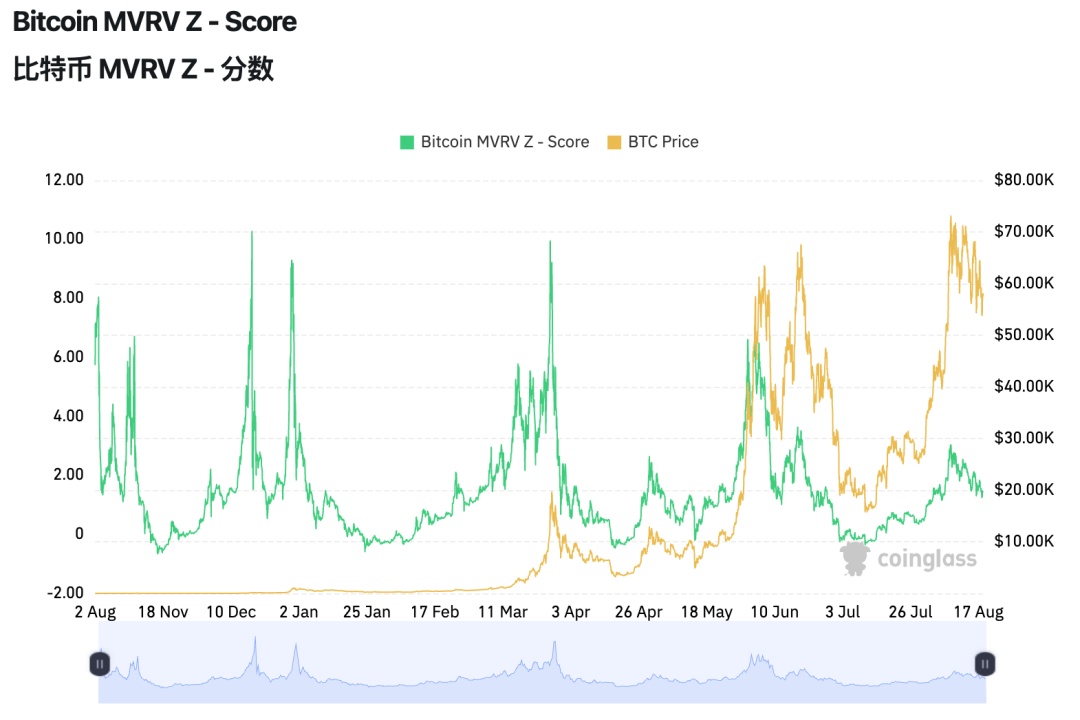
Source: Coinglass
From the data spanning 2010 to 2024, we can see that in the current cycle, the MVRV Z-Score (green line) shows milder fluctuations, lower peaks, and more moderate returns compared to earlier cycles.
Bitcoin appears to be shifting toward a stable, gradual upward trend rather than the explosive price surges seen previously. This incremental growth model may be more sustainable and attractive over the long term.
04 Reasons Behind Reduced Volatility
We can use one data metric to clearly explain why Bitcoin’s volatility has decreased and stabilized.
The Bitcoin 5+ Years HODL Wave indicator shows the percentage of Bitcoin that has not moved on-chain for at least five years—sometimes referred to as supply from coins last active five years ago. To some extent, it reflects the behavior of long-term market participants.
It’s possible that some of these bitcoins are lost—i.e., users no longer have access to the private keys of wallets containing them—but this proportion is relatively small.
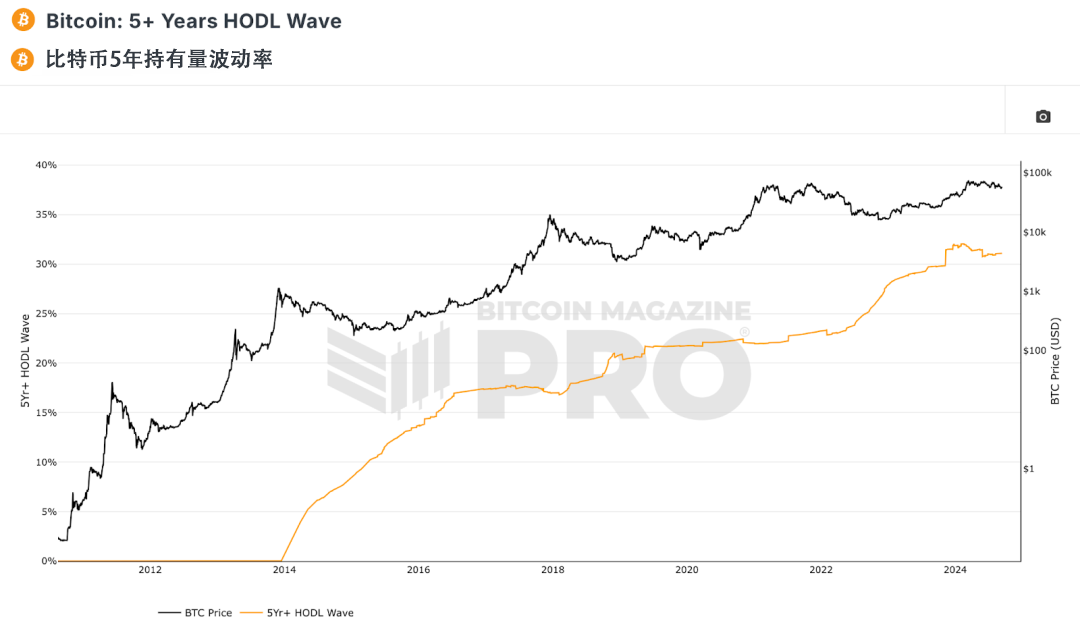
As shown in the chart, over 30% of Bitcoin has not been transferred in the past five years—and this ratio may continue to rise.
This phenomenon reduces the amount of Bitcoin circulating in the market, an effect that now outweighs the reduction in newly issued supply caused by halving events.
This means the trend of long-term holding is significantly increasing, enabling the market to better withstand short-term volatility and potentially dampening Bitcoin’s cyclical swings—one key reason behind its reduced volatility.
Other contributing factors include: as the market matures, more investors are choosing to hold Bitcoin long-term, reducing liquid supply and mitigating sharp price swings.
Additionally, Bitcoin’s supply-demand dynamics are evolving, with sustained capital inflows providing price support.
Furthermore, global economic uncertainty, policy shifts, and market sentiment also influence Bitcoin’s price.
In this context, Bitcoin’s price may become increasingly correlated with traditional financial markets, reducing its independent volatility.
These factors collectively contribute to Bitcoin’s relatively mild volatility in the current cycle.
05 Conclusion
Compared to historical cycles, the current cycle features smaller price corrections, a more robust market structure, and reduced Bitcoin price volatility.
Therefore, relying solely on market cycle analysis is insufficient when trading Bitcoin. On one hand, historical data cannot reliably predict future movements. On the other hand, the crypto market is gradually moving toward greater regulation, enhanced liquidity, and broader adoption—natural outcomes of financial evolution.
💡 Risk Notice: This article is for informational purposes only and does not constitute investment advice. Please comply with the laws and regulations of your jurisdiction.
Join TechFlow official community to stay tuned
Telegram:https://t.me/TechFlowDaily
X (Twitter):https://x.com/TechFlowPost
X (Twitter) EN:https://x.com/BlockFlow_News


