

EMC Labs Report: September Rate Cut, Bitcoin Adjusted for Six Months Will Reset Trend
TechFlow Selected TechFlow Selected
EMC Labs Report: September Rate Cut, Bitcoin Adjusted for Six Months Will Reset Trend
September will become the most important month of the year, as both the U.S. stock market and the crypto market will provide preliminary answers in this month.
By 0xWeilan
After March 2024, the crypto asset market appears to have passively devolved into a second-rate performance centered on "waiting." All actors, creators, and producers seem to have forgotten the plot, script, and original theme—merely stretching their necks, waiting for a certain "audience" to arrive and wondering if tonight will bring a hurricane.
From mid-March to the end of August, over five months passed with BTC prices oscillating repeatedly within the "new high consolidation zone." During this period, global markets experienced recurring inflation, disinflation, ambiguous then clearer expectations of USD rate cuts, uncertain speculation over whether the economy would achieve a soft or hard landing, and significant market volatility triggered by shifts in trends prompting investors to adjust their positions.
Against this backdrop, a portion of BTC investors in the crypto market executed their first major sell-off, locking in profits and draining liquidity. This was accompanied by speculative shorting, panic-driven selling, and portfolio rebalancing between altcoins and BTC driven by shifting risk appetite due to market sentiment.
This is the essence of the market movement we have observed during this period.
After five and a half months of turbulence, the crypto market has entered a downturn. Spot liquidity has significantly decreased, leverage has been cleared, rallies are weak, rebound highs continue to decline, investor morale is low, and pessimistic, negative sentiment hangs over the crypto market.
This is both an outcome of market dynamics and an internal resistance for the next phase. However, in our view, even greater resistance lies outside the market—uncertainty in macro finance, concerns about a U.S. economic hard landing, and unclear trends in U.S. equity markets.
The internal crypto market has nearly completed its cleansing phase. Market cap distribution and long/short holder positioning have entered a buildup phase, preparing for upward momentum. Yet, on-chain capital remains relatively weak, lacking the confidence and capacity to make independent directional moves.
URPD: Over 2.91 Million BTC Flooded Into the 'New High Consolidation Zone'
Over the past eight months, the market has remained volatile. When we turn our attention on-chain, we can see orderly outcomes emerging from chaotic movements.
Bitcoin Network URPD (March 13)
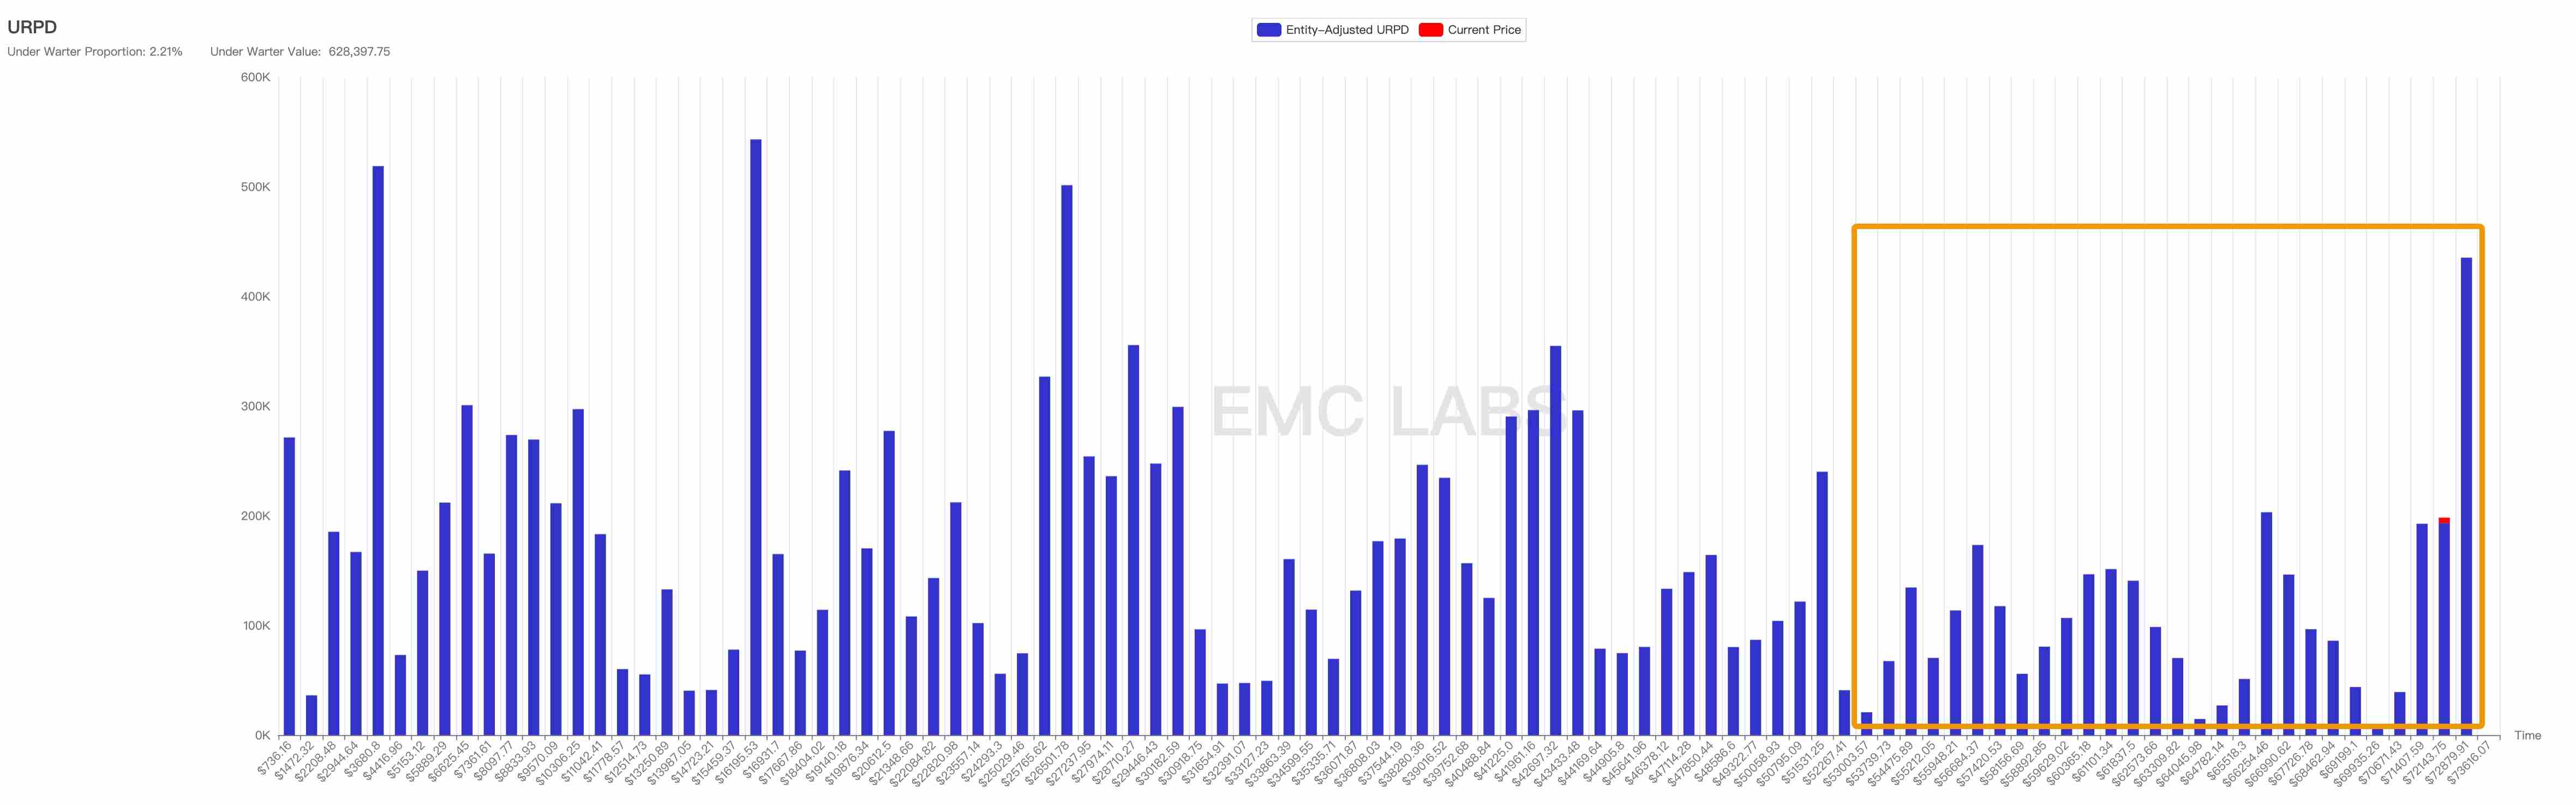
The URPD indicator analyzes the price distribution of all unspent BTC, effectively revealing the final state of chip allocation. The chart above shows BTC's distribution structure when it hit a record high on March 13. At that time, 3.086 million BTC were accumulated in the "new high consolidation zone" (USD 53,000–74,000). By the closing price on August 31, the amount of BTC distributed in this range reached 6.002 million—meaning at least 2.916 million BTC were deployed in this range over the past five months.
 BTC URPD (August 31)
In terms of timing, BTC began its breakout rally in mid-October last year and reached its historical peak on March 13—a rise lasting just over five months. Now, after another five months of sideways consolidation in the "new high zone," the price has fluctuated more than seven times, with a high of USD 72,777 and a low of USD 49,050. This prolonged consolidation resulted in the exchange of over 2.916 million BTC (the real figure is likely higher, as centralized exchange transactions aren't fully reflected on-chain), greatly depleting market liquidity.
 BTC Realized Market Cap
Through the "realized market cap"—calculated based on acquisition cost—we observe that although prices failed to break higher after entering the new high consolidation zone in March, the realized market cap continued to grow. This indicates that large volumes of low-cost BTC were revalued during this period. These upwardly repriced BTC holdings can either serve as support or resistance under specific conditions.
Therefore, we maintain a neutral stance on URPD distribution. While substantial chip exchange has occurred and significant capital has positioned itself favorably for future gains, the nature of these funds remains unknown. Whether they will provide support or pressure in the future requires further observation.
Long vs Short Holders: Major Sell-Off and Recooling
We view market cycles as large-scale handovers between long-term and short-term investors over time, with each converting between BTC and USD.
 Long/Short Holder Positioning (Weekly)
BTC’s rally began in mid-October. Large-scale long-holder selling started in December, peaking in February and March, driving the market to new highs before initiating correction, gradually forming the "new high consolidation zone."
Since May, long-holder selling has sharply declined. This group resumed accumulation, accelerating purchases notably in July and August. From the lowest point to August 31, long holders added 630,000 BTC. The primary sellers came from short-term holders and miners.
In our June report, we noted that each bull market experiences two major sell-offs, and only the second one fully drains market liquidity, ultimately ending the bull run. What occurred over recent months was merely the first wave of selling. This first sell-off, now nearing its end after five months, is clearly evident in on-chain distribution data.
 BTC HODL Waves
HODL Waves show that newly minted coins (within 3 months) have rapidly diminished, indicating a sharp drop in speculative activity. Coins aged 3–6 months are also declining quickly—forming a key part of the consolidation zone holdings. Most of these BTC holders entered after ETF approval and should be considered "single-cycle long holders." This means most of their holdings will transition into long-term positions—an increase of 470,000 BTC in long-term holdings by August is clear evidence. In the foreseeable future, long-term holdings will continue to grow rapidly.
The cooling of BTC's holding structure reflects BTC transitioning back from short-term to long-term hands during the "new high adjustment period." Such a shift drastically reduces market liquidity. Declining liquidity tends to push BTC prices lower when capital is scarce but can drive prices higher when capital is abundant.
Thus, we conclude: After over five months of consolidation, the market internals are well-prepared, and price direction will now be determined primarily by capital flows—not internal chip redistribution.
Capital Flows: Cooling ETF Channel
In our November 2023 report, we highlighted that stablecoin channel inflows turned positive in mid-October—the first time since February 2022—marking the beginning of a new phase. Following this, BTC launched a strong rally.
 Major Stablecoins Inflow/Outflow (Monthly)
During the more than five-month correction, May and June were the most capital-starved periods, recording only USD 1.201 billion in total inflows. This pessimistic trend is reversing: July and August saw inflows of USD 2.696 billion and USD 5.09 billion respectively. This capital influx signals recognition of prices within the new high consolidation zone and medium-to-long-term optimism toward the second half of the bull market.
Following the January approval of 11 U.S. BTC ETFs, ETF channel capital became a significant independent force. As previously emphasized, this capital possesses independent intent and, due to its scale and decisiveness, plays a critical role in pricing BTC. During Germany's government-related BTC sell-off in July—which triggered panic selling—BTC ETF capital seized the opportunity to accumulate large amounts of cheap BTC.
However, in August, as rate hikes became increasingly certain and the yen unexpectedly rose, arbitrage traders aggressively unwound positions, triggering severe global equity market swings. BTC ETFs, viewed as high-risk assets, were impacted. Early-month continuous selling by ETF holders pushed BTC down to USD 49,000—the lowest in months—and broke below the lower boundary of the consolidation zone. Subsequently, ETF capital gradually returned (followed shortly by stablecoin bottom-fishing), pulling BTC back to USD 64,000. But by month-end, ETF outflows resumed, and BTC dropped again below USD 60,000.
 Daily Net Inflows/Outflows of 11 BTC ETF Funds (August)
On a monthly basis, net inflows for BTC ETF channels stood at -USD 72.83 million in August—the second-worst monthly performance on record, only slightly better than April.
 Monthly Net Inflows/Outflows of 11 BTC ETF Funds
Combining both flows:
 Combined Monthly Net Inflows: Stablecoins + 11 BTC ETFs
Although stablecoins recorded three consecutive months of accelerating inflows, ETF outflows caused August’s total capital inflow to reach only USD 5 billion—down from USD 5.9 billion in July. EMC Labs believes that amid increasingly stable chip distribution, capital inflows were the fundamental reason BTC recovered to USD 65,000 after the crash. However, reduced inflows limited August’s peak (USD 65,050) well below July’s (USD 70,000). The shortfall stemmed directly from ETF inflows dropping from USD 3.2 billion in July to an outflow of USD 72.83 million in August.
The BTC ETF channel, closely tied to U.S. equities, has become the decisive factor in market direction.
September Rate Cut: Soft Landing vs Hard Landing
Unlike BTC’s weak August performance, despite similar volatility, U.S. equities showed remarkable resilience. The Nasdaq gained 0.65% for the month, while the Dow Jones Industrial Average hit a new all-time high. Amid this, debates raged over whether the Fed would cut rates by 25 or 50 basis points in September—but traders’ true focus was the core question: Will the U.S. economy achieve a soft landing or face a hard landing?
Based on current equity trends, EMC Labs believes the market generally expects a soft landing and has not priced in a broad downward correction. Under this assumption, some capital rotated out of the already highly appreciated "Magnificent Seven" stocks (most of which underperformed the Nasdaq this month) and into other blue-chip stocks with less gain, pushing the Dow to a new high.
Based on historical patterns, we believe equity market participants view BTC similarly to the "Magnificent Seven"—promising long-term potential but currently overvalued—leading to widespread selling roughly synchronized with the tech giants. However, compared to BTC, the "Magnificent Seven" remain far more attractive to mainstream capital, resulting in stronger rebounds post-correction.
Currently, CME FedWatch indicates a 69% probability of a 25-basis-point rate cut in September and a 31% chance of a 50-basis-point cut.
EMC Labs believes that if a 25-basis-point cut is confirmed in September, and no major economic or employment data contradict the soft landing narrative, U.S. equities will stabilize. If the Magnificent Seven recover, BTC ETF flows will likely return to positive territory, driving BTC upward to retest the psychological USD 70,000 level and potentially challenge new highs. Conversely, if key data indicate a hard landing, U.S. equities—especially the Magnificent Seven—will likely correct downward, and BTC ETF flows would probably remain bearish, pushing BTC to retest the lower boundary of the consolidation zone around USD 54,000.
This outlook assumes no significant trend change in stablecoin channel flows in September. Additionally, we remain cautious on stablecoins: although this channel continues to accumulate, we believe it alone is unlikely to propel BTC into an independent bull run. The most optimistic scenario involves simultaneous inflows from both stablecoin and ETF channels under a recovery of the Magnificent Seven, giving BTC a high probability of breaking past previous highs.
Conclusion
BTC broke above USD 54,000 in January, set a new all-time high in March, and has undergone consolidation within the "new high zone" since April—now exceeding five months, approaching the six-month rally seen from last September. In terms of duration, we are nearing a trend inflection point.
 BTC Monthly Chart
This may explain why stablecoin channel capital is gradually accumulating, rebuilding buying power.
Yet, a true breakout still hinges on favorable confirmation of macroeconomic and core U.S. economic data, followed by a renewed influx of mainstream capital from U.S. equities into the BTC ETF channel.
With the dollar re-entering a rate-cutting cycle, September has become the most critical month of the year—when both the stock and crypto markets will deliver preliminary answers.
Join TechFlow official community to stay tuned
Telegram:https://t.me/TechFlowDaily
X (Twitter):https://x.com/TechFlowPost
X (Twitter) EN:https://x.com/BlockFlow_News


