4 Valuation Studies: Is One Bitcoin Worth $200,000?
TechFlow Selected TechFlow Selected
4 Valuation Studies: Is One Bitcoin Worth $200,000?
Using 4 valuation methods to calculate Bitcoin's price yields vastly different results—so which one is more accurate?
Author: Viee, Core Contributor at Biteye
Editor: Crush, Core Contributor at Biteye
Recently, BTC has fluctuated and dropped to around $56,000. In contrast, in July, U.S. asset management firm VanEck predicted that by 2050, the price of BTC could reach $2.9 million—an astonishing figure indeed.
So what should be Bitcoin's fair value? Is it $0, $50,000, $1 million—or even higher? In this article, Biteye will explore four Bitcoin valuation methods to help you better understand Bitcoin’s intrinsic value comprehensively.
Bitcoin Valuation Methods
Traditional assets such as stocks and bonds have well-established and effective valuation models. However, assessing Bitcoin's value poses greater challenges, and currently no single method clearly outperforms the others. Below are four commonly used Bitcoin valuation approaches: the Production Cost Model, Stock-to-Flow (S2F) Model, Metcalfe's Law, and the AHR999 Hodling Indicator.
-
Production Cost Model: Mining consumes significant electricity and other resources, so mining costs can be seen as reflecting Bitcoin’s fundamental value.
-
Stock-to-Flow Model: A higher stock-to-flow ratio typically indicates greater scarcity, which may drive up prices.
-
Metcalfe's Law: This theory emphasizes that increases in network user count lead to exponential growth in value.
-
AHR999 Hodling Indicator: Created by Weibo user ahr999, this indicator helps Bitcoin dollar-cost averaging (DCA) investors make tactical investment decisions.
01 Production Cost Model
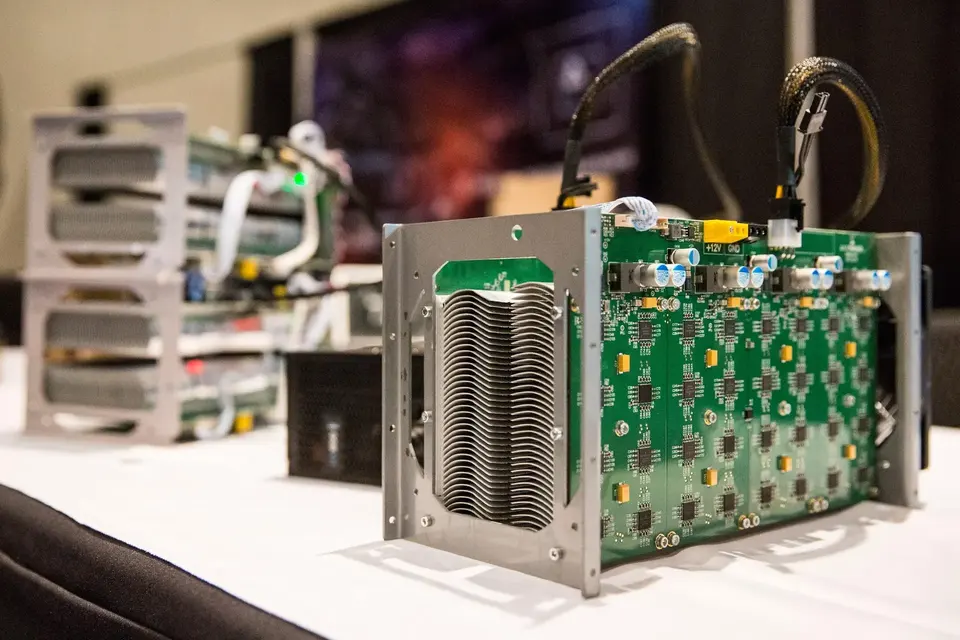
Unlike fiat currencies such as the euro or U.S. dollar, which are nearly cost-free to produce, Bitcoin is generated through a complex mining process. Therefore, Bitcoin’s production cost primarily refers to mining expenses.
In the long term, the cost of mining one Bitcoin tends to align closely with its market price. Mining cost can be viewed as a floor for Bitcoin’s price, as historically, Bitcoin’s price rarely stays below mining cost for extended periods. This phenomenon is partly due to the correlation between Bitcoin’s price and total computational power used for mining (i.e., hash rate), along with competitive dynamics in mining—less efficient miners are often forced to shut down. The chart below shows Bitcoin’s average mining cost:
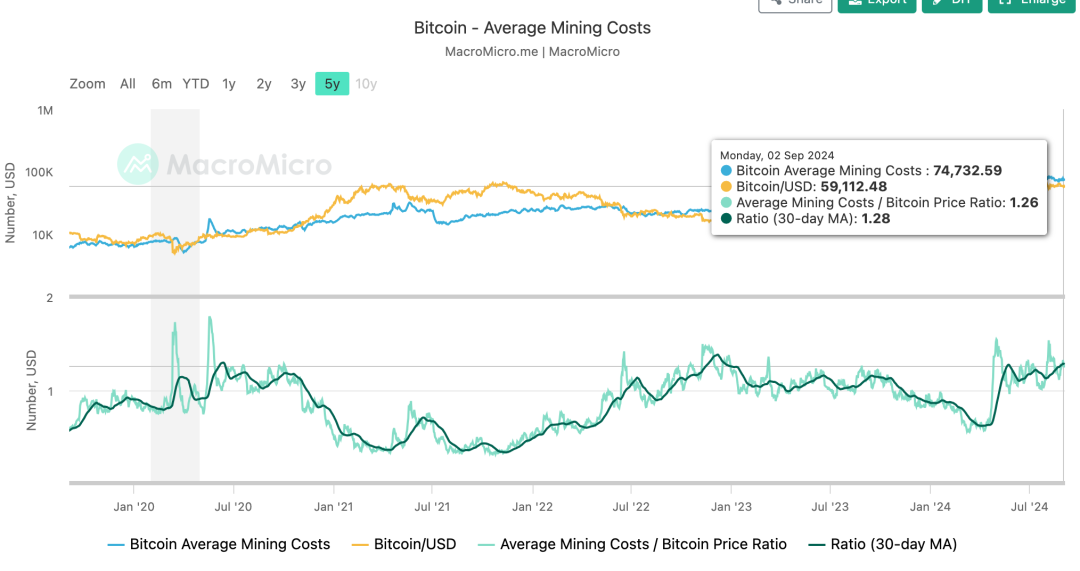
Data source: https://en.macromicro.me/charts/29435/bitcoin-production-total-cost
According to data from MacroMicro, as of September 2, 2024, the average cost to mine one Bitcoin is approximately $74,000—this represents Bitcoin’s current valuation based on the production cost model.
Since Bitcoin’s current price is below this mining cost (the valuation derived from the production cost model), one of two scenarios may unfold in the near future: either the number of miners decreases, or Bitcoin’s price rises above mining cost levels.
02 Stock-to-Flow Model
The Stock-to-Flow (S2F) model is a method often used to evaluate the value of commodities. Specifically, "stock" refers to the current total supply of an asset, while "flow" refers to the annual new supply.
A higher stock-to-flow ratio indicates greater scarcity because it would take longer to replenish the current stock at the current flow rate. For example, if an asset’s stock is 100 times its annual flow, it would take 100 years to reproduce the current stock. In contrast, if stock is only 10 times flow, the asset is less scarce, requiring just 10 years. Thus, the S2F model provides a simple yet effective way to measure scarcity—an important factor influencing price.
Bitcoin’s Stock-to-Flow Ratio
As of August 2024, the circulating supply of Bitcoin (stock) is approximately 19,750,000 BTC. With the current block reward at 3.125 BTC per block and a new block mined roughly every ten minutes, the annual issuance (flow) is about 164,359 BTC. Therefore, Bitcoin’s stock-to-flow ratio is:
19,750,000 / 164,359 ≈ 120.1
This ratio means that, at the current growth rate (flow), it would take approximately 120 years to reach the current circulating supply (stock).
Now consider gold—the world’s most important reserve asset. According to 2023 data from the World Gold Council, gold’s stock-to-flow ratio is:
209,000 / 3,500 ≈ 59.7
As mentioned earlier, a higher stock-to-flow ratio implies greater scarcity. Therefore, according to the S2F model, Bitcoin is about twice as scarce as gold!
However, in August 2024, gold’s total market capitalization was approximately $16.8 trillion, while Bitcoin’s was around $1.1 trillion—just one-sixteenth of gold’s.
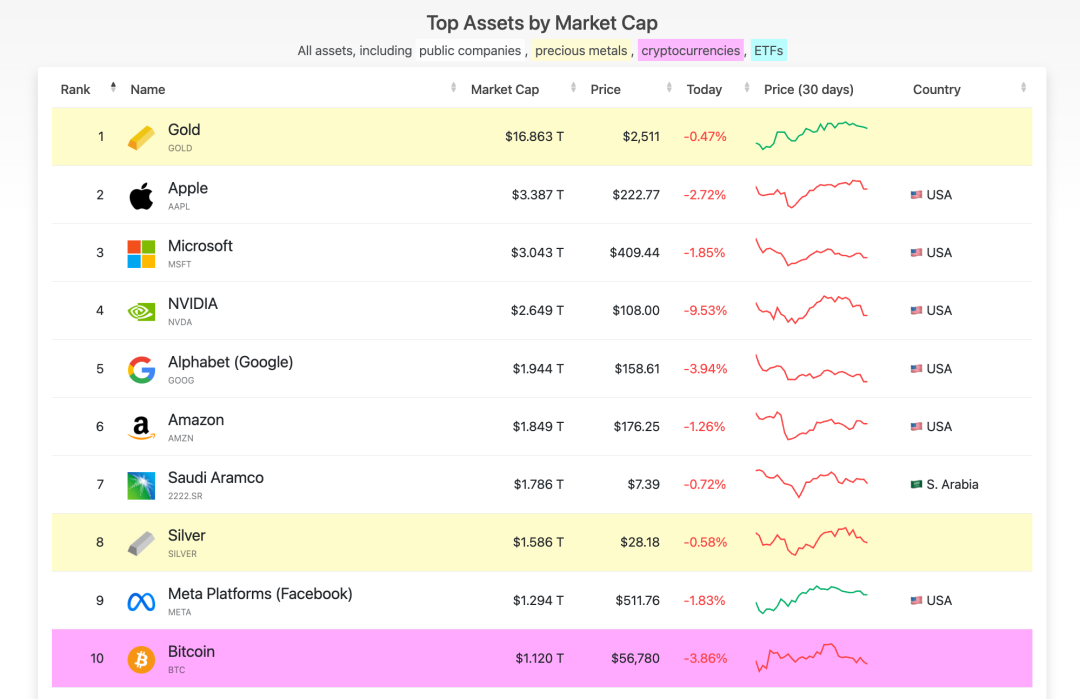
Data source: https://companiesmarketcap.com/assets-by-market-cap/
Thus, using the S2F model, if we assume Bitcoin’s scarcity translates directly into market cap and assign it twice that of gold, Bitcoin’s market cap would reach $33.6 trillion. This would imply a Bitcoin valuation of a staggering $1.708 million—30.5 times its current price.
Of course, this calculation lacks solid grounding, as scarcity cannot be perfectly quantified. Alternatively, we can refer to the “Real-Time Bitcoin Stock-to-Flow Chart,” which offers more refined estimations. In the chart below, the yellow line represents the model’s predicted Bitcoin price, while the colored lines show actual market prices. Note that since 2022, the model has increasingly diverged from reality, with predicted prices consistently exceeding actual prices—so use it with caution.
According to the Real-Time Bitcoin Stock-to-Flow Chart, Bitcoin’s current valuation should be $210,000.
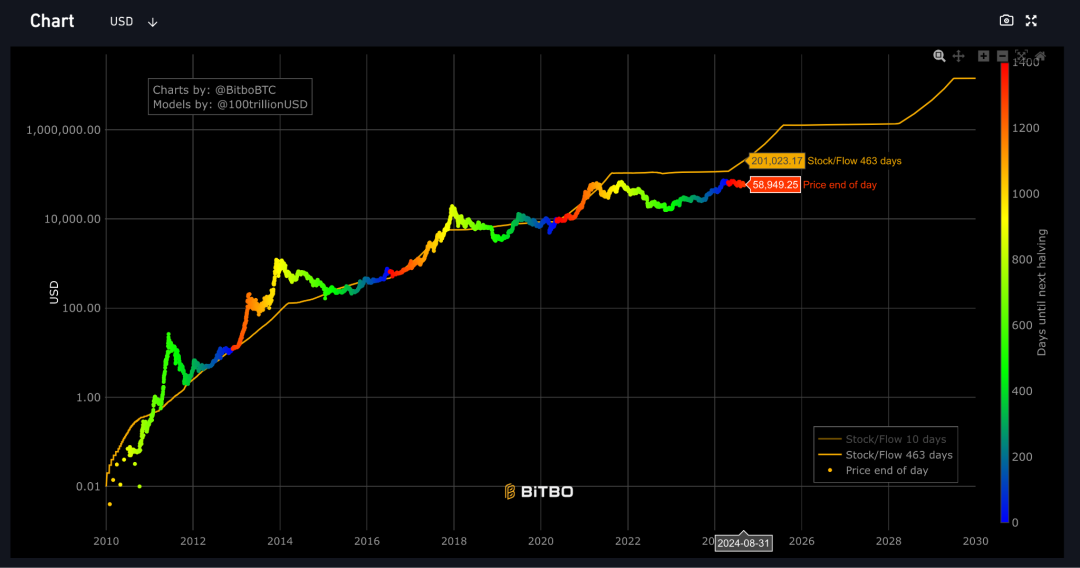
Data source: https://charts.bitbo.io/stock-to-flow/
03 Metcalfe's Law
Metcalfe’s Law is primarily used to assess the value of communication networks but also applies to blockchain technologies like Bitcoin.
According to this theory, the more users a network has, the greater its attractiveness and value—and network value scales proportionally to the square of the number of users. For instance, if a network has 10 users, its value is proportional to 10 × 10 = 100. If user count grows to 20, value increases to 20 × 20 = 400. This shows that network value grows exponentially—not linearly—with each new user.
As of September 4, 2024, the number of Bitcoin addresses has doubled over the past five years—from about 26 million to 54 million, a 2.076-fold increase. According to Metcalfe’s Law, Bitcoin’s market cap should grow in proportion to the square of user growth. Hence, its market cap should now be 4.3 times higher than five years ago, implying a Bitcoin valuation of approximately $41,000.
04 AHR999 Hodling Indicator
This indicator reflects both short-term DCA returns and the degree to which Bitcoin’s price deviates from its expected valuation.
-
When the ahr999 index < 0.45: it signals a buying opportunity (bottom picking);
-
When ahr999 is between 0.45 and 1.2: suitable for regular DCA;
-
When ahr999 > 1.2: the price is relatively high, not ideal for action.
Over the long term, Bitcoin’s price shows a certain positive correlation with block height. By leveraging the benefits of DCA, users can control their average purchase cost, keeping it mostly below Bitcoin’s market price.
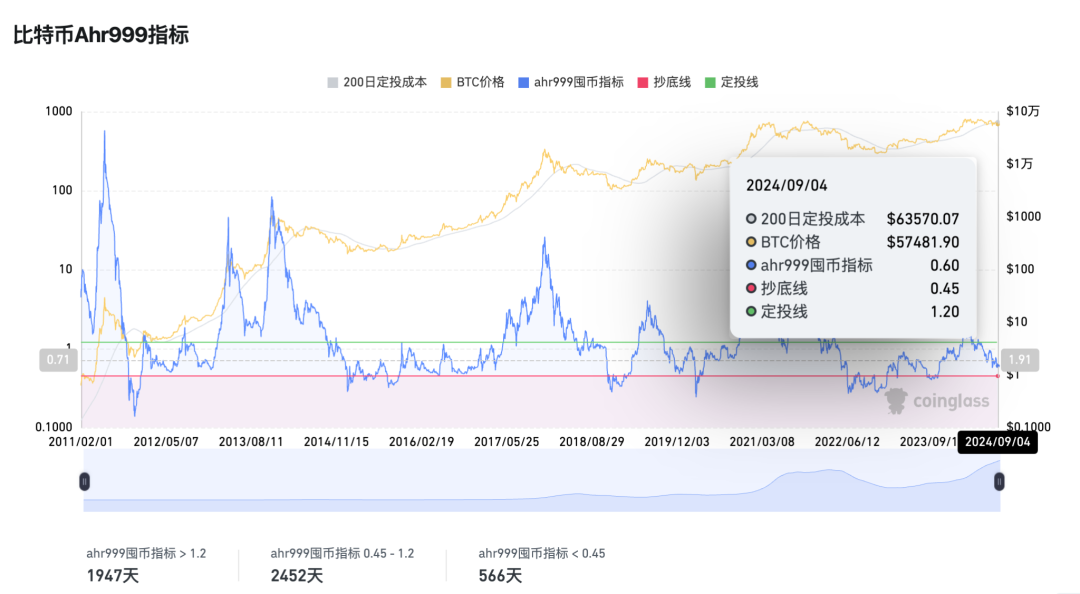
AHR999 Indicator = (Bitcoin Price / 200-Day DCA Cost) × (Bitcoin Price / Exponential Growth Valuation)
Using Bitcoin’s price of $57,481.9 on September 4:
0.6 = (57,481.9 / 63,570.07) × (57,481.9 / Exponential Growth Valuation)
Solving this gives an exponential growth valuation of $86,628 for BTC.
Although this exponential growth valuation changes daily, it is clear that Bitcoin’s implied value is currently well above $80,000.
05 Summary
Each of these valuation methods has its strengths and contributes to a more comprehensive understanding of Bitcoin’s value. However, Bitcoin’s ultimate price trajectory must be observed and verified over time—use these models cautiously as investment guidance.
Join TechFlow official community to stay tuned
Telegram:https://t.me/TechFlowDaily
X (Twitter):https://x.com/TechFlowPost
X (Twitter) EN:https://x.com/BlockFlow_News