Eternal Consolidation Period: Has the Historical Pattern of Sideways Markets After Halving Become a Thing of the Past? Will This Time Be Different?
TechFlow Selected TechFlow Selected
Eternal Consolidation Period: Has the Historical Pattern of Sideways Markets After Halving Become a Thing of the Past? Will This Time Be Different?
Patience remains at the core of the game.
Author: Flossy
Translation: TechFlow
Introduction
After completing Bitcoin's fourth halving in April 2024, the market is entering a particularly intriguing phase. This cycle presents unique analytical challenges, with new factors such as ETF approvals influencing traditional post-halving patterns.
In this article, we will review historical data from previous halvings, assess current market conditions, and explore an idea of mine—a potentially defining long-term consolidation phase for this cycle. While I'm not claiming this idea is entirely novel, it's interesting that I've seen little discussion around this viewpoint recently. When I bring it up, the common response is "this cycle is different."
Bitcoin Halving: History Doesn't Repeat Itself Exactly, But It Rhymes
First, let’s talk about the main character in this narrative: the Bitcoin halving. We just completed the fourth halving on April 19, 2024. Here's a recap of past halvings and what followed:
-
November 28, 2012: Block reward reduced to 25 BTC
-
July 9, 2016: Reduced to 12.5 BTC
-
May 11, 2020: Cut to 6.25 BTC
-
April 19, 2024: Now down to 3.125 BTC
Now, things are getting more fascinating. Let's examine price movements following previous halvings:
First Halving – November 28, 2012
-
Price at halving: ~$12
-
Consolidation period: Approximately 1 year
-
Price at end of consolidation: ~$100
-
Subsequent bull market peak: ~$1,100 (November 2013)
-
Percentage gain from halving to peak: ~9,000%
Second Halving – July 9, 2016
-
Price at halving: ~$650
-
Consolidation period: ~0.5–1.5 years (depending on how you define the bull run)
-
Price at end of consolidation: ~$1,000
-
Subsequent bull market peak: ~$19,700 (December 2017)
-
Percentage gain from halving to peak: ~2,930%
Third Halving – May 11, 2020
-
Price at halving: ~$8,600
-
Consolidation period: ~6 months
-
Price at end of consolidation: ~$10,000
-
Subsequent bull market peak: ~$69,000 (November 2021)
-
Percentage gain from halving to peak: ~702%
Current Halving – April 19, 2024
-
Price at halving: ~$64,000
-
Consolidation period so far: 5 months
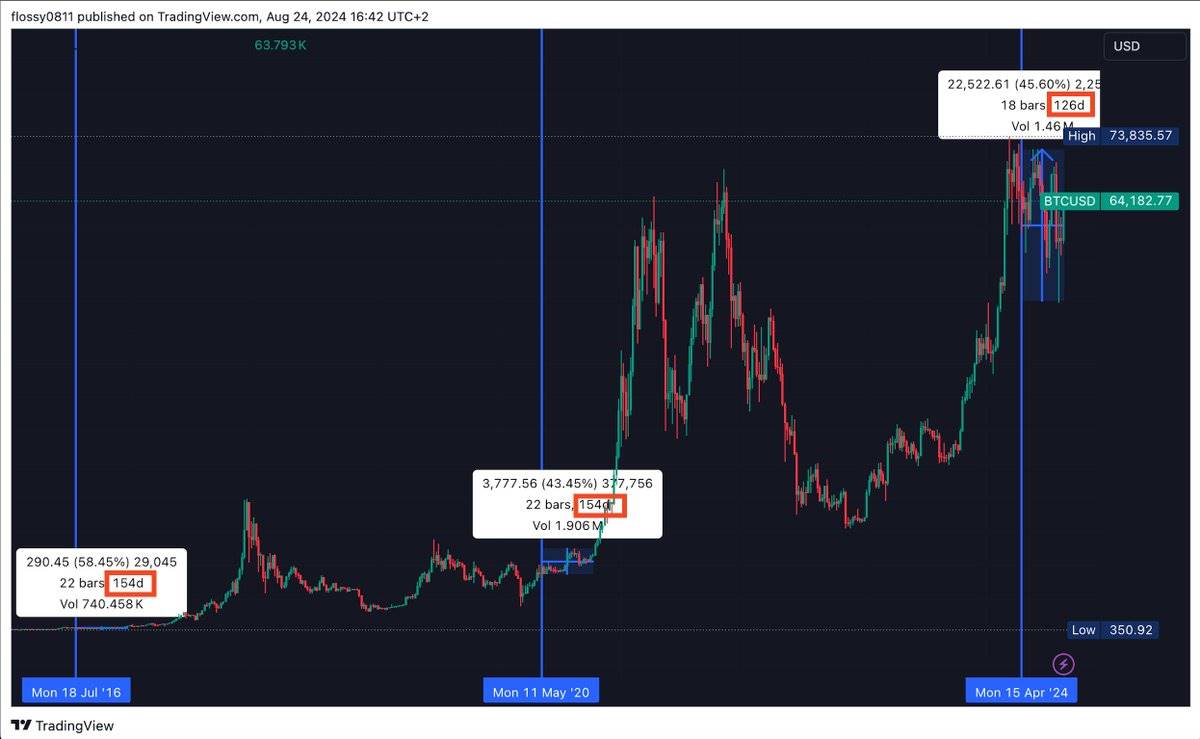
The Great Consolidation Theory: We Are In It
This is where my theory comes in. Because exactly what we’re seeing now is a sideways price movement—a pattern psychologically challenging for many investors.
Looking at the numbers, the pattern seems clear:
-
Initial rally: We typically see a price rise leading into the halving.
-
The Great Consolidation: After the halving, we enter a roughly 6-month consolidation phase.
-
Breakout: Following consolidation, the real bull run begins, pushing prices to new all-time highs.
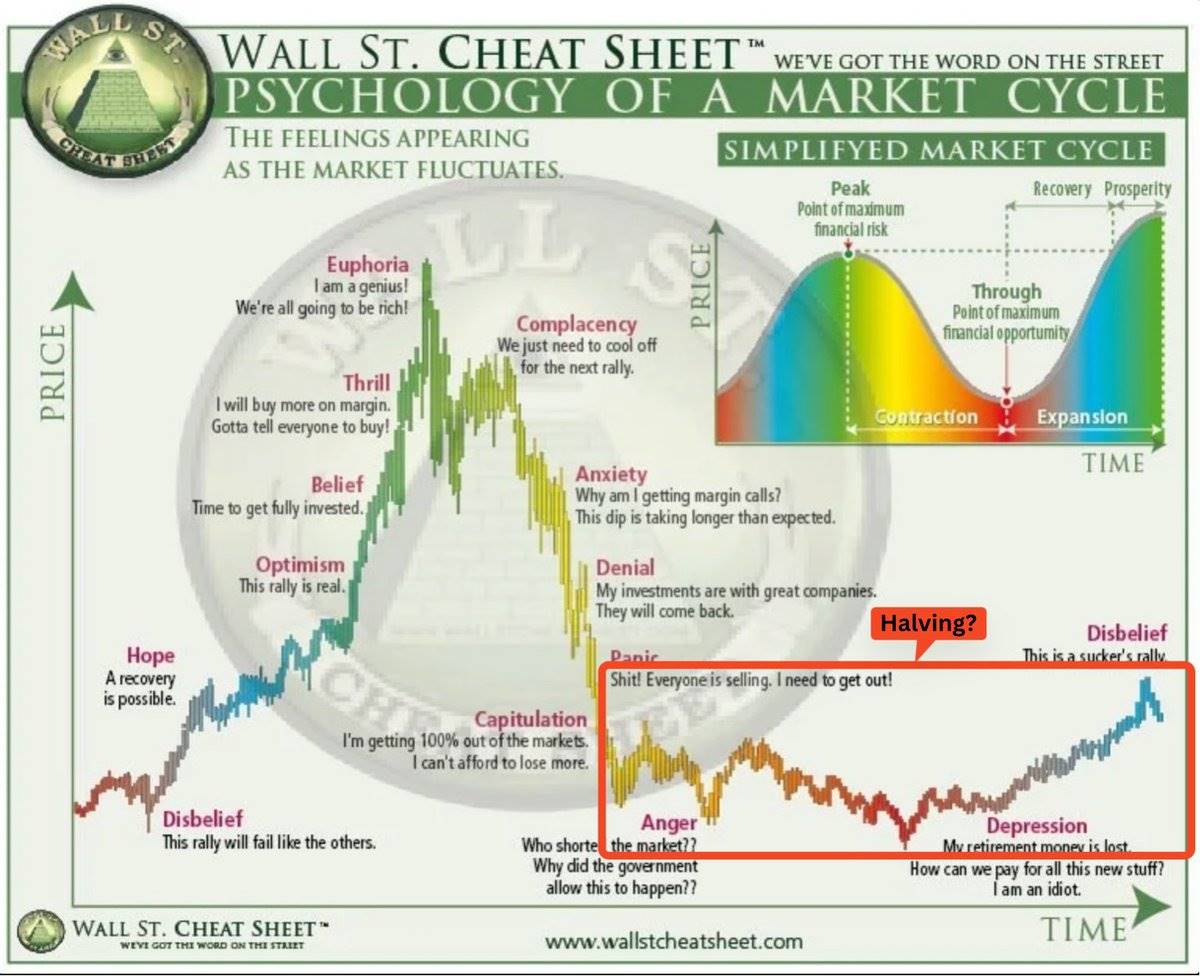
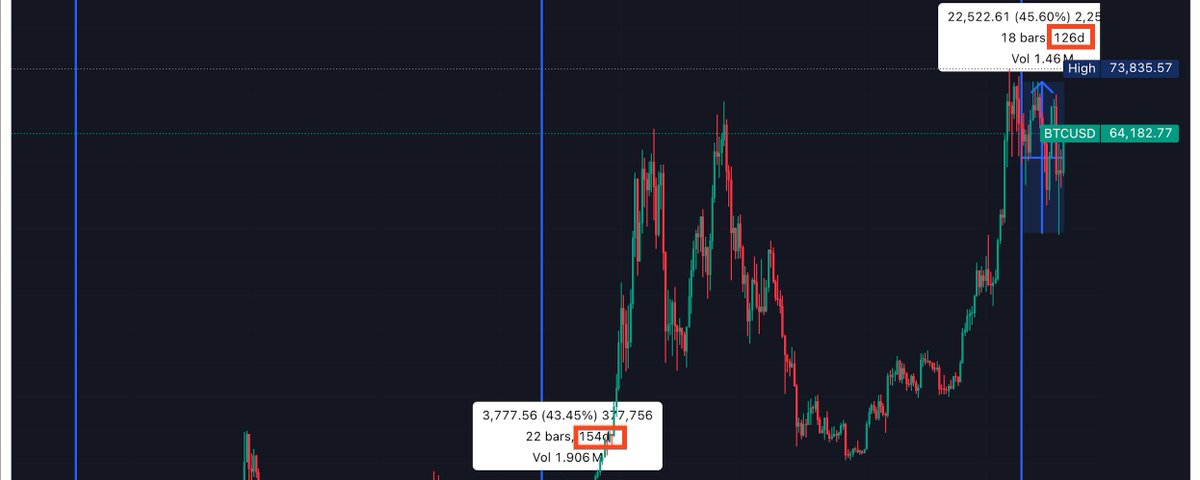
Figure: Could this be our current state?
This Halving Cycle: Similar Yet Different
Now you might say, “Wait, didn’t we hit an all-time high before this halving?” You're absolutely right. The January 2024 ETF approval altered the typical post-halving market dynamic, causing prices to surge prematurely.
The ETF Effect: New Market Dynamics
The approval and launch of spot Bitcoin and Ethereum ETFs have introduced new dynamics into the crypto market. Let's analyze them:
1. Bitcoin ETF Approval (January 2024): This led to significant increases in price and trading volume. We saw Bitcoin reach a new all-time high before the halving—something unprecedented in prior cycles.
2. Ethereum ETF Approval (May 2024): Following Bitcoin, Ethereum ETFs were also approved and launched. This brought renewed institutional interest and arguably more capital inflow into the broader crypto space.
While these developments have injected new liquidity and attention into the market, they don’t necessarily invalidate underlying cyclical patterns. The “consolidation phase” may still be playing out—but under new scales and variables.
Data-Supported Consolidation: More Than Just a Theory
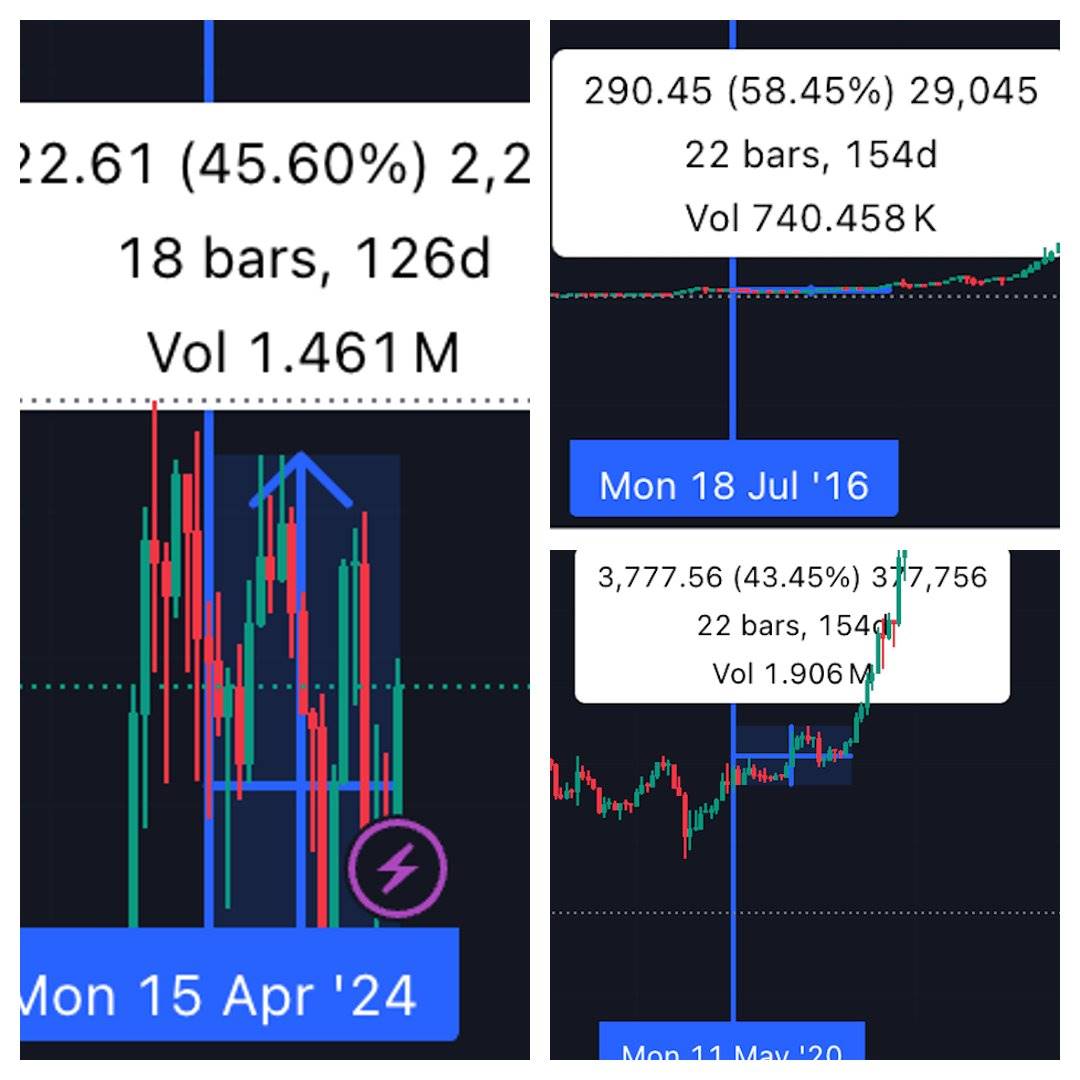
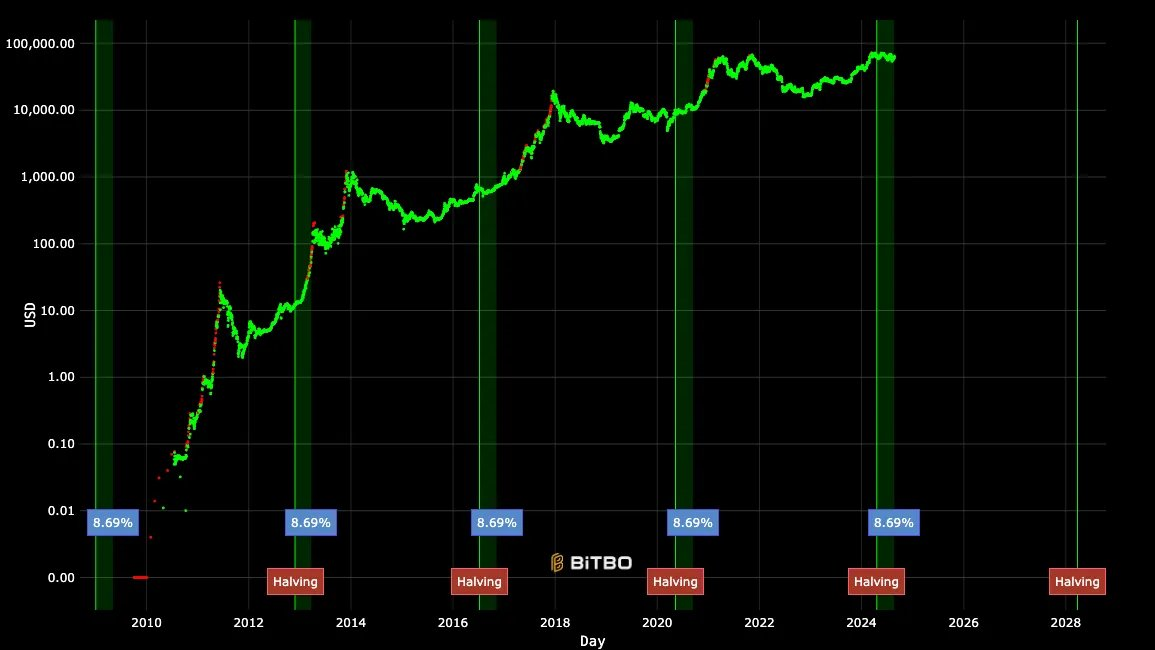
Figure: Timeframes and ranges of previous halvings
Even amid the pre-halving rally, signs of consolidation remain visible:
1. Declining Volatility: Despite higher prices, Bitcoin’s volatility has been decreasing since the halving.
2. Trading Range: Since the halving, price action has remained within a relatively narrow range—classic consolidation behavior with approximately ±25% swings.
3. Declining Volume: Overall trading volume has trended downward, another hallmark of a consolidation market.
Origin of the Theory
It’s important to note this isn’t a theory I pulled out of thin air. I’ve been sharing elements of this view on my Telegram channel for some time now. As early as April 9—just before the halving—I began discussing these ideas. Those initial posts touched on the core concepts behind the theory: recognizing the importance of post-halving market patterns, the danger of overreacting to short-term volatility, and the value of accumulation during these phases.
Institutional Accumulation: A New Player in the Game
Now, this cycle becomes even more interesting. We have a new participant: institutional investors entering via ETFs. These aren't typical retail traders prone to buying high and selling low. Their moves are slow and steady—they accumulate during consolidation.
ETF data shows consistent inflows even during periods of price stagnation. This is institutional accumulation in action, and it's changing the game.
What This Means for the Current Cycle
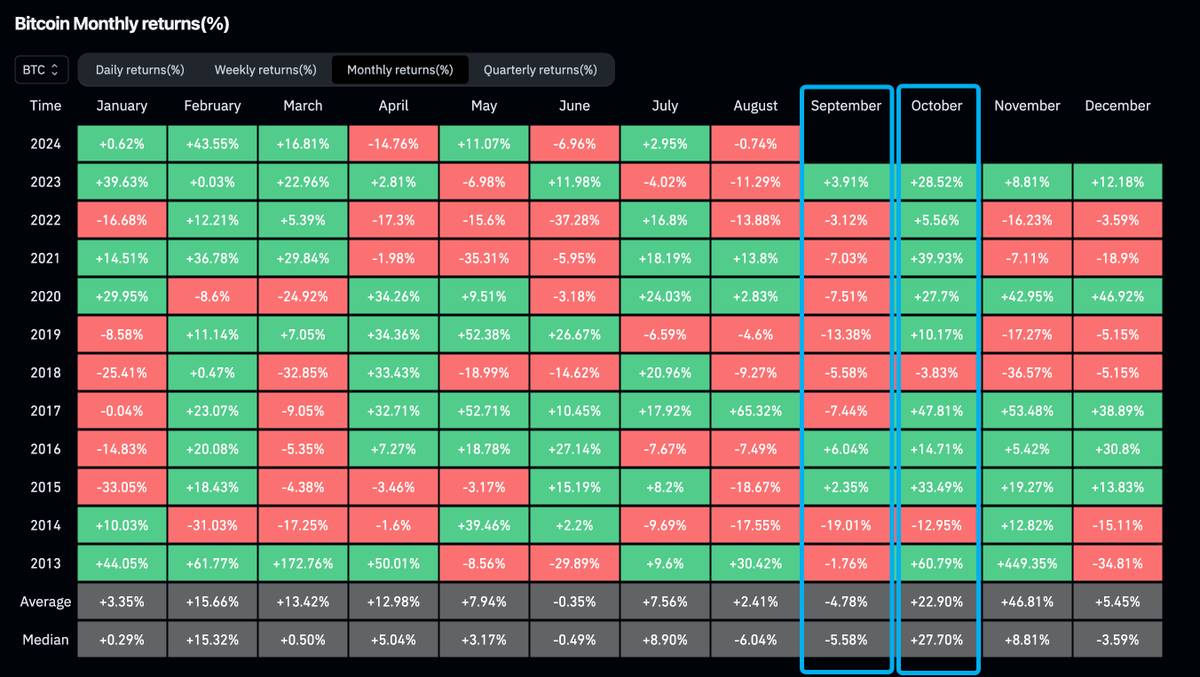
Figure: Historical monthly price performance (Bitcoin)
Based on historical data and current market conditions, here’s what we might expect:
1. Accumulation Phase: Smart money—institutions via ETFs, whales, and savvy retail investors—is likely continuing to accumulate during this phase.
2. Potential Breakout Timeline: If historical patterns hold (as they often do in crypto), we could see the real bull run ignite in Q4 2024 or Q1 2025.
3. Short-Term Seasonal Pattern: Historical data strongly supports the idea that we’re approaching a pivotal moment. Consider Bitcoin’s monthly returns over the past decade:
The September-October performance contrast aligns almost perfectly with the typical transition from a post-halving “consolidation/bearish” phase to a full-blown bull market. If this pattern holds this year, we may see the current consolidation end in September, followed by a significant rally in October.
-
September averages -4.78% return, median -5.58%, making it historically one of the worst-performing months.
-
October averages +22.90% return, median +27.70%, consistently ranking among the best-performing months.
Pattern Consistency: Particularly striking is the consistency of this pattern. In the data shown, October delivered positive returns in 9 out of 12 years, with some years seeing massive gains (e.g., +60.79% in 2013 and +39.93% in 2021). This reliability adds credibility to the argument that a potential market shift may be near.
Conclusion: Patience Remains the Name of the Game
Past halvings
The data doesn’t lie. Every halving cycle has had its consolidation phase—and there’s no reason to believe this one will be different. Yes, ETFs add a new layer, but the fundamental market dynamics remain unchanged.
So what should a smart crypto participant like you do? Simple:
-
Accumulate: Use this consolidation phase to build your position (but never invest more than you can afford to lose).
-
Stay Patient: Remember, the biggest gains go to those who can wait.
Patience isn’t just a virtue in crypto—it’s a powerful weapon. While others grow frustrated with sideways price action, you’ll be accumulating, knowing the real move hasn’t started yet.
That said, I’m just another internet user. This is not financial advice. Always do your own research and manage your risk.
Join TechFlow official community to stay tuned
Telegram:https://t.me/TechFlowDaily
X (Twitter):https://x.com/TechFlowPost
X (Twitter) EN:https://x.com/BlockFlow_News