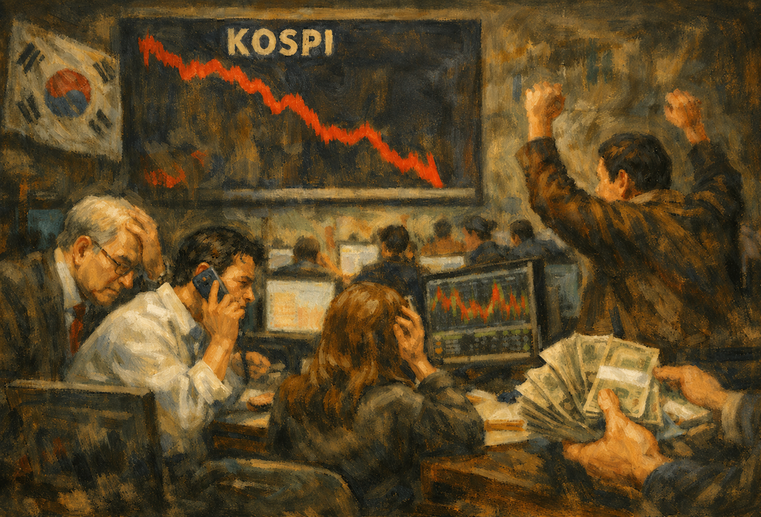
Can the barbell strategy make money in this bull market?
TechFlow Selected TechFlow Selected
Can the barbell strategy make money in this bull market?
Risk is only meaningful when the majority of your capital is very safe.
 Navigating Web3 tides with focused insights
Author: Viee, Core Contributor of Biteye
Editor: Crush, Core Contributor of Biteye
Community: @BiteyeCN
Can the barbell strategy make money in this bull market?
Today I want to share a strategy that can help you earn big returns while avoiding total losses: the barbell strategy.
👇 We analyze the performance of the following crypto assets through key indicators:
-
BTC remains king: BTC.D Index
-
ETH lags behind BTC in this phase: ETH/BTC exchange rate
-
Altcoins overall sluggish: (1) Altseason Index (2) Altcoin Market Cap
-
Meme coins bring high risk and high reward, outperforming BTC and ETH: Memecoin Index
01 What is the Barbell Strategy?
The barbell strategy, mentioned by Nassim Taleb in his book "Antifragile," involves adopting a conservative approach in one domain while embracing an aggressive, open strategy in another—avoiding the middle ground. In simple terms: "mostly safe, slightly risky."
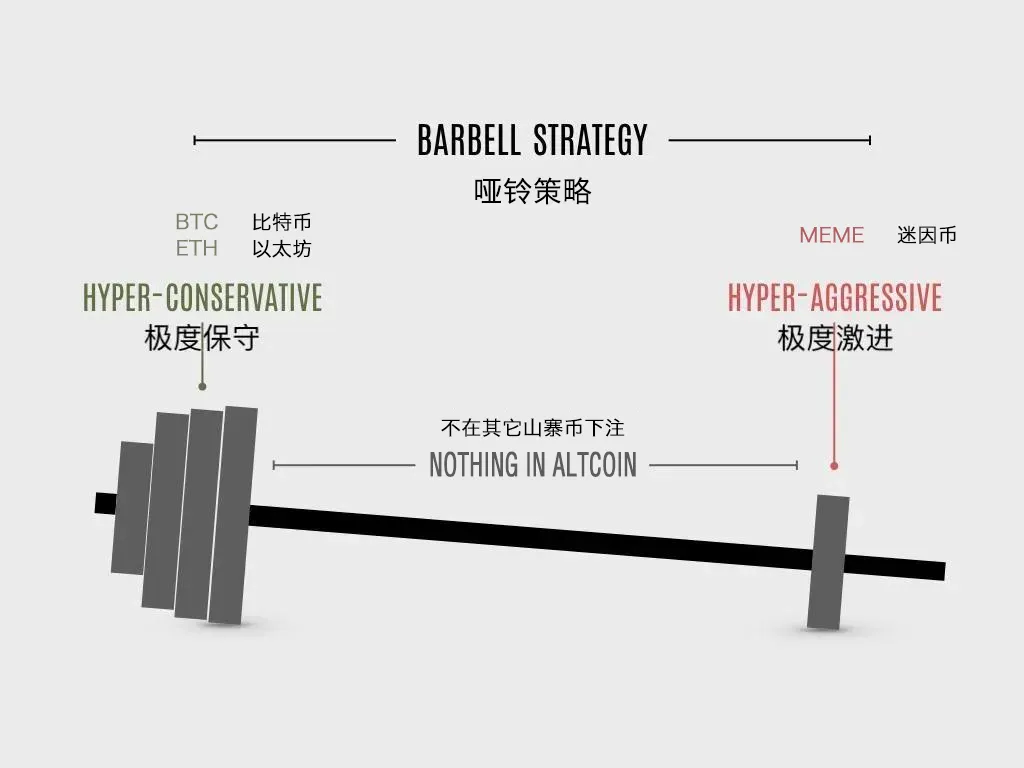
Applied to crypto, this means allocating most of your capital to safer assets like BTC and ETH, while dedicating a small portion to high-risk assets like meme coins—minimizing exposure to mid-tier altcoins.
This way, you maintain stability and preserve capital during volatile markets, while still having the chance to achieve outsized gains from high-risk bets (e.g., meme coins).
Next, let's objectively examine the current performance of BTC, ETH, mainstream altcoins, and meme coins using key metrics.
02 BTC Remains King: Refer to BTC.D Index (Bitcoin Dominance)
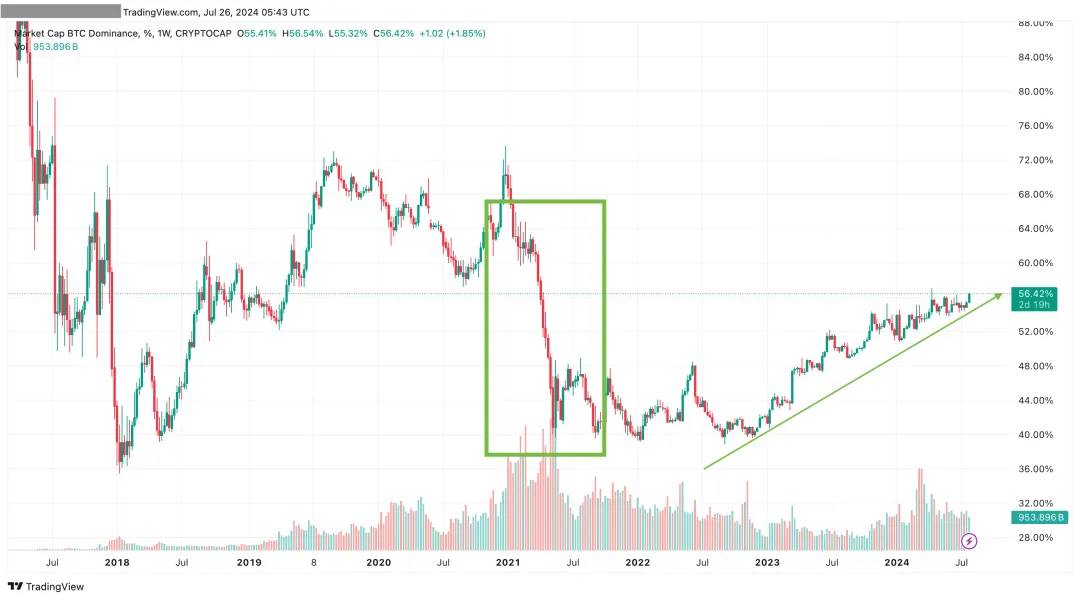
The Bitcoin Dominance (BTC.D) index reflects Bitcoin’s market cap share and is often used to gauge whether an altseason is beginning. In the previous bull run of 2021, the BTC.D index clearly declined during the altseason.
The logic is straightforward: A falling BTC.D index ➡️ Declining dominance of BTC ➡️ Rising risk appetite ➡️ Altcoins regain market attention ➡️ Altcoins surge (and vice versa).
Currently, we are still in a "Bitcoin season." The index has been rising since the beginning of the year, reaching 56% as of July 26. Altcoins continue to underperform compared to Bitcoin, confirming BTC's dominant position.
03 ETH Lags Behind BTC in This Phase: Refer to ETH/BTC Exchange Rate
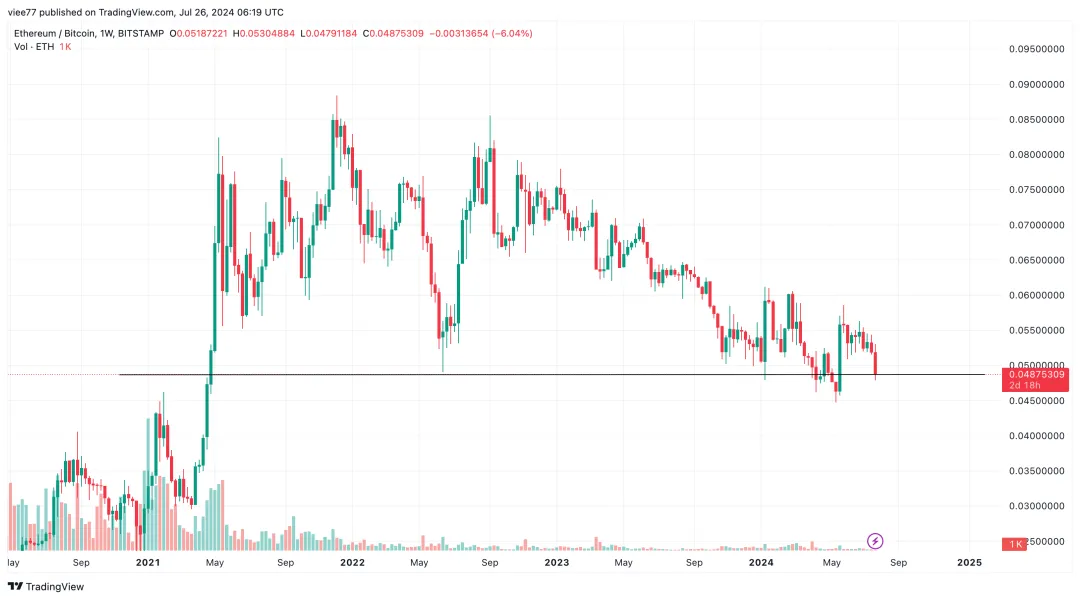
Generally, a higher ETH/BTC ratio indicates stronger ETH performance relative to BTC. Conversely, a lower ratio suggests weaker performance.
Additionally, this metric can signal market interest in altcoins. If ETH starts outperforming BTC, it may indicate capital beginning to flow into altcoins.
Currently, the ETH/BTC ratio remains relatively low, indicating weak ETH performance—even approval of a spot ETF hasn't reversed its downtrend. However, given its current low level, investors with strong conviction in ETH might consider building positions gradually, anticipating future upside.
04 Altcoins Remain Weak: Refer to (1) Altseason Index
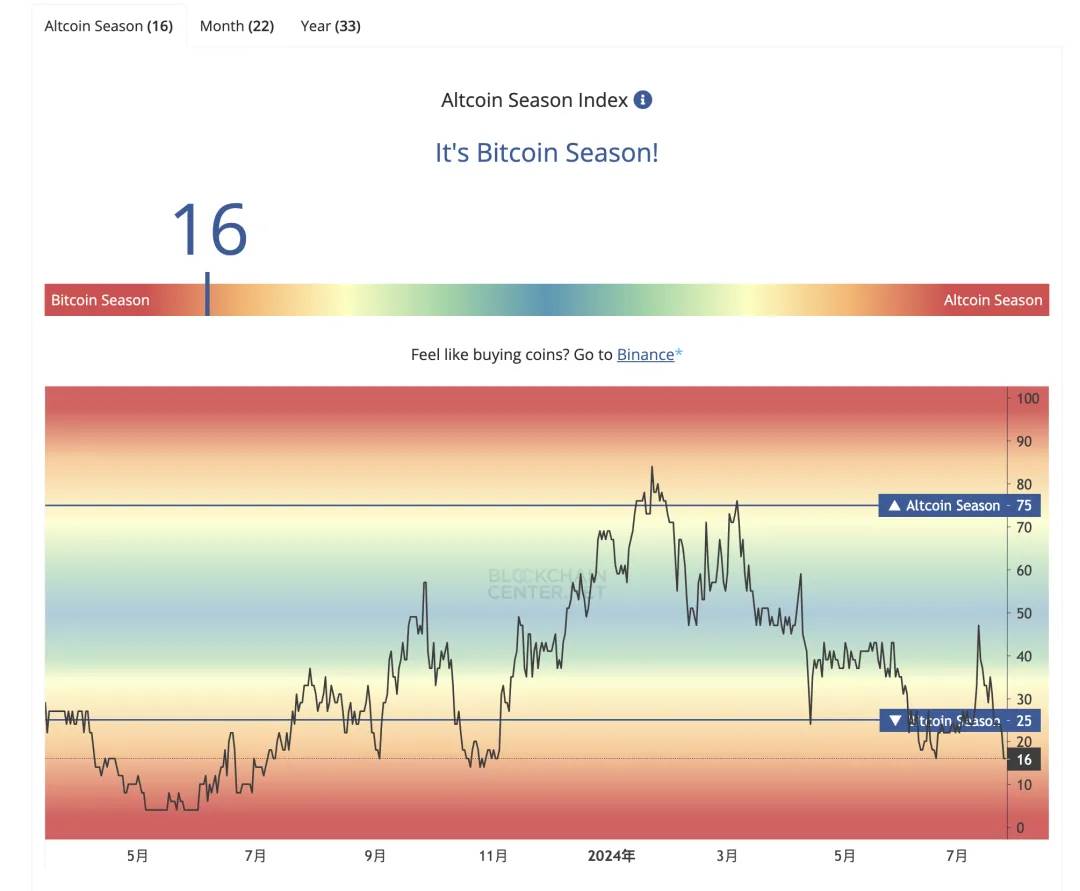
The Altseason Index measures market sentiment toward altcoins by tracking the percentage of top 50 altcoins outperforming Bitcoin over a given period. A reading above 75 signals altseason; below 25 indicates Bitcoin season.
Clearly, we're still in a Bitcoin season—the index stands at 16, indicating weak momentum for alts. So far this year, the index only exceeded 75 briefly in late January, lasting just half a month. Compared to the sustained altseason from March to June 2021 (over three months), this doesn’t qualify as a true altseason.
05 Altcoins Remain Weak: Refer to (2) Altcoin Market Capitalization
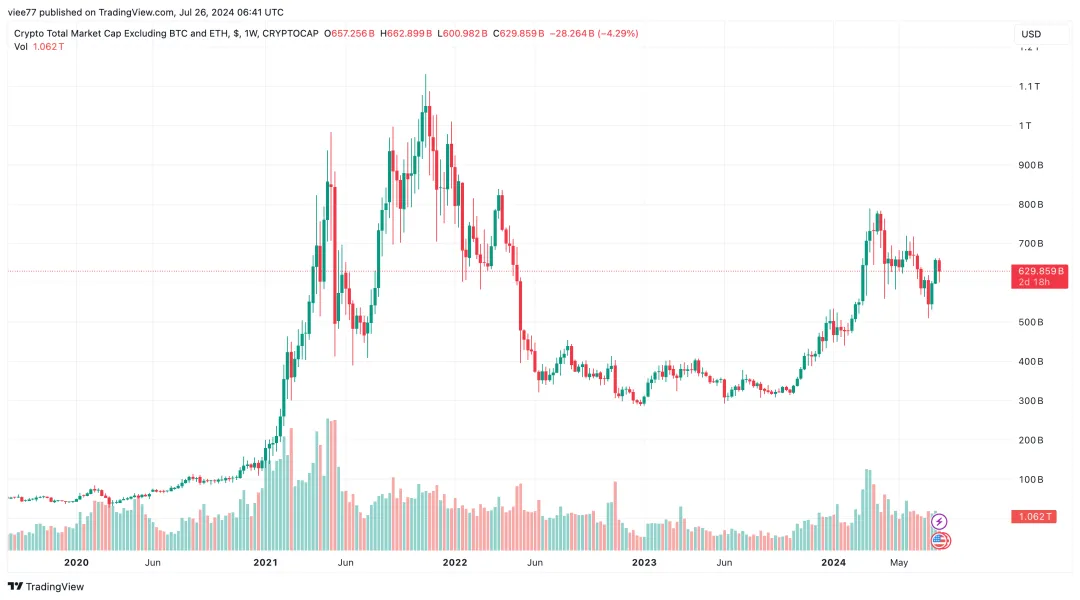
This metric, formally known as "Crypto Total Market Cap Excluding BTC & ETH," tracks the total market cap of all cryptocurrencies except BTC and ETH, reflecting overall capital inflow into the altcoin market.
After a notable rise early in the year, the altcoin market cap failed to sustain upward momentum. It has since fluctuated within a range amid choppy market conditions, showing no clear breakout signal—confirming that altcoins remain generally weak.
06 Meme Coins Deliver High Risk, High Reward—Outperforming BTC and ETH: Refer to Memecoin Index
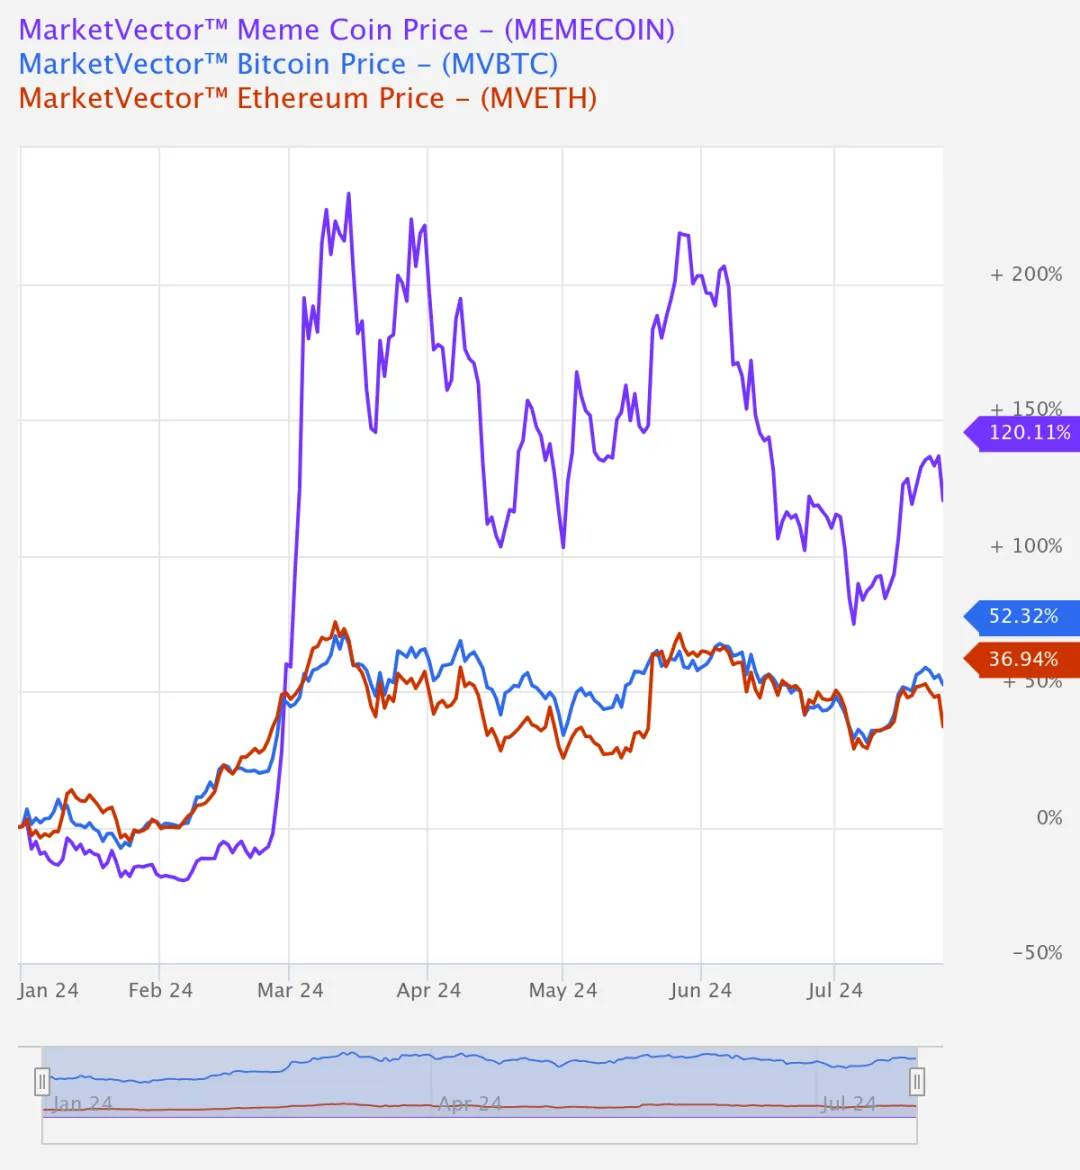
The MarketVector Meme Coin Index tracks the return performance of the six largest meme coins by market cap.
Key components include $DOGE, $SHIB, $PEPE, $FLOKI, $WIF, and $BONK—representing the overall meme coin sector.
As shown in the chart, meme coins have delivered outstanding performance year-to-date, surging 120%—significantly outpacing BTC’s 52% and ETH’s 37% gains.
07 Summary & Risk Warning
Applying the barbell strategy, the above indicators show that BTC and ETH are indeed the safest assets in the current market, with high market dominance.
In particular, BTC appears even stronger than ETH. From a return perspective, meme coins remain the prime example of high-risk, high-reward assets. Meanwhile, most altcoins remain sluggish, offering limited opportunities—so allocating minimal capital here is acceptable.
That said, asset allocation in crypto is highly complex—it's not as simple as relying on a few indicators.
Above all, remember: taking risks only makes sense when the majority of your capital is secure. Anyone who’s lived through multiple market cycles knows this well. As the old saying goes: "Preserve the green hills, and there will always be firewood."
Join TechFlow official community to stay tuned
Telegram:https://t.me/TechFlowDaily
X (Twitter):https://x.com/TechFlowPost
X (Twitter) EN:https://x.com/BlockFlow_News
 @BiteyeCN