Opinion: Analyzing the Future Price Trends of 8 Tokens in the AI Sector from Short-term and Long-term Perspectives
TechFlow Selected TechFlow Selected
Opinion: Analyzing the Future Price Trends of 8 Tokens in the AI Sector from Short-term and Long-term Perspectives
Artificial intelligence has become the dominant narrative in the bull market. In the long run, how much growth potential do related concept projects have?
 Navigating Web3 tides with focused insights
Author: Our Crypto Talk, crypto KOL
Translation: Felix, PANews
Altcoins are surging, and artificial intelligence is set to become the dominant narrative of the bull market. In the long run, can these projects deliver 100x returns? Crypto KOL @ourcryptotalk walks you through finding the answers from both short-term and long-term perspectives.
The Render Network (RNDR)
Short-Term Analysis
-
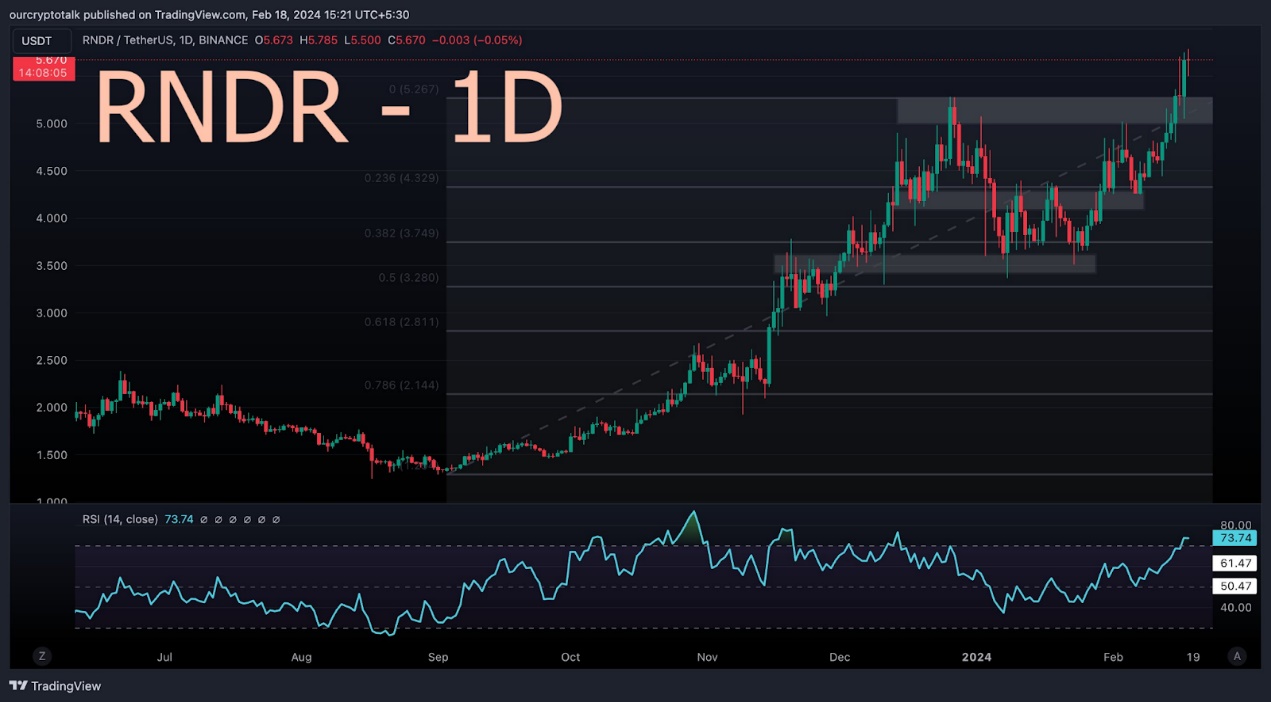
RNDR has broken above the long-standing resistance level of $5 and is approaching $6
-
Even if AI enthusiasm cools down and RNDR pauses here, it may still hold above $5. This would be a good buying zone for RNDR
Long-Term Analysis
-
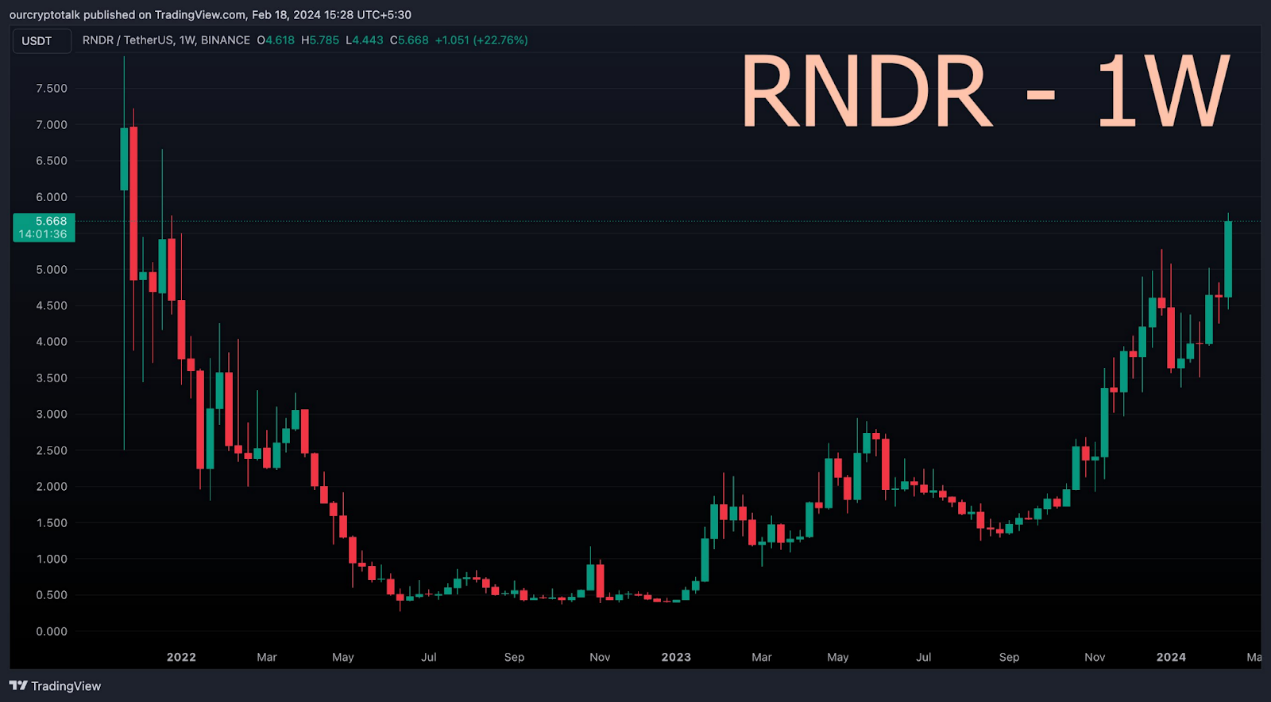
RNDR launched at the peak of the previous bull market and subsequently entered a downtrend
-
For over a year, RNDR's price action has consistently formed higher highs (HH) and higher lows (HL), which is encouraging
-
Its all-time high (ATH) should be surpassed within the next 2-3 months, reaching $20 by the end of 2024
OpenTensor (TAO)
Short-Term Analysis
-
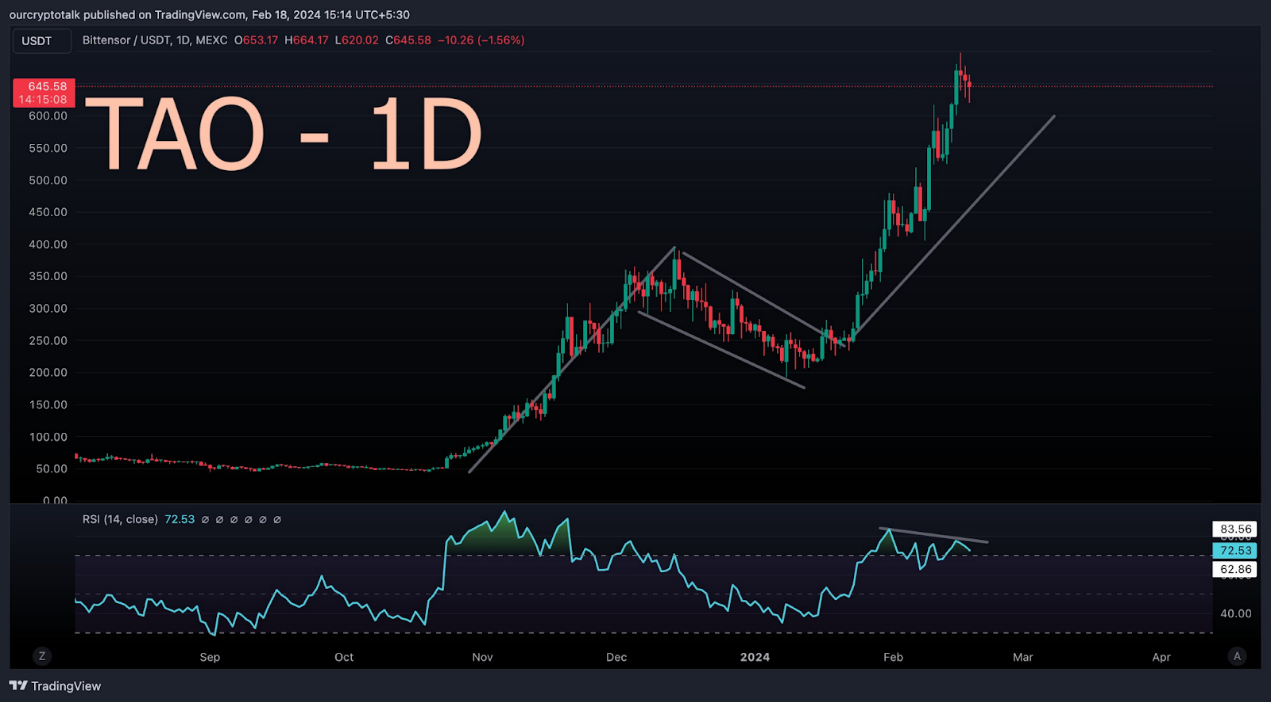
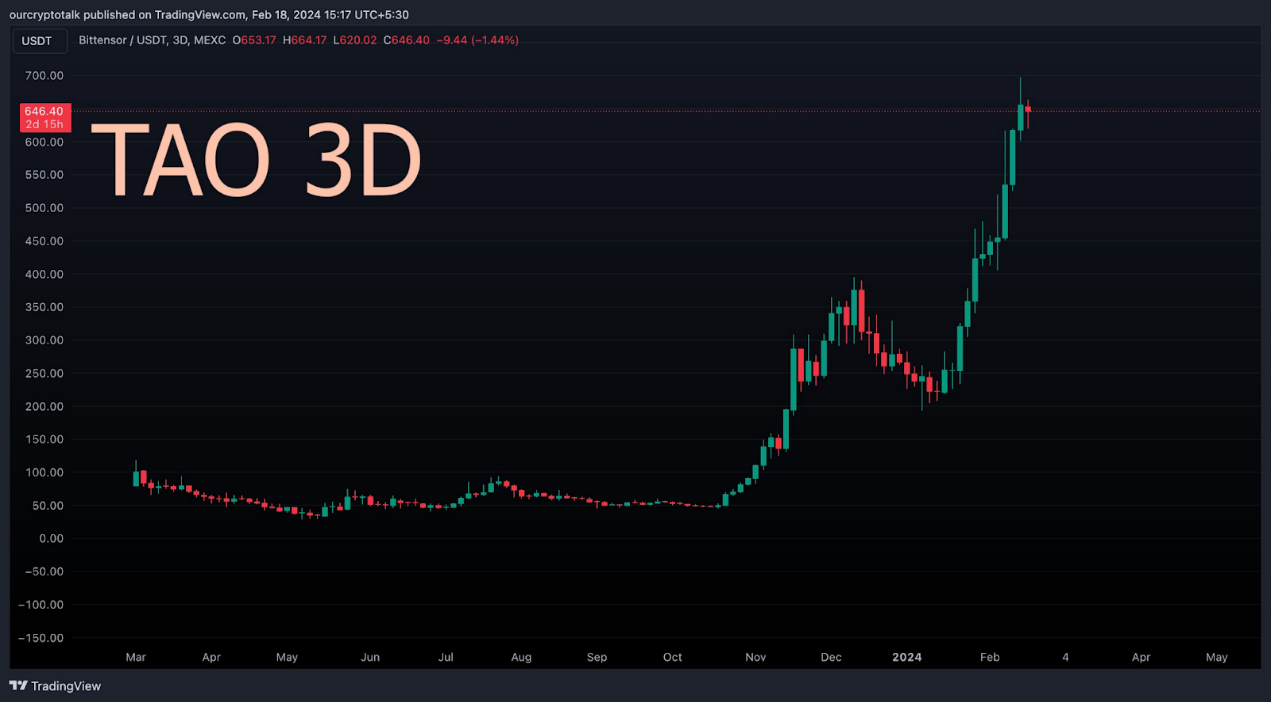
TAO's price rise is supported by a bullish flag pattern, whose target was $620—now already surpassed
-
Bearish divergence suggests several more days of consolidation are needed before the next upward move
Long-Term Analysis
-
Throughout 2023, TAO focused on development, with its price trajectory shown in the chart below
-
It broke out of the $30–$100 range and achieved new highs
-
Given that the AI sector remains far below its peak levels, TAO’s long-term target should be between $1,500 and $2,000
Injective (INJ)
Short-Term Analysis
-
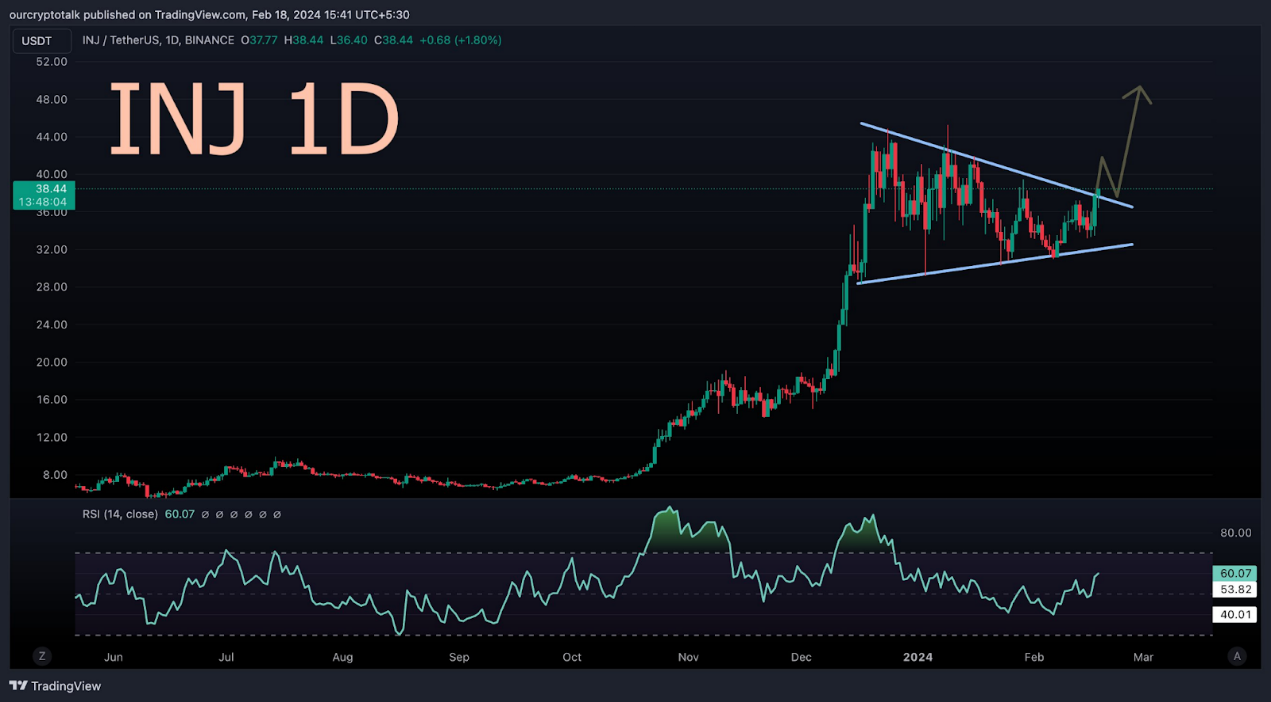
Since hitting its ATH, INJ has been forming a seemingly bullish symmetrical triangle, now breaking upwards
-
The upside price target is $50, which would push INJ to a new ATH
Long-Term Analysis
-
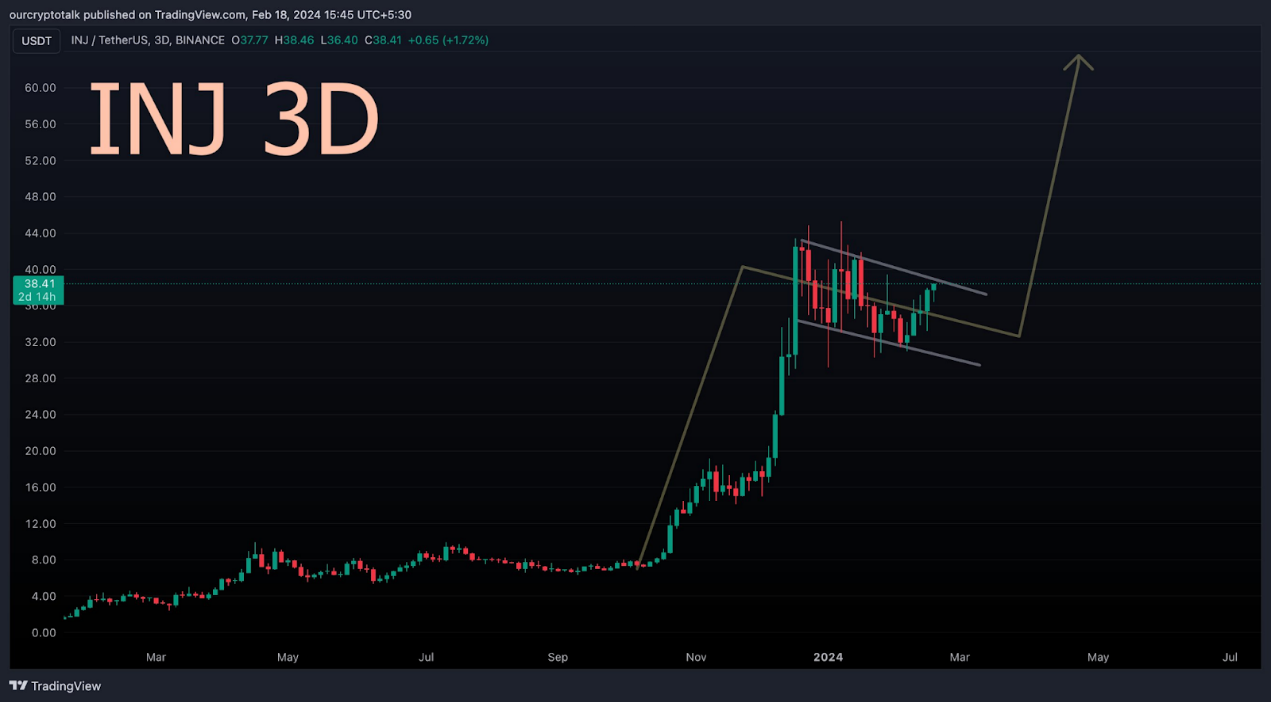
In the long term, INJ could potentially follow SOL’s trajectory from the last bull cycle
-
The bullish flag pattern suggests a target beyond $100, which should be easily reached and exceeded by the end of 2024
Verasity (VRA)
Short-Term Analysis
-
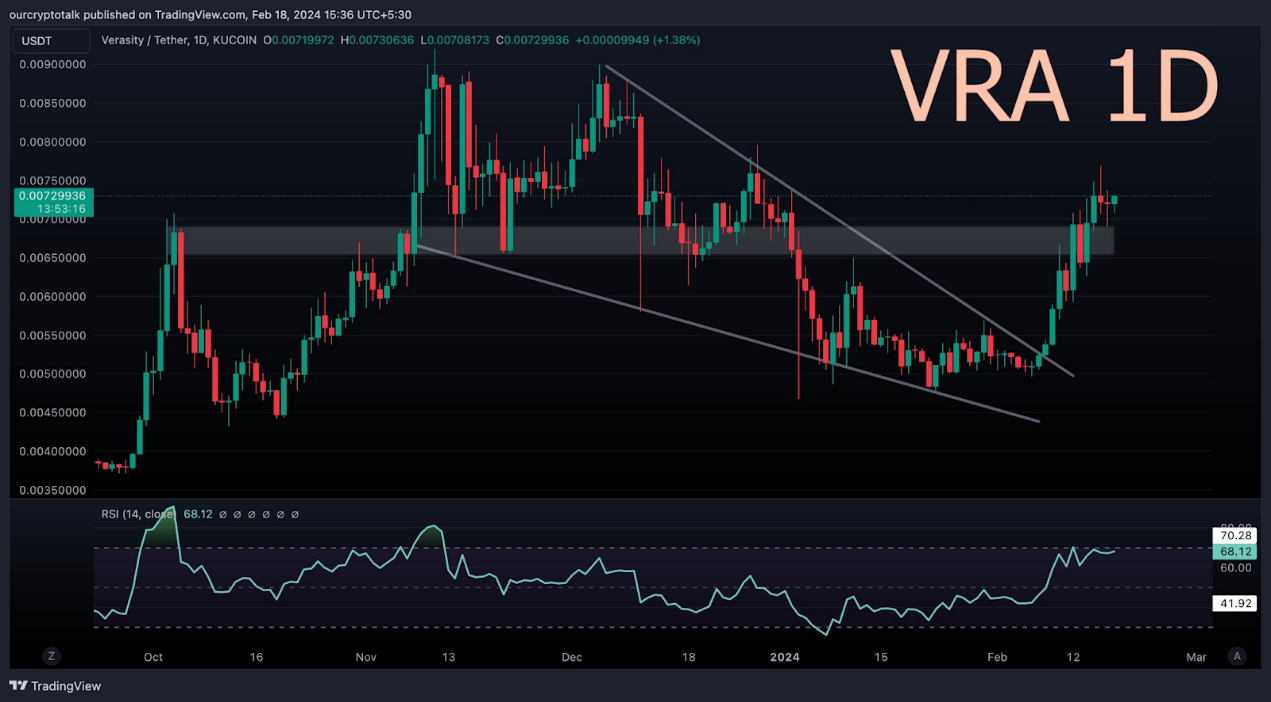
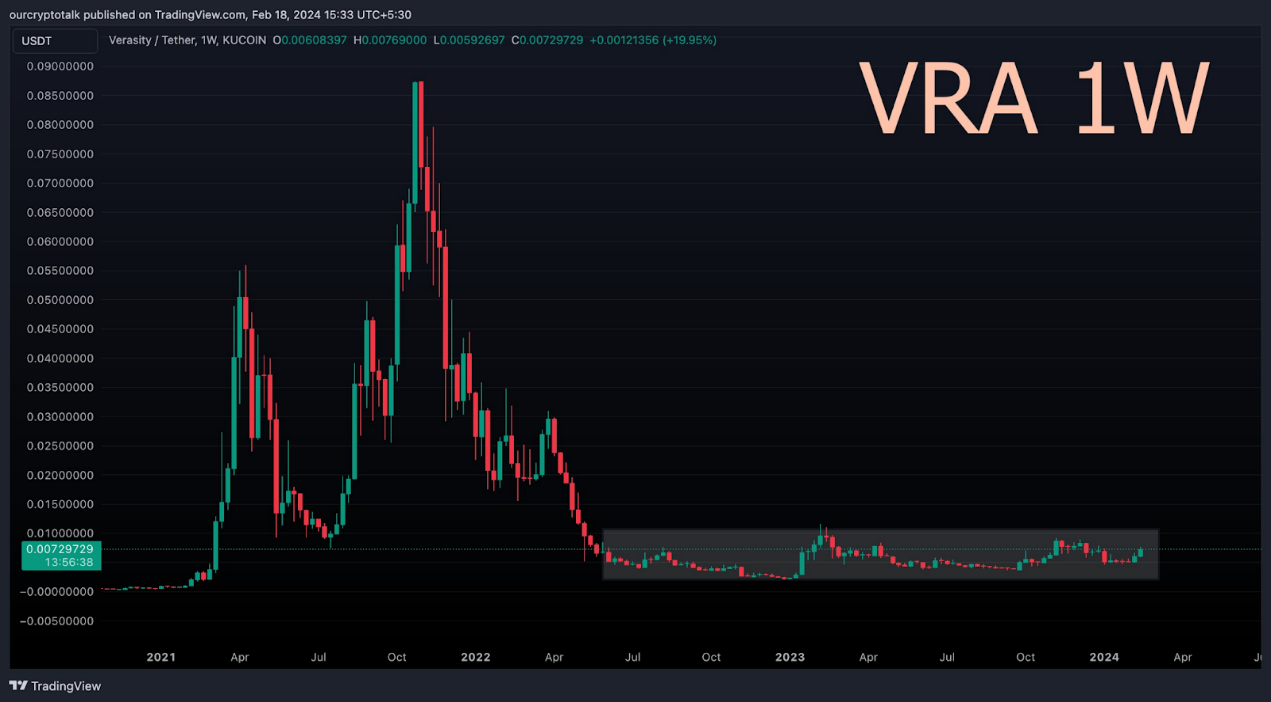
Recently, VRA rose 50% from $0.005 to $0.0075, re-establishing an uptrend
-
The $0.007 support level is significant in the medium term. It has now been broken to the upside, and the Relative Strength Index (RSI) still has room to rise (Note: RSI measures the speed and magnitude of price movements; typically, RSI above 70 indicates overbought conditions, while below 30 indicates oversold conditions)
Long-Term Analysis
-
Persistent accumulation since the bear market is a positive sign, though it has taken longer than expected
-
If VRA can achieve even half of its 2021 rally, the current level represents a compelling entry point
PAAL AI (PAAL)
Short-Term Analysis
-
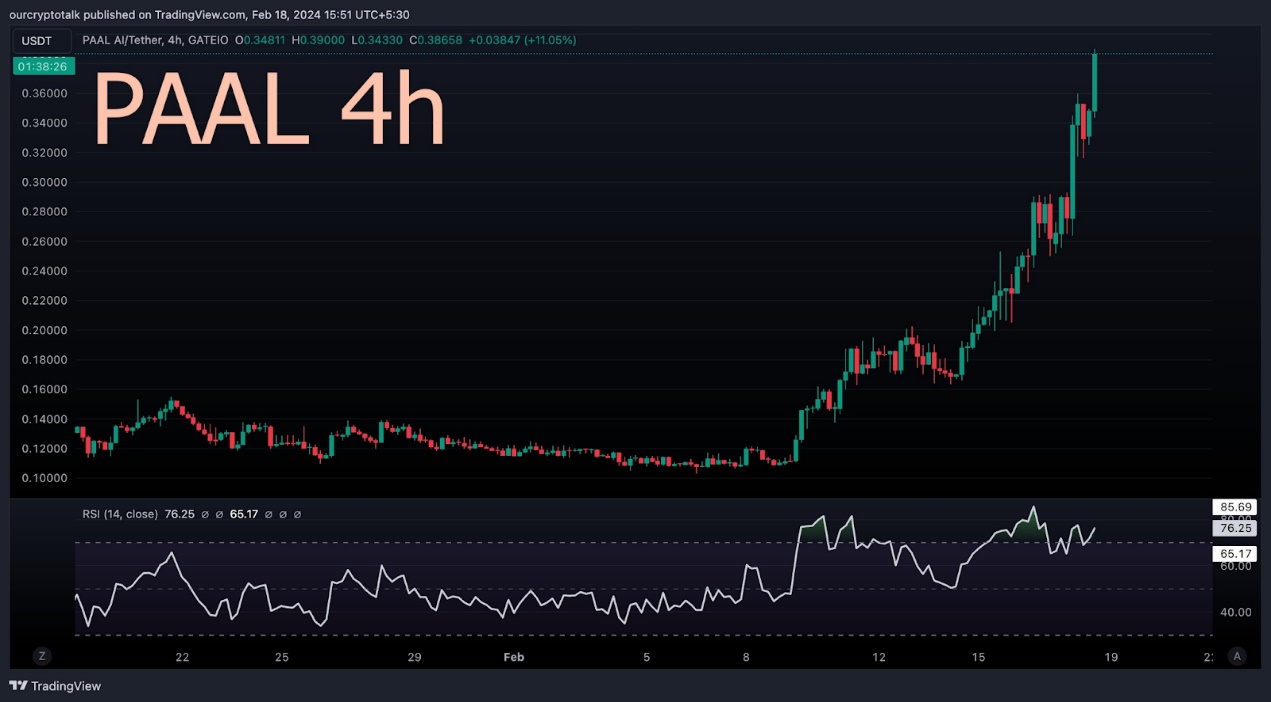
From an RSI perspective, the 4-hour timeframe (4hTF) has peaked. The recent lower high (LH) indicates cooling momentum in the near term
-
Holders may consider taking profits here, as sharp corrections often follow such rallies, allowing for re-entry during consolidation
Long-Term Analysis
-
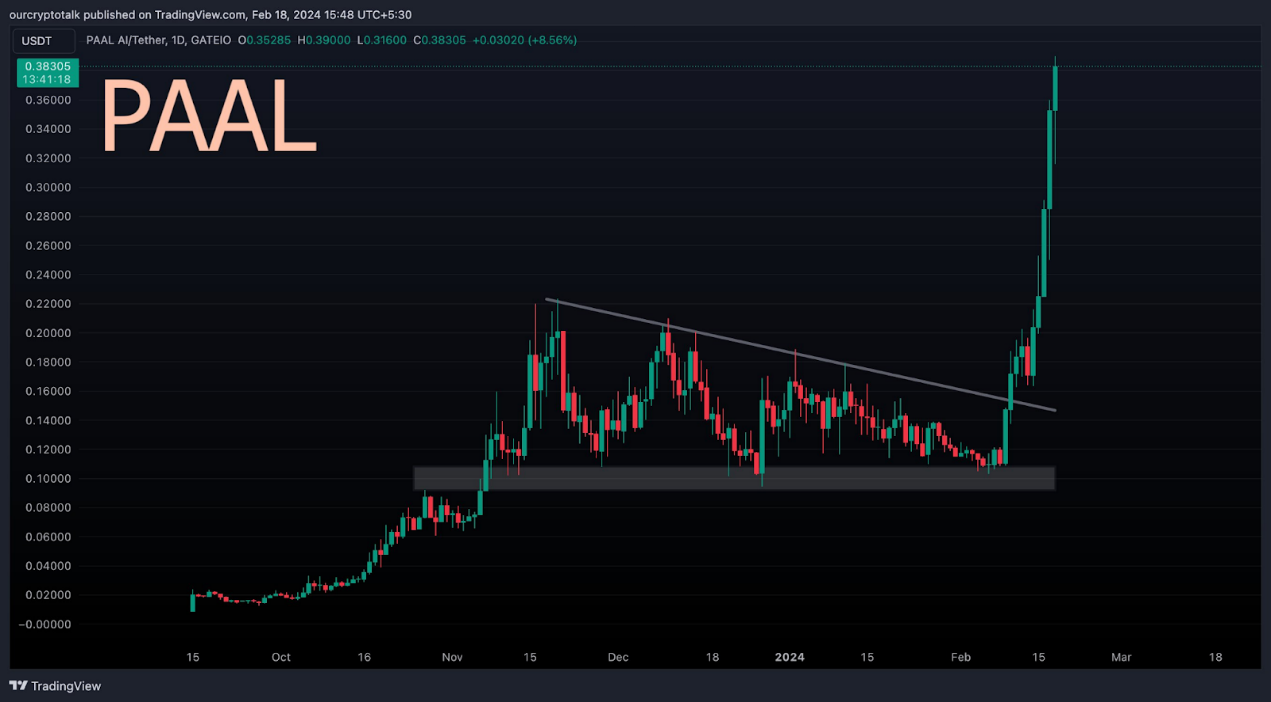
With the clear breakdown of a descending triangle, PAAL has moved beyond conventional technical analysis
-
Recent price action has already exceeded expectations by threefold, with long-term potential of 20–30x gains
ARC (ARC)
Short-Term Analysis
-
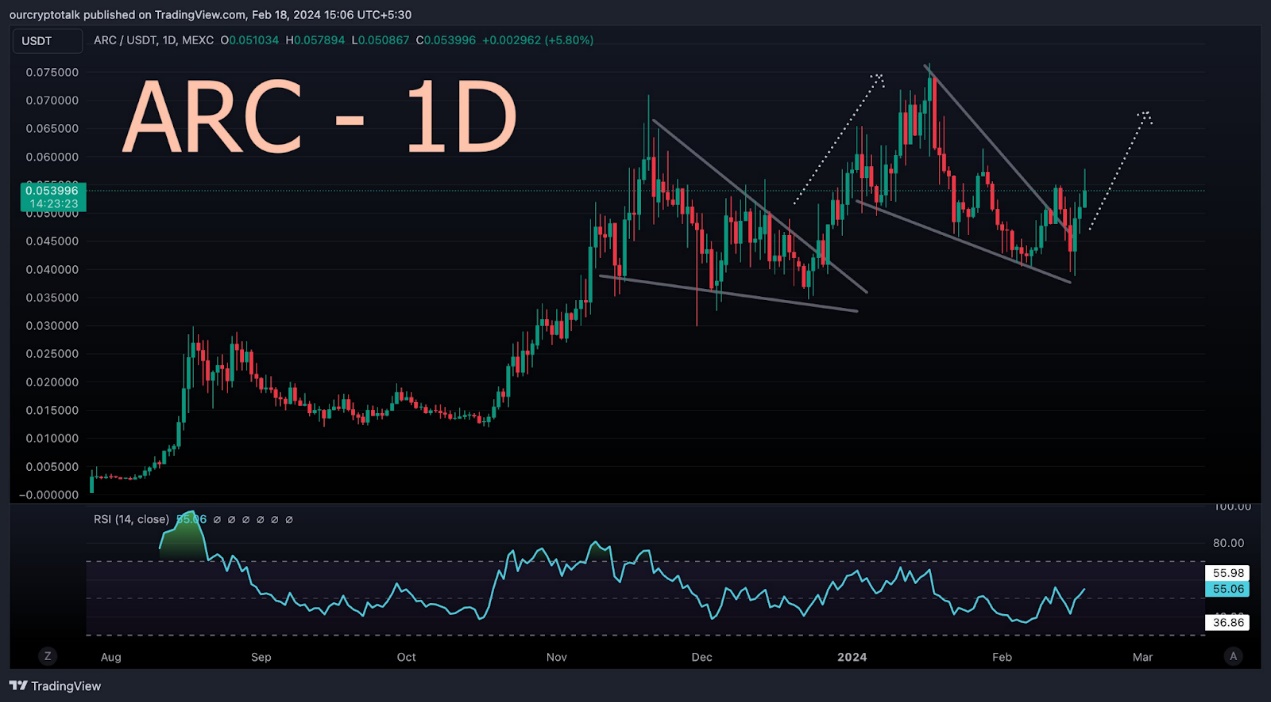
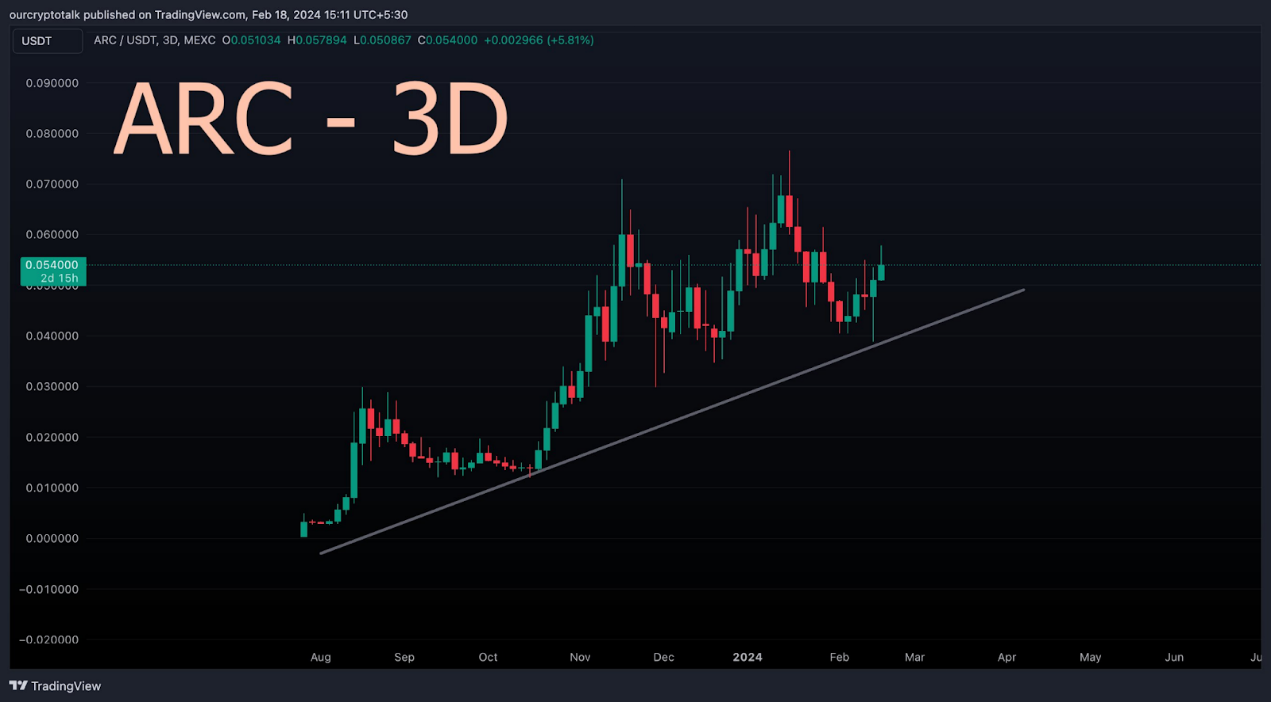
Price has broken out of a descending wedge pattern, mirroring prior price behavior toward its ATH
-
The current breakout targets approximately 7 cents, aligning with its previous peak
Long-Term Analysis
-
ARC is an early-stage project in the AI space, yet throughout its history it has consistently established higher highs (HH) and higher lows (HL)
-
Assuming stable external conditions, ARC could reach 30 cents by 2024
NeurAI Project (XNA)
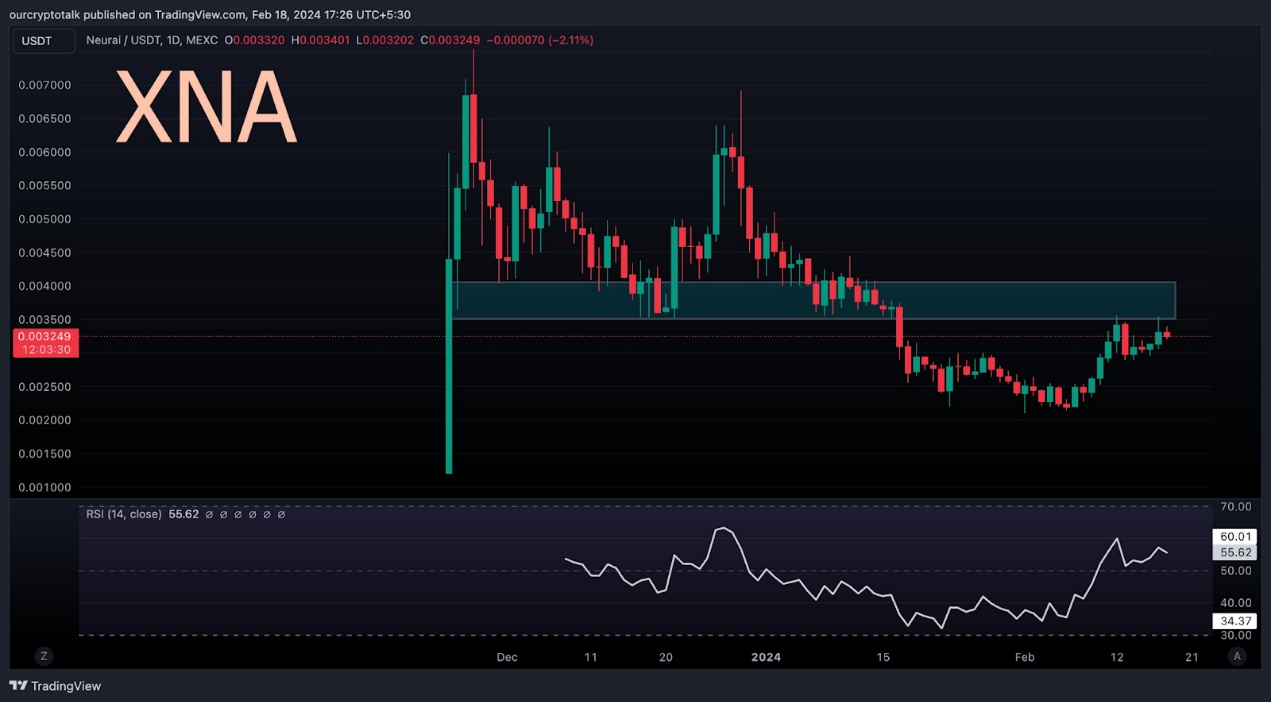
XNA is a relatively new project in this space, with only three months of history.
-
Before going long on XNA, a key resistance level to watch is $0.0035
-
A successful breakout above this level could drive prices toward $0.01 over the long term
Oraichain (ORAI)
Short-Term Analysis
-
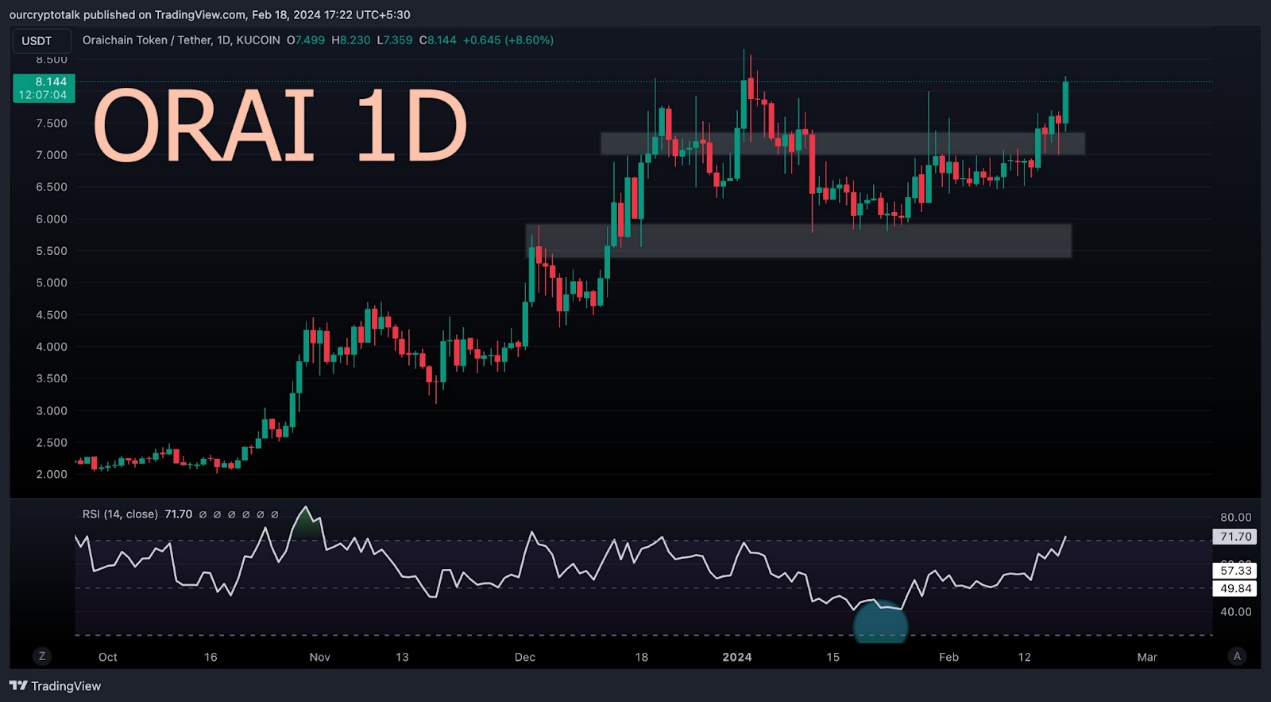
After reaching a one-year high of 8.5, the S/R (support and resistance) level broke out. Since January, it had lost support around $8
-
Now breaking out with a 15% surge signals renewed strength and further upside potential
Long-Term Analysis
-
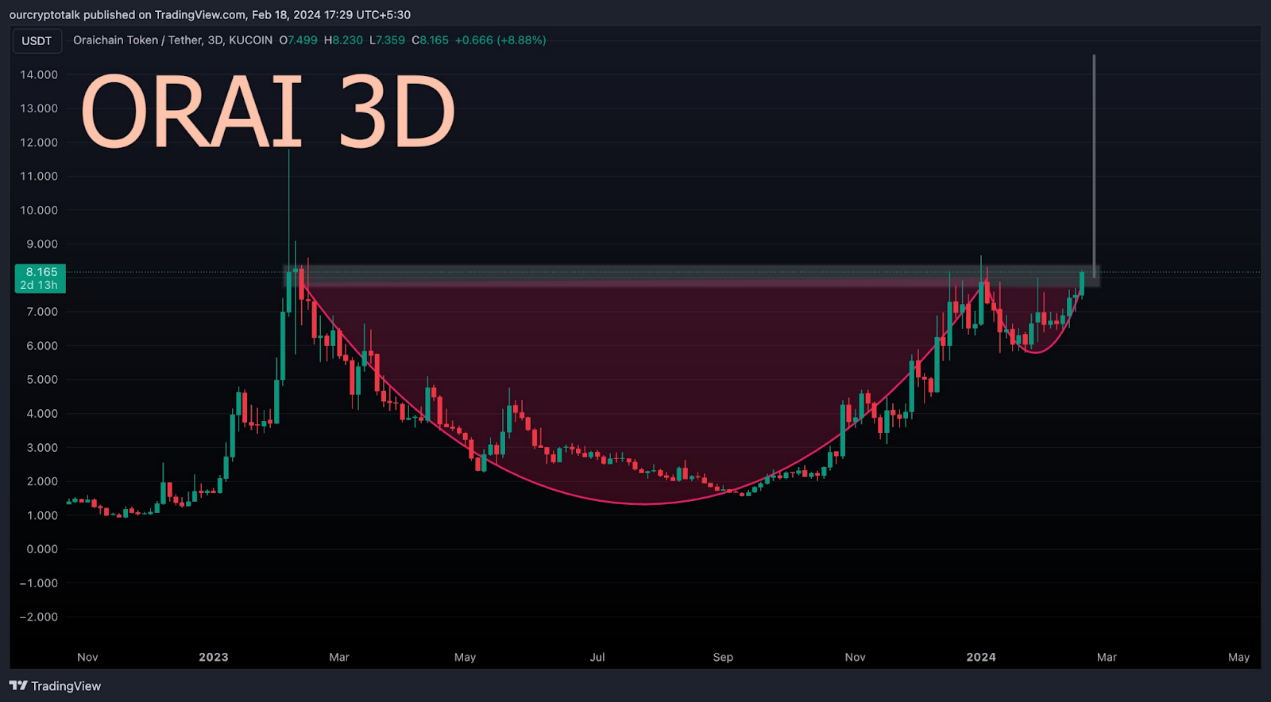
Following the breakout above $8.1, ORAI has formed a cup-with-handle pattern (Note: a bullish continuation pattern), targeting $14
-
Price must hold above the neckline to prevent pattern failure
Join TechFlow official community to stay tuned
Telegram:https://t.me/TechFlowDaily
X (Twitter):https://x.com/TechFlowPost
X (Twitter) EN:https://x.com/BlockFlow_News
 @ourcryptotalk