








Numbers Tell the Story of Ethereum 2023: Staking Up +60%, Annual Supply Down -0.28%, TVL on 12 L2s Averaged +333%
TechFlow Selected TechFlow Selected
Numbers Tell the Story of Ethereum 2023: Staking Up +60%, Annual Supply Down -0.28%, TVL on 12 L2s Averaged +333%
This article analyzes 2023 data on liquid staking and Layer 2 (L2) to review and展望 the development of Ethereum.
 Navigating Web3 tides with focused insights
Author: Carol, PANews
In 2023, Ethereum had two major storylines.
The first was related to liquid staking. In April, Ethereum completed the Shanghai upgrade, officially enabling withdrawals for stakers and entering an era of "interest rate control." Contrary to earlier market concerns, the upgrade did not trigger a massive sell-off. Instead, rising ETH prices attracted more deposits, making liquid staking derivatives (LSD) the hottest DeFi sector.
The second storyline involved Layer 2 (hereinafter L2). Arbitrum's airdrop continued the "wealth creation myth," raising expectations for other L2 airdrops. Additionally, Base’s breakout success and the approaching Dencun upgrade have made technical keywords such as modular architecture, parallel EVMs, data availability (DA), and decentralized sequencers increasingly common. Rapid L2 development and sharp price increases in representative assets like OP have made L2 one of the most anticipated sectors in 2024.
PAData, the data journalism column under PANews, analyzed 2023 data on liquid staking and L2 developments to review and forecast Ethereum's evolution:
-
From post-Shanghai upgrade through year-end, total Ethereum deposits amounted to approximately 17.3061 million ETH, with redemptions totaling about 8.1135 million ETH. Net staked ETH increased by 10.8242 million, a rise of roughly 60%. However, the growth rate of staking slowed significantly, indicating that enthusiasm for staking deposits has waned compared to earlier periods.
-
Could Ethereum staking crowd out other DeFi activities? Correlation analysis shows that over short cycles, when prices clearly decline, funds tend to move from DeFi into staking—suggesting a possible "siphoning effect." When prices rise clearly, capital flows out of both staking and DeFi simultaneously, showing no reverse siphoning.
-
Throughout 2023, Ethereum burned approximately 109.35 thousand ETH in transaction fees. The total ETH supply decreased by about 341.8 thousand ETH, or 0.28%. ETH experienced mild deflation overall, though neither the degree nor trend of deflation was significant.
-
Among 34 L2 chains analyzed, 11 used Optimistic Rollup and 11 used ZK Rollup. Most remain in early technological stages—17 are at STAGE 0, meaning only state commitment is implemented. This includes popular networks like OP Mainnet, Base, zkSync Era, and Starknet.
-
Arbitrum One had the highest TVL among L2s at $9.37 billion, followed by OP Mainnet at $6.05 billion. L2s with high annual TVL growth included Manta Pacific, Starknet, and Polygon zkEVM.
-
Arbitrum One recorded the highest number of transactions in 2023, exceeding 275 million. zkSync Era came second with over 218 million. Both briefly surpassed Ethereum’s TPS toward year-end.
-
Independent addresses and daily active addresses across L2s grew substantially in 2023. Base saw the highest annual increase in unique addresses, growing over 7,166%. Mantle led in daily active address growth, up more than 886%.
-
Among four major Rollup-based L2s, zkSync Era generated the highest annual revenue at $22.26 million, followed by Arbitrum at $16.53 million. Base and Optimism each earned less than $6 million.
-
IMX posted the highest token price gain in 2023, rising over 454%, followed by METIS and OP, both up over 300%. ARB performed modestly, increasing only 14.81% for the year.
01. Post-Shanghai Upgrade: Staking Grows Nearly 60% but Growth Slows; Over 109K ETH Burned, Achieving Mild Deflation
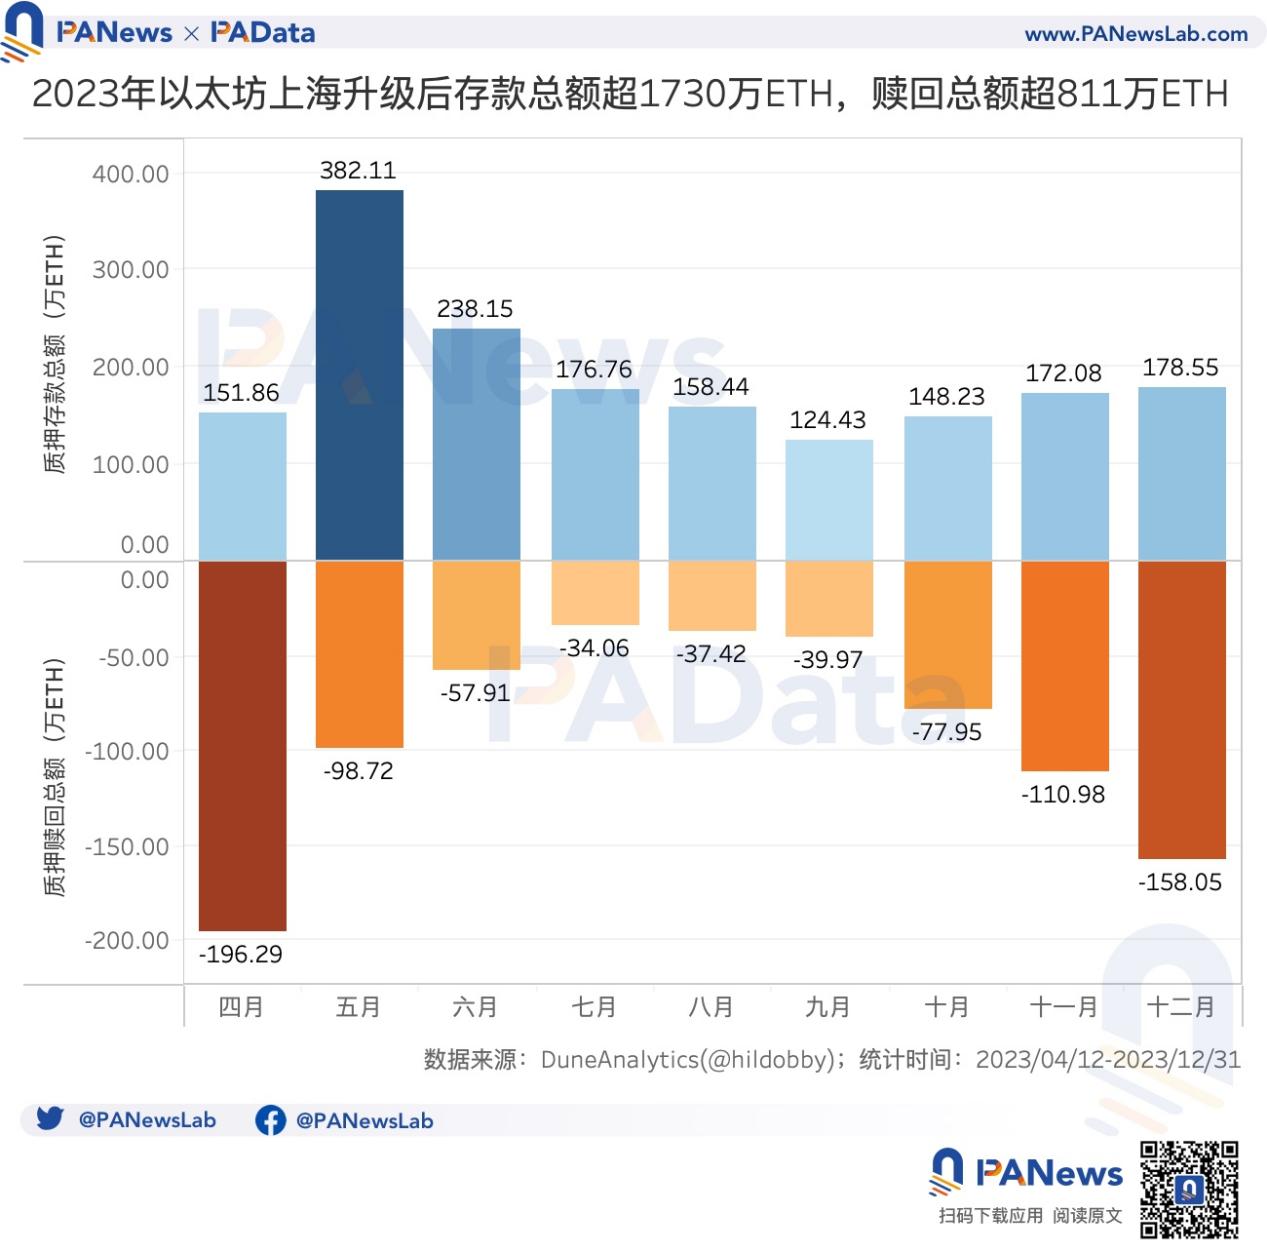
After successfully completing the Shanghai upgrade on April 12, Ethereum saw total deposits reach approximately 17.3061 million ETH by year-end, with total redemptions (including principal and rewards) amounting to about 8.1135 million ETH. Redemption volumes followed an inverted "U" shape, peaking in April and December with over 1.96 million ETH and 1.58 million ETH respectively. Deposit volumes remained relatively stable—aside from May, which attracted 3.82 million ETH, monthly deposits averaged around 1.68 million ETH.
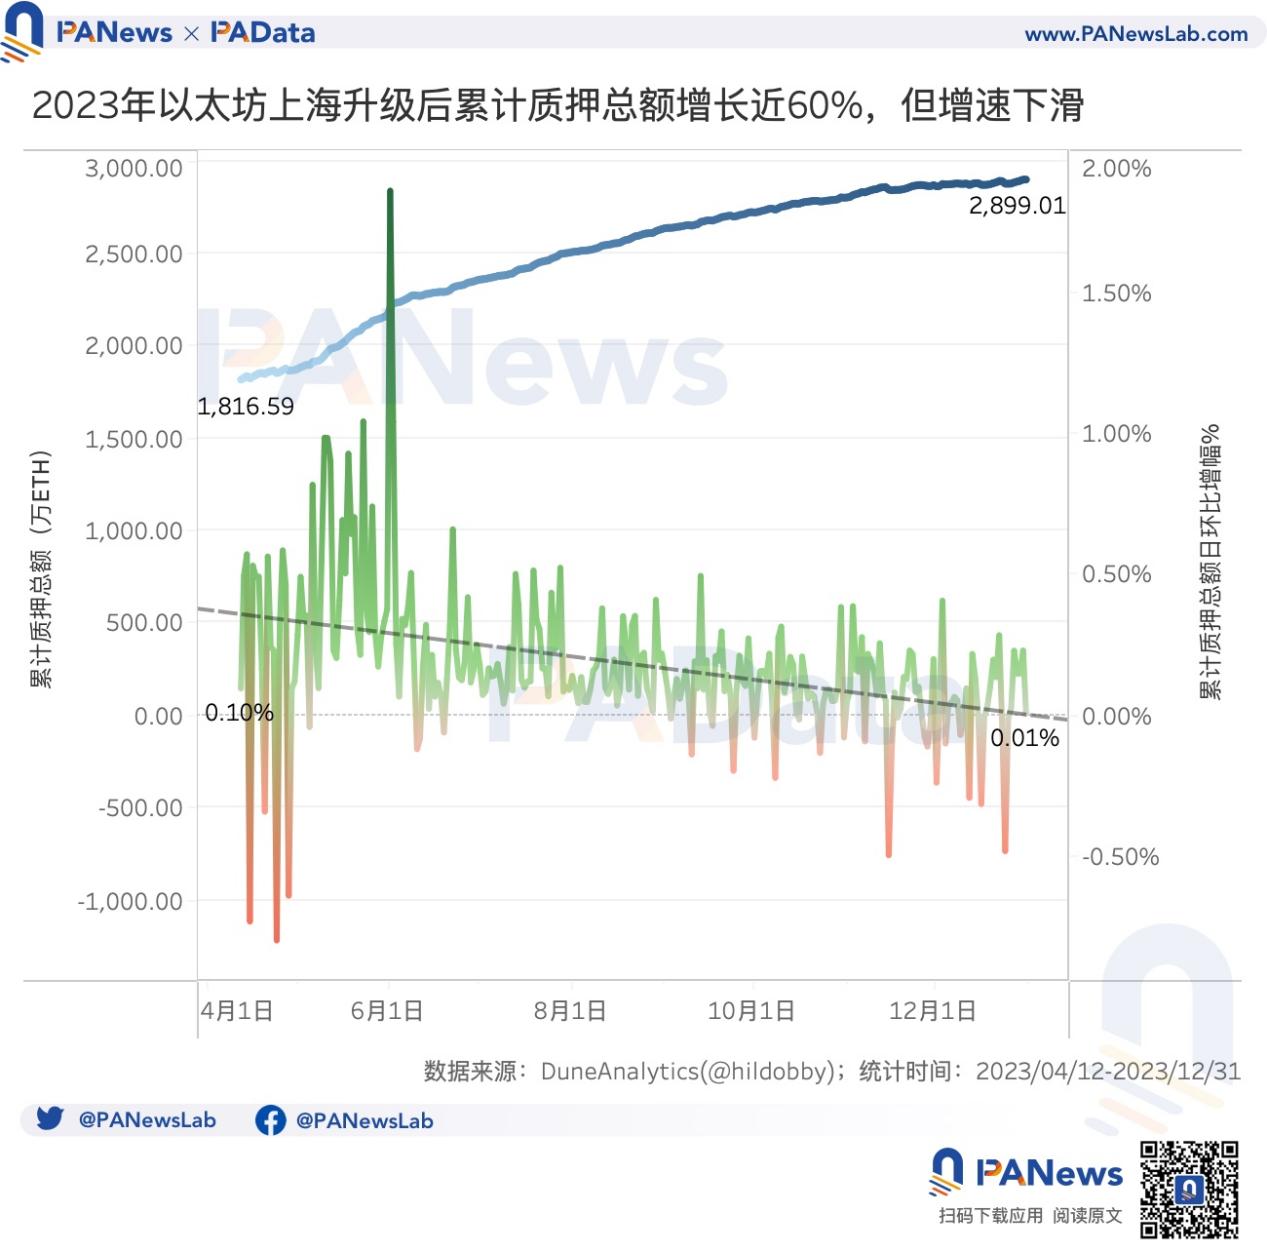
Following the Shanghai upgrade, cumulative staked ETH rose from 18.1659 million to 28.9901 million, an increase of 10.8242 million ETH—or about 60% growth.
In terms of staking participants, Lido and Coinbase were the top contributors to staking growth in 2023, adding 4.5597 million ETH and 1.7087 million ETH respectively. All other entities added less than 1 million ETH. Figment, Kiln, OKX, and Rocket Pool each increased their staked amounts by over 50,000 ETH.

However, looking at full-year trends, the growth rate of total staked ETH declined rapidly. In May, the average daily环比 growth peaked at 0.48%, but it steadily decreased month by month, reaching just 0.03% in December—a clear downward trend. This suggests that interest in staking deposits has diminished compared to earlier in the year.
According to Dune Analytics, although Ethereum’s staking yield dropped from 4.18% at the start of the year to 3.09% by year-end, it still offers a stable source of income. There has long been concern that high staking yields could attract excessive deposits, crowding out other on-chain activities and potentially harming Ethereum’s long-term ecosystem health. Do the data support this hypothesis?
PAData examined the correlation between daily环比 changes in cumulative staking totals and TVL, as well as between redemption volumes and TVL. Here, TVL is measured in ETH and, per DefiLlama’s definition, excludes lockups from liquid staking protocols.
A negative correlation (≤-0.5) between daily环比 change in cumulative staking and TVL, or a positive correlation (≥0.5) between redemption changes and TVL, would suggest a “siphoning effect”—i.e., higher staking inflows coincide with lower DeFi inflows, or higher redemptions align with higher DeFi activity—and vice versa.
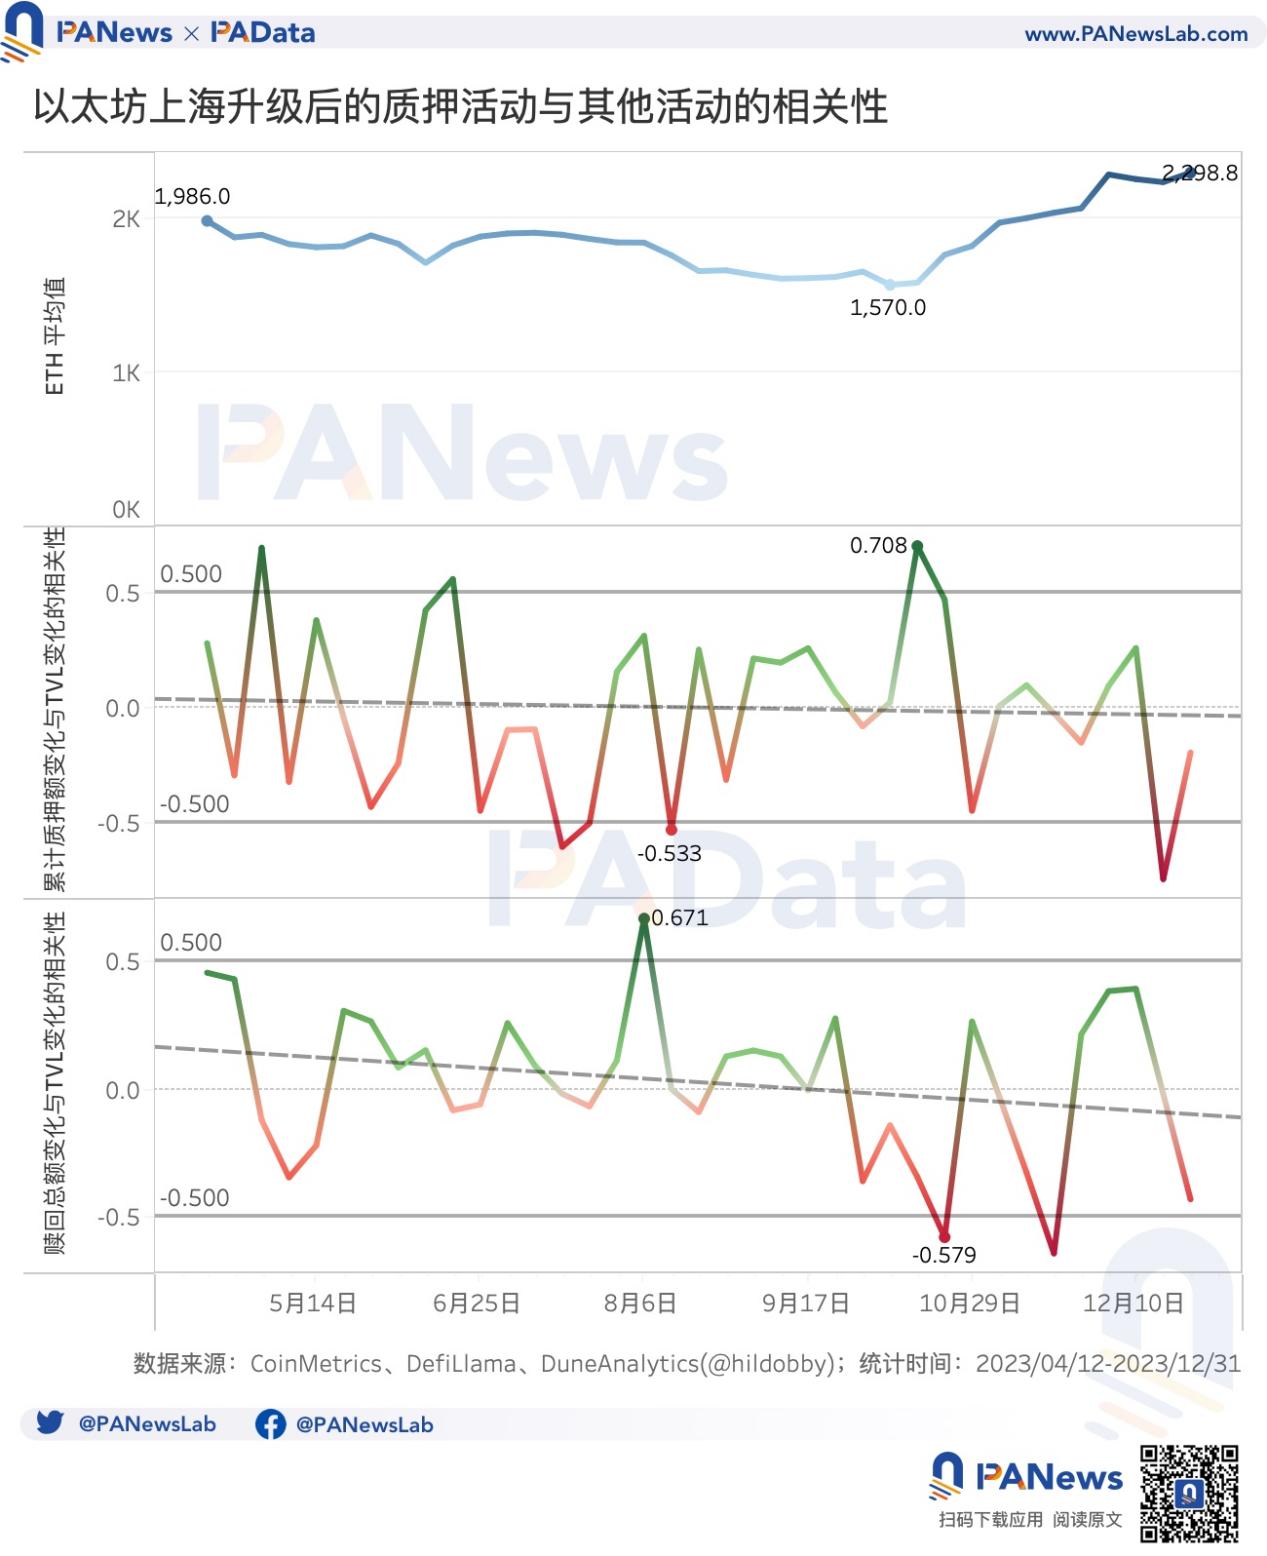
Correlation analysis results show that overall, there is no strong evidence of a persistent “siphoning effect” from staking activities.
However, when zooming into weekly intervals, temporary siphoning effects may appear during certain periods. For example, in mid-August (around August 6–19), the correlation coefficient between daily redemption changes and TVL changes was 0.671, while the correlation between cumulative staking changes and TVL changes was -0.533. During this period, ETH’s weekly average price fell from $1,844 to $1,659. This indicates that when prices clearly declined, funds flowed from DeFi into staking—evidence of a potential siphoning effect.
Another notable period occurred in mid-October (around October 15–28), where the correlation between cumulative staking changes and TVL changes reached 0.708, and the correlation between redemption changes and TVL changes was -0.579. ETH’s weekly average rose from $1,583 to $1,765. This suggests that during clear price rallies, capital exited both staking and DeFi simultaneously—no reverse siphoning occurred.
One key precursor to the Shanghai upgrade was the implementation of EIP-1559, which opened the door for Ethereum to become deflationary. In 2023, Ethereum burned approximately 109.35 thousand ETH in transaction fees. May saw the highest monthly burn at 204.6 thousand ETH, while October had the lowest at 41.3 thousand ETH. By year-end, burn rates rebounded above 100 thousand ETH.
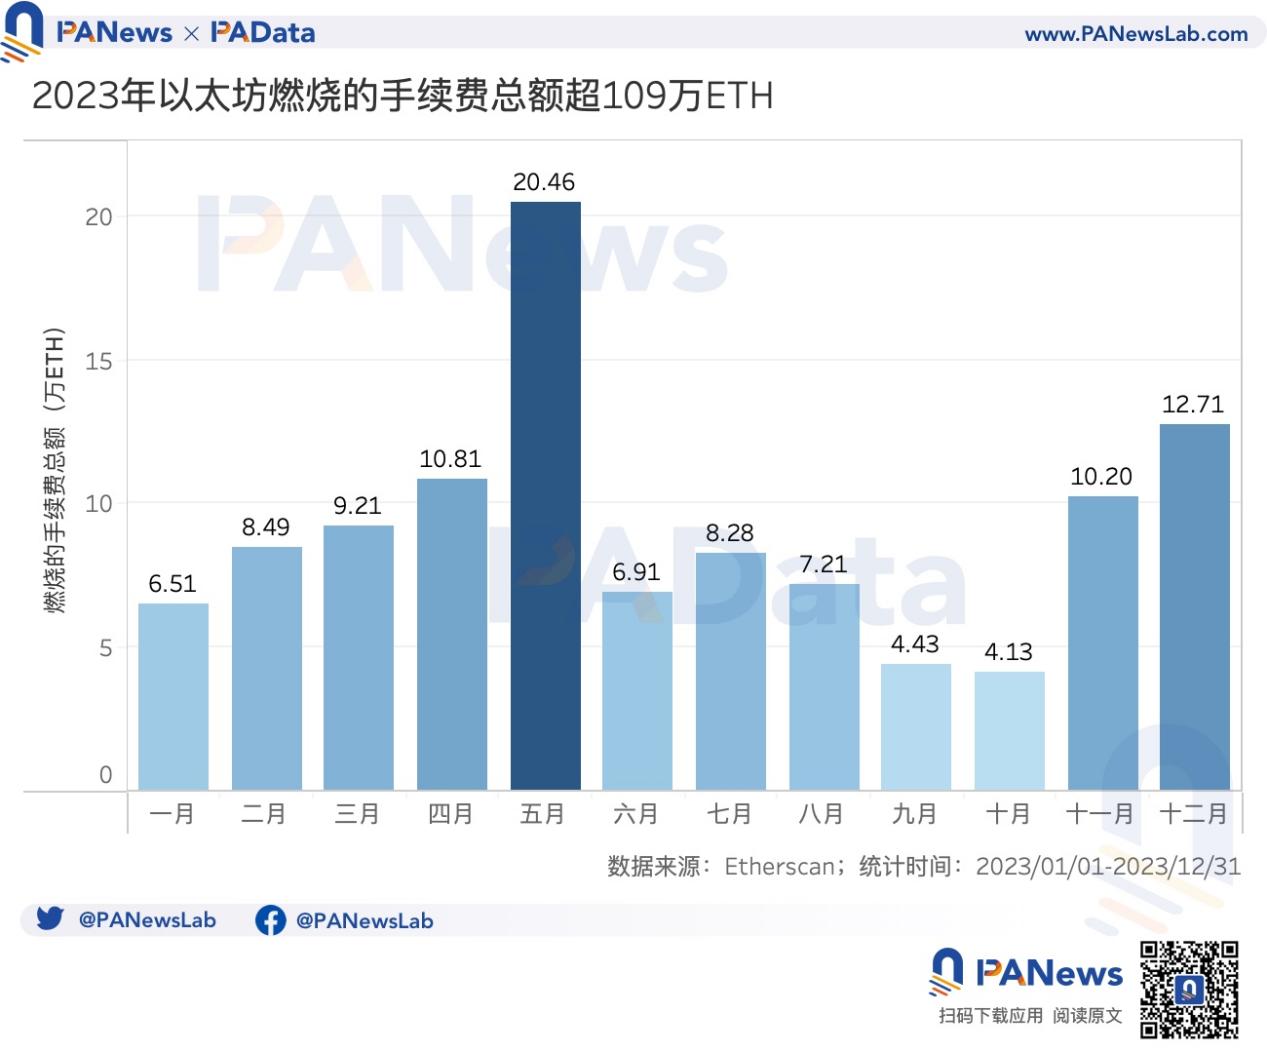
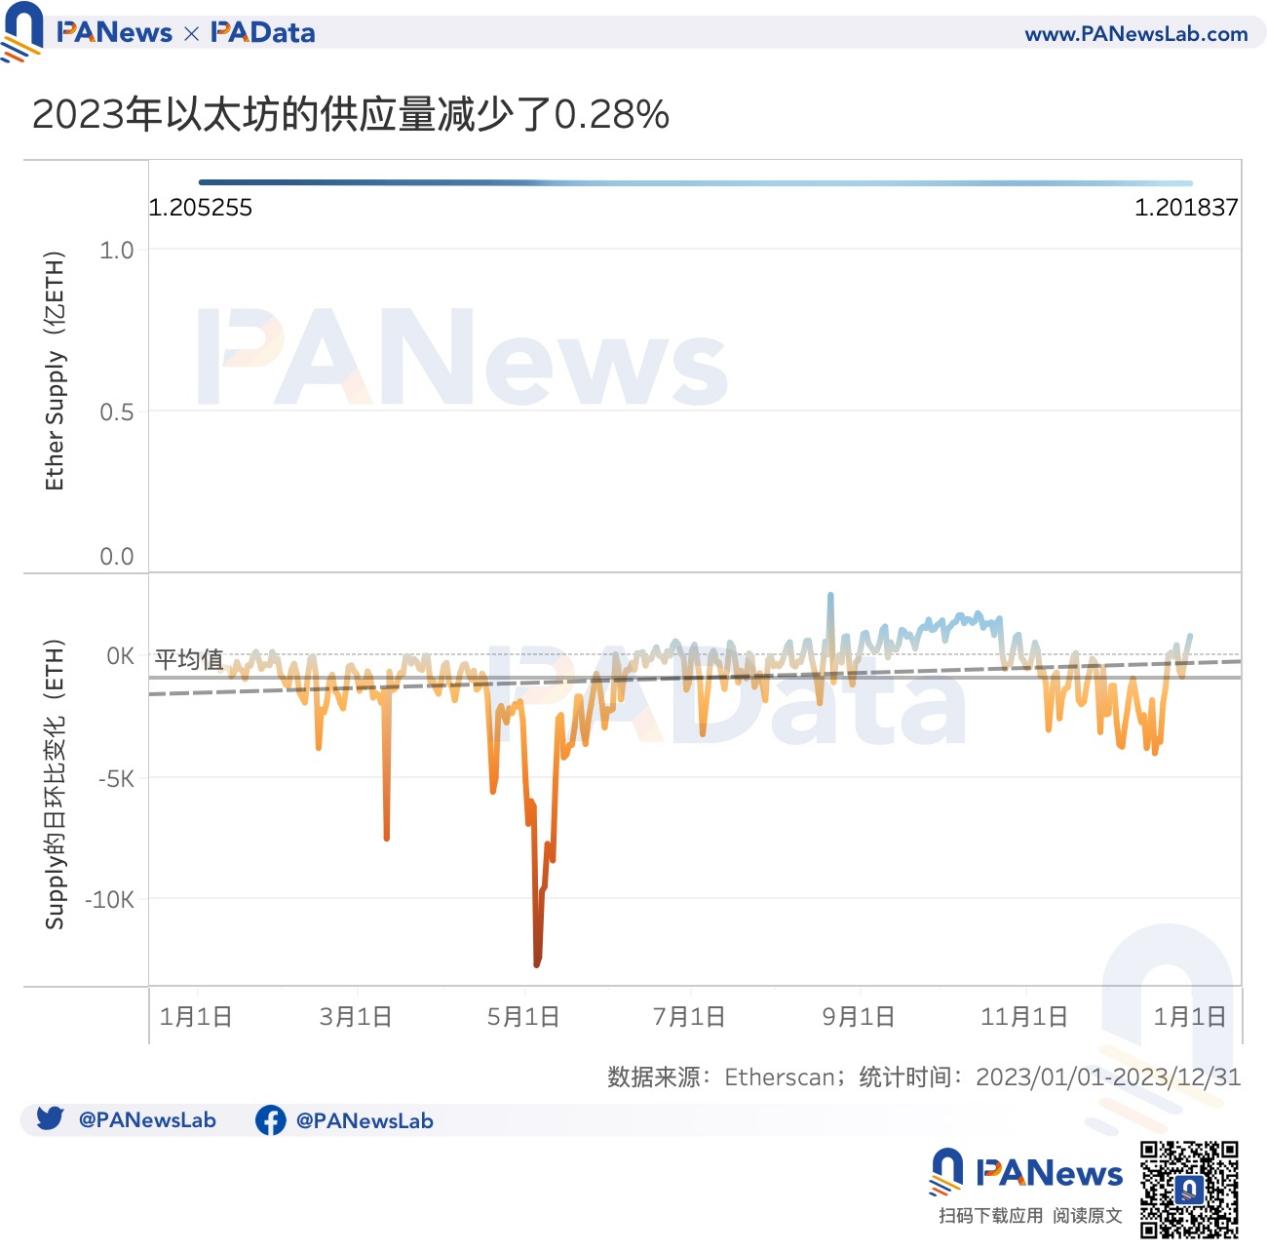
As a result, ETH’s total supply decreased from 120.53 million to 120.18 million ETH in 2023—a reduction of about 341.8 thousand ETH, or 0.28%. Thus, ETH achieved mild deflation overall in 2023.
On a daily basis, supply decreased by an average of 939 ETH per day. However, the magnitude of daily decreases gradually shrank over time—indicating that the deflationary trend, while present, was very weak and not statistically significant.
02. Twelve L2s Saw Average TVL Growth Over 333%; zkSync Era Earned $22.26 Million in Revenue
2023 was a year of rapid advancement for the L2 space—not only did OP Stack expand its footprint across much of the market, but new technological trends also emerged, including modularity, parallel EVMs, decentralized sequencers, and third-party DA solutions. The roadmap seems clearer than ever. But what does actual L2 development look like?
Based on data from L2BEAT covering 34 L2 chains, 11 use Optimistic Rollup and 11 use ZK Rollup, with nearly equal representation. Eight use Validium, and four use Optimium. The main differences among these architectures lie in their combinations of data availability (DA) and proof systems.
Most of these L2s are general-purpose, with only a few specialized for exchanges or NFTs, such as dYdX v3 and Immutable X.
Technologically, most L2s remain in early stages. A total of 17 are at STAGE 0, including popular ones like OP Mainnet, Base, zkSync Era, and Starknet. Only three have reached STAGE 1: Arbitrum One, dYdX v3, and zkSync Lite.
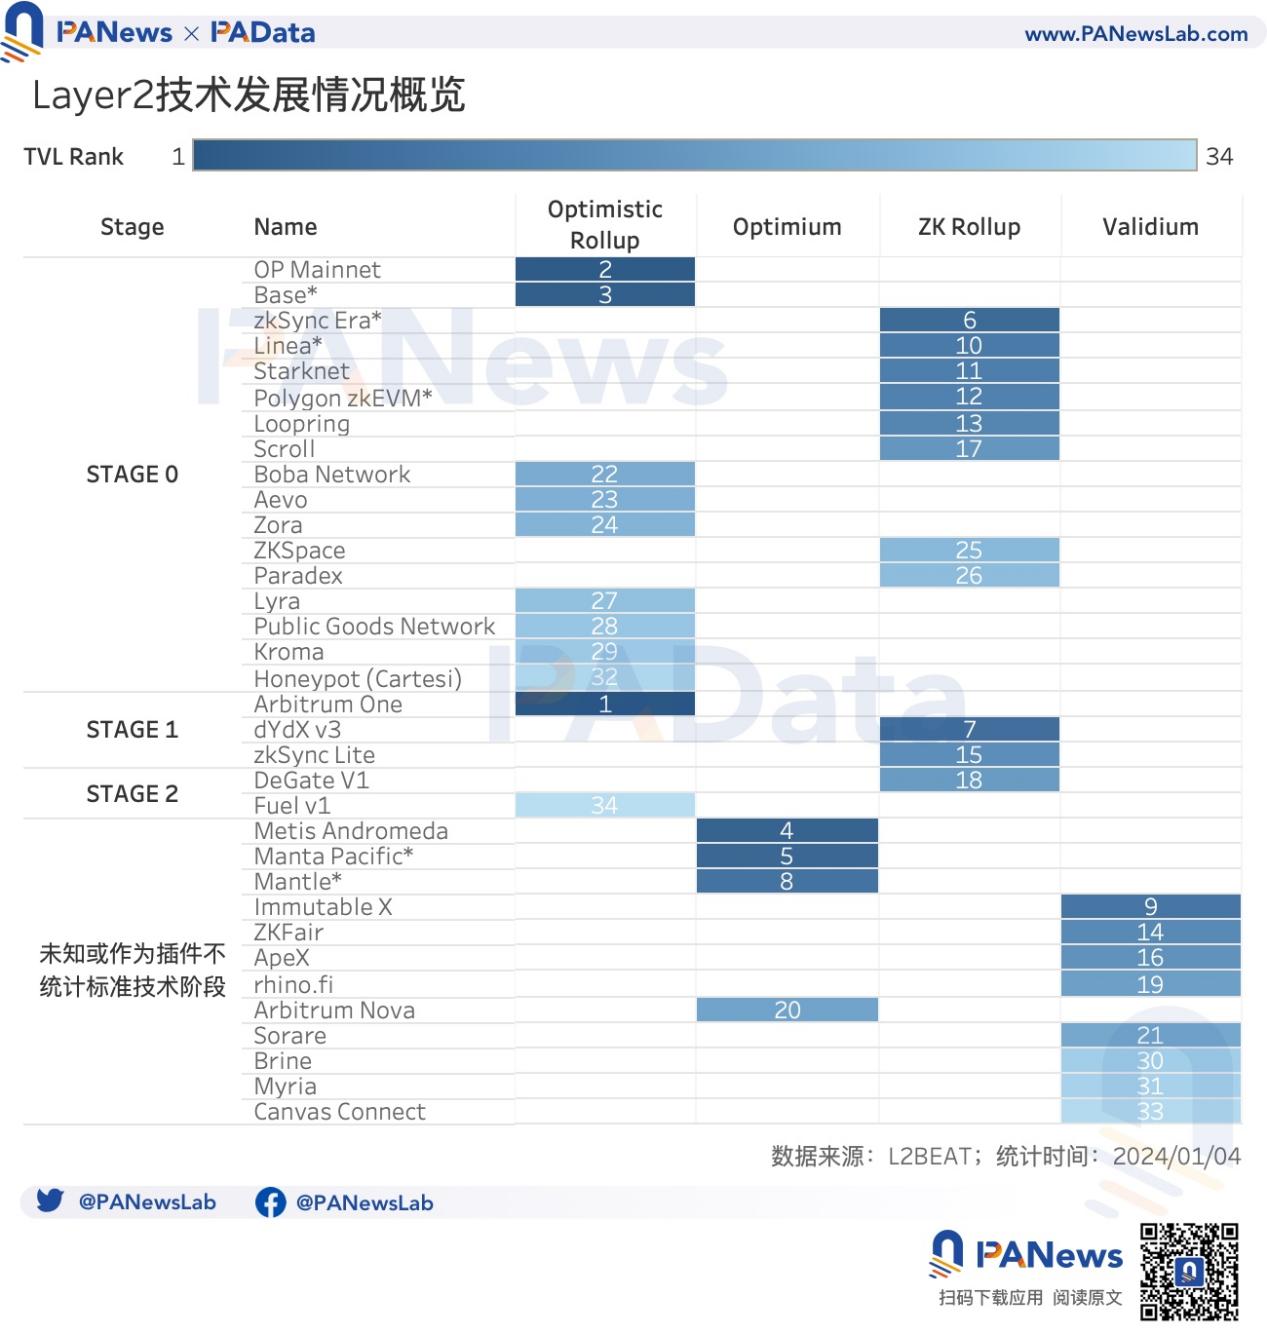
Technically, the key difference between STAGE 1 and STAGE 0 is that STAGE 1 chains submit state updates to L1 and partially implement proof systems—allowing users to exit under certain challenge procedures, or within seven days if a non-Council entity pushes an unnecessary upgrade.
Two L2s have reached the higher STAGE 2 level. Compared to STAGE 1, STAGE 2 further refines the proof system—fraud proofs are open only to whitelisted participants, upgrades unrelated to on-chain provable vulnerabilities allow exits within fewer than 30 days, and Security Council actions aren't limited solely to on-chain provable bugs.
Currently, Arbitrum One leads all L2s in TVL (defined as total value locked in Ethereum-hosted contracts, including bridged and native assets) at $9.37 billion, followed by OP Mainnet at $6.05 billion. All other L2s have TVL below $700 million. The L2 market is largely dominated by Arbitrum One and OP Mainnet.
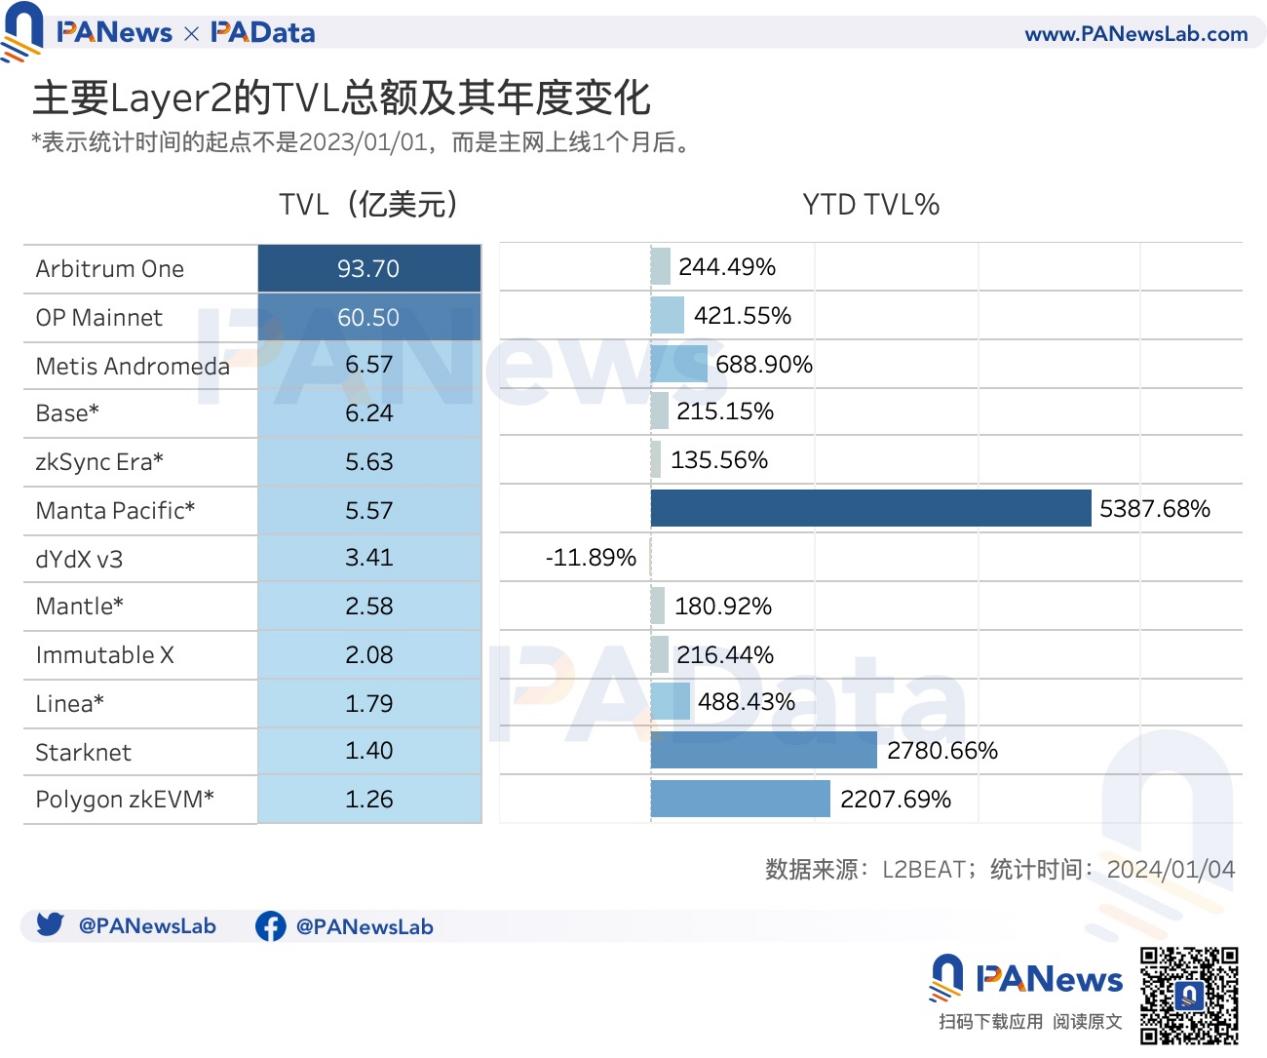
Despite this duopoly, many new entrants emerged in 2023. Among the 12 L2s with the highest TVL, six launched their mainnets in 2023—half of the group. These newcomers capitalized on momentum to achieve impressive TVL growth: Manta Pacific grew over 5,387%, while Starknet and Polygon zkEVM both grew over 2,000%.
Other L2s with strong TVL growth include Metis Andromeda (over 688%) and Linea (over 488%). Even earlier-launched chains like Arbitrum One, OP Mainnet, and Immutable X achieved TVL growth exceeding 200%.
Due to data availability constraints, subsequent on-chain analyses focus only on selected high-TVL L2s.
In terms of transaction volume, Arbitrum One led in 2023 with over 275 million transactions, followed by zkSync Era with over 218 million. OP Mainnet exceeded 136 million. Other L2s in the sample recorded fewer than 100 million transactions, some even under 10 million.
Notably, driven by the inscriptions boom, Arbitrum One and zkSync Era briefly surpassed Ethereum’s TPS toward year-end, proving capable under high-frequency usage.
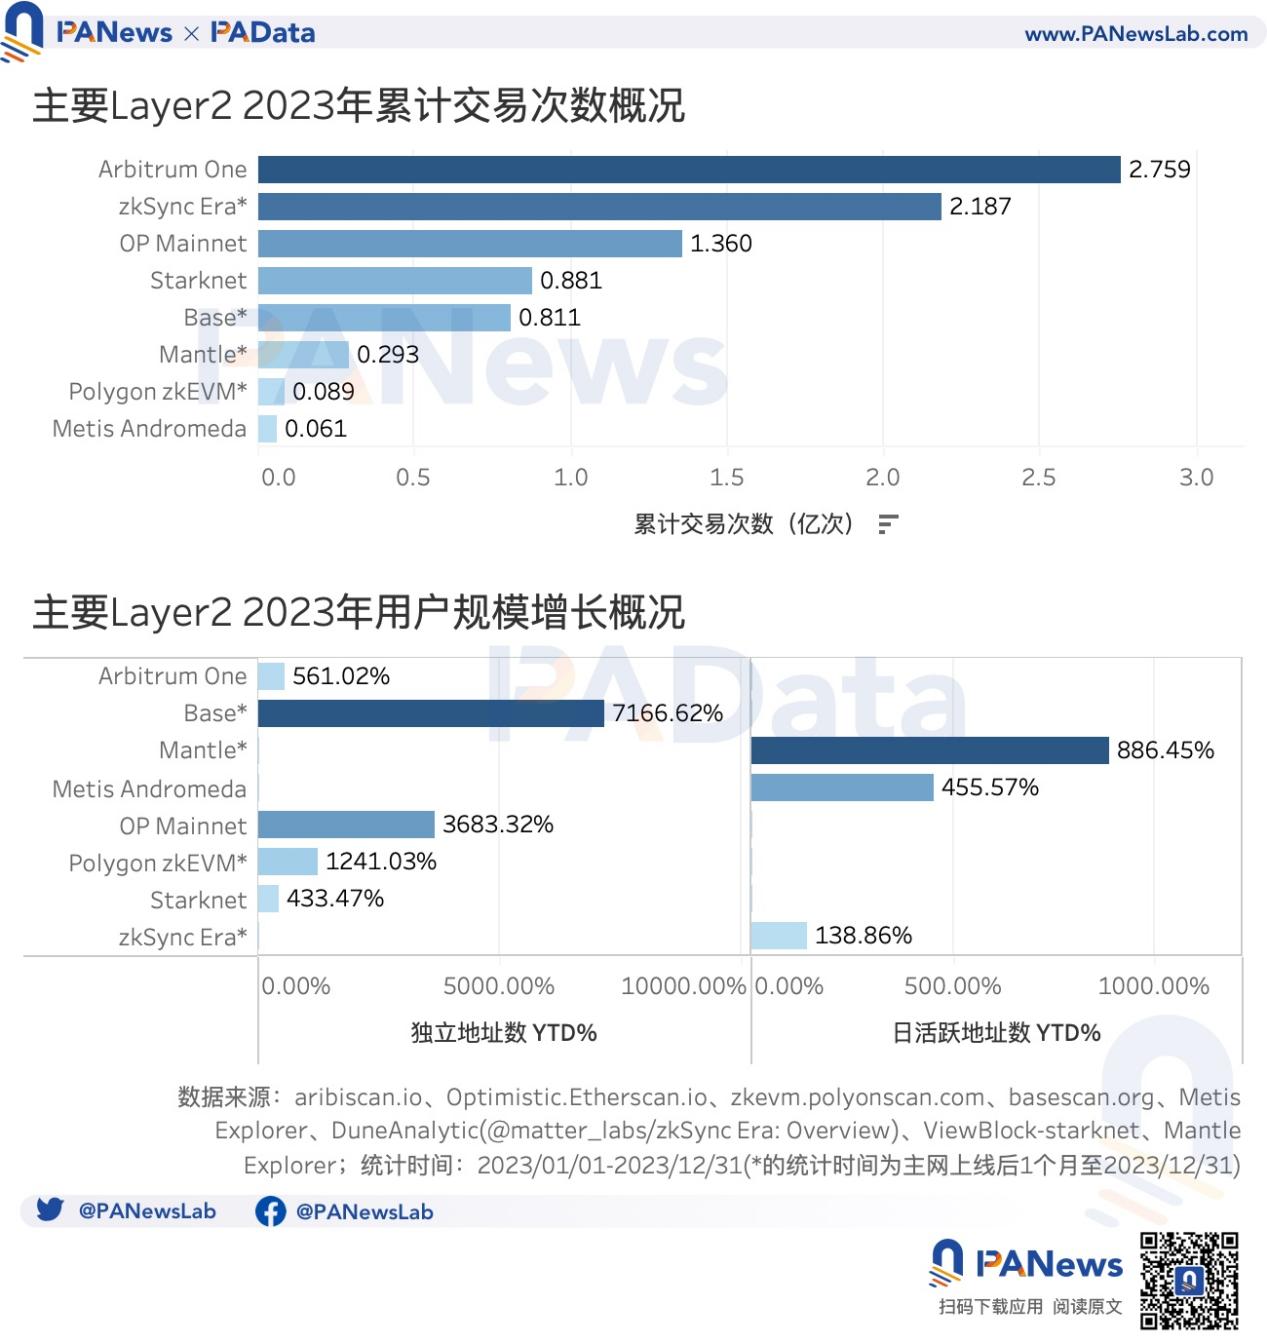
From a user base perspective, all sampled L2s experienced remarkable growth in 2023. Base saw the highest annual growth in unique addresses—over 7,166%—followed by OP Mainnet at over 3,683%. Mantle led in daily active address growth, up over 886%, followed by Metis Andromeda at over 455%. Overall, this means not only are more people using L2s, but they’re also using them more frequently.
Despite promising growth, L2s still face limitations in funding and user scale—reflected in low revenues. Among four major Rollup-based L2s, zkSync Era generated the highest annual revenue at $22.26 million, followed by Arbitrum at $16.53 million. Base and Optimism each earned less than $6 million.
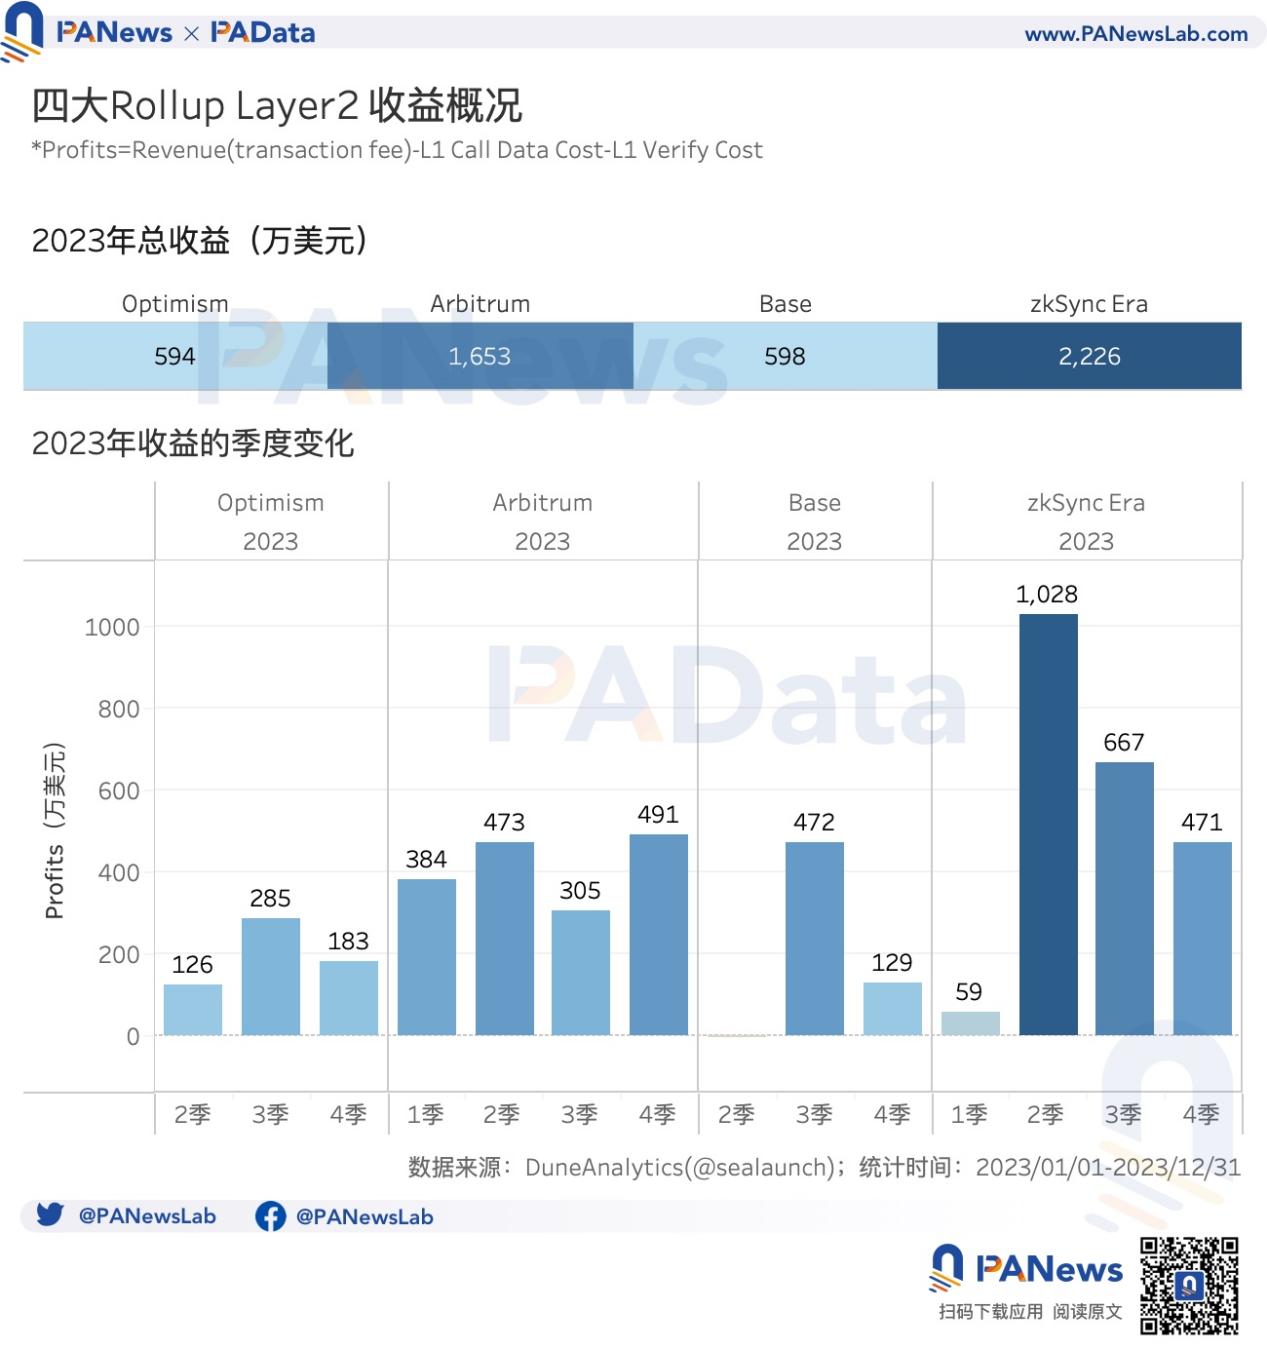
Moreover, L2 revenue does not always correlate with transaction volume, since higher transaction counts often mean higher DA costs. For instance, zkSync Era’s peak revenue came in Q2, not during the inscription-fueled Q4. Balancing fee income against DA costs may become a critical challenge for future L2 development.
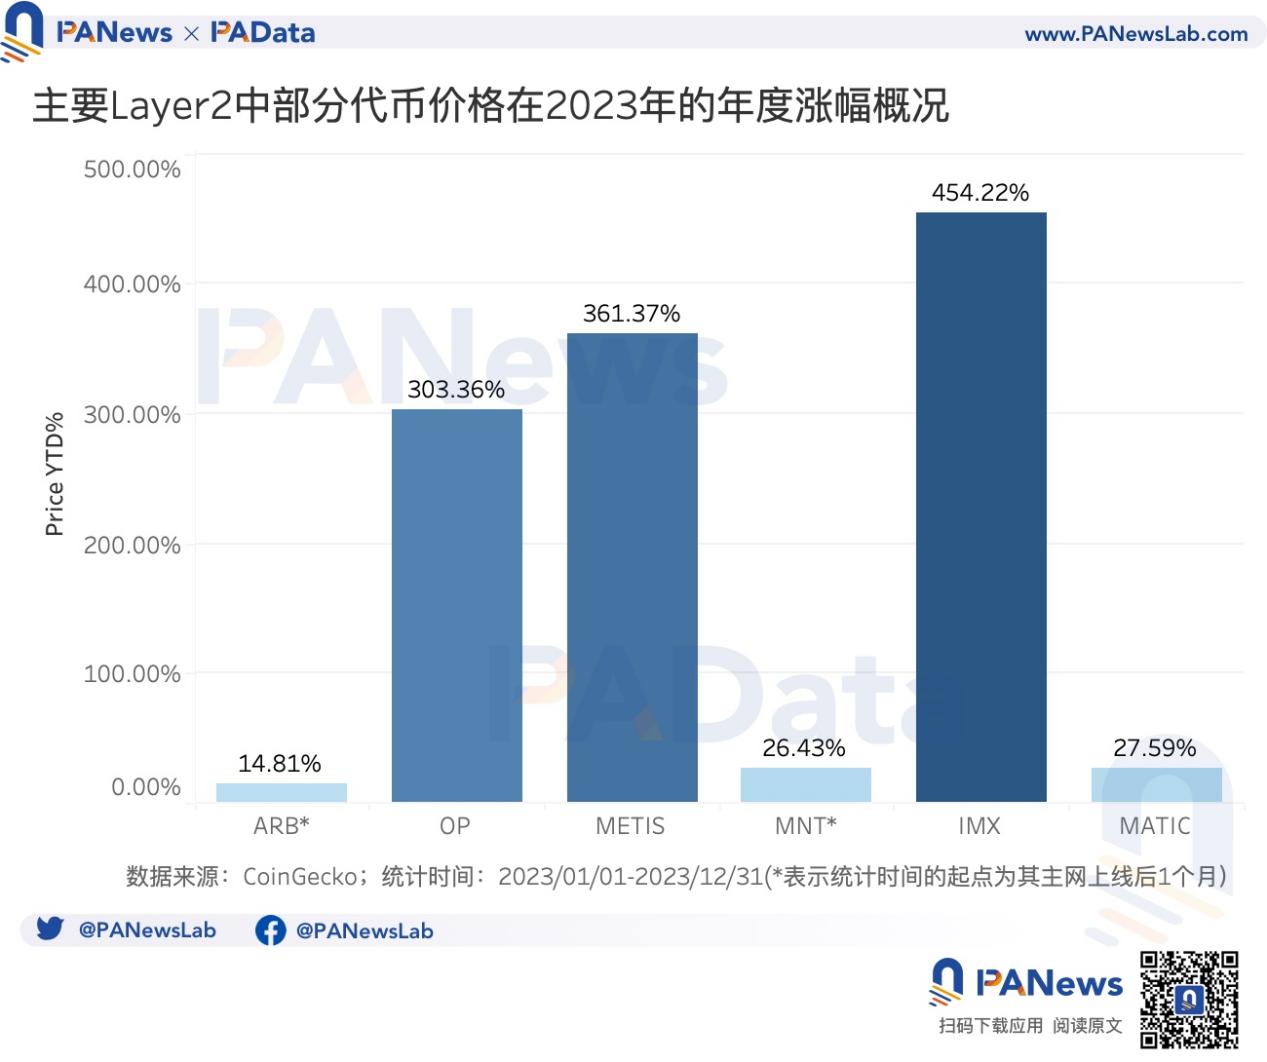
Mapping L2 growth onto token performance reveals some divergence. Among high-TVL L2s, few have issued tokens. In 2023, IMX saw the largest price increase—over 454%—followed by METIS and OP, both up over 300%. Despite strong fundamentals, ARB underperformed, rising only 14.81% for the year—lower than MNT and MATIC.
More L2 projects may launch tokens in 2024. How to balance fee revenue with DA costs and how to provide sustainable value for tokens will remain key challenges ahead.
Join TechFlow official community to stay tuned
Telegram:https://t.me/TechFlowDaily
X (Twitter):https://x.com/TechFlowPost
X (Twitter) EN:https://x.com/BlockFlow_News
 PANews











