

Data Behind BTC's Rise: Supply Tightens as Long-Term Holders Show Clear Intent to HODL
TechFlow Selected TechFlow Selected
Data Behind BTC's Rise: Supply Tightens as Long-Term Holders Show Clear Intent to HODL
Despite strong price performance this year, Bitcoin continues to be held long-term.
Written by: Glassnode, UkuriaOC
Compiled by: TechFlow
Bitcoin supply has historically been tight, with long-term holders owning a record-high amount of BTC, and the accumulation pace remains impressive. In this article, we explore this situation using several on-chain supply heuristics and metrics.
Gradual Growth in Bitcoin Long-Term Holders
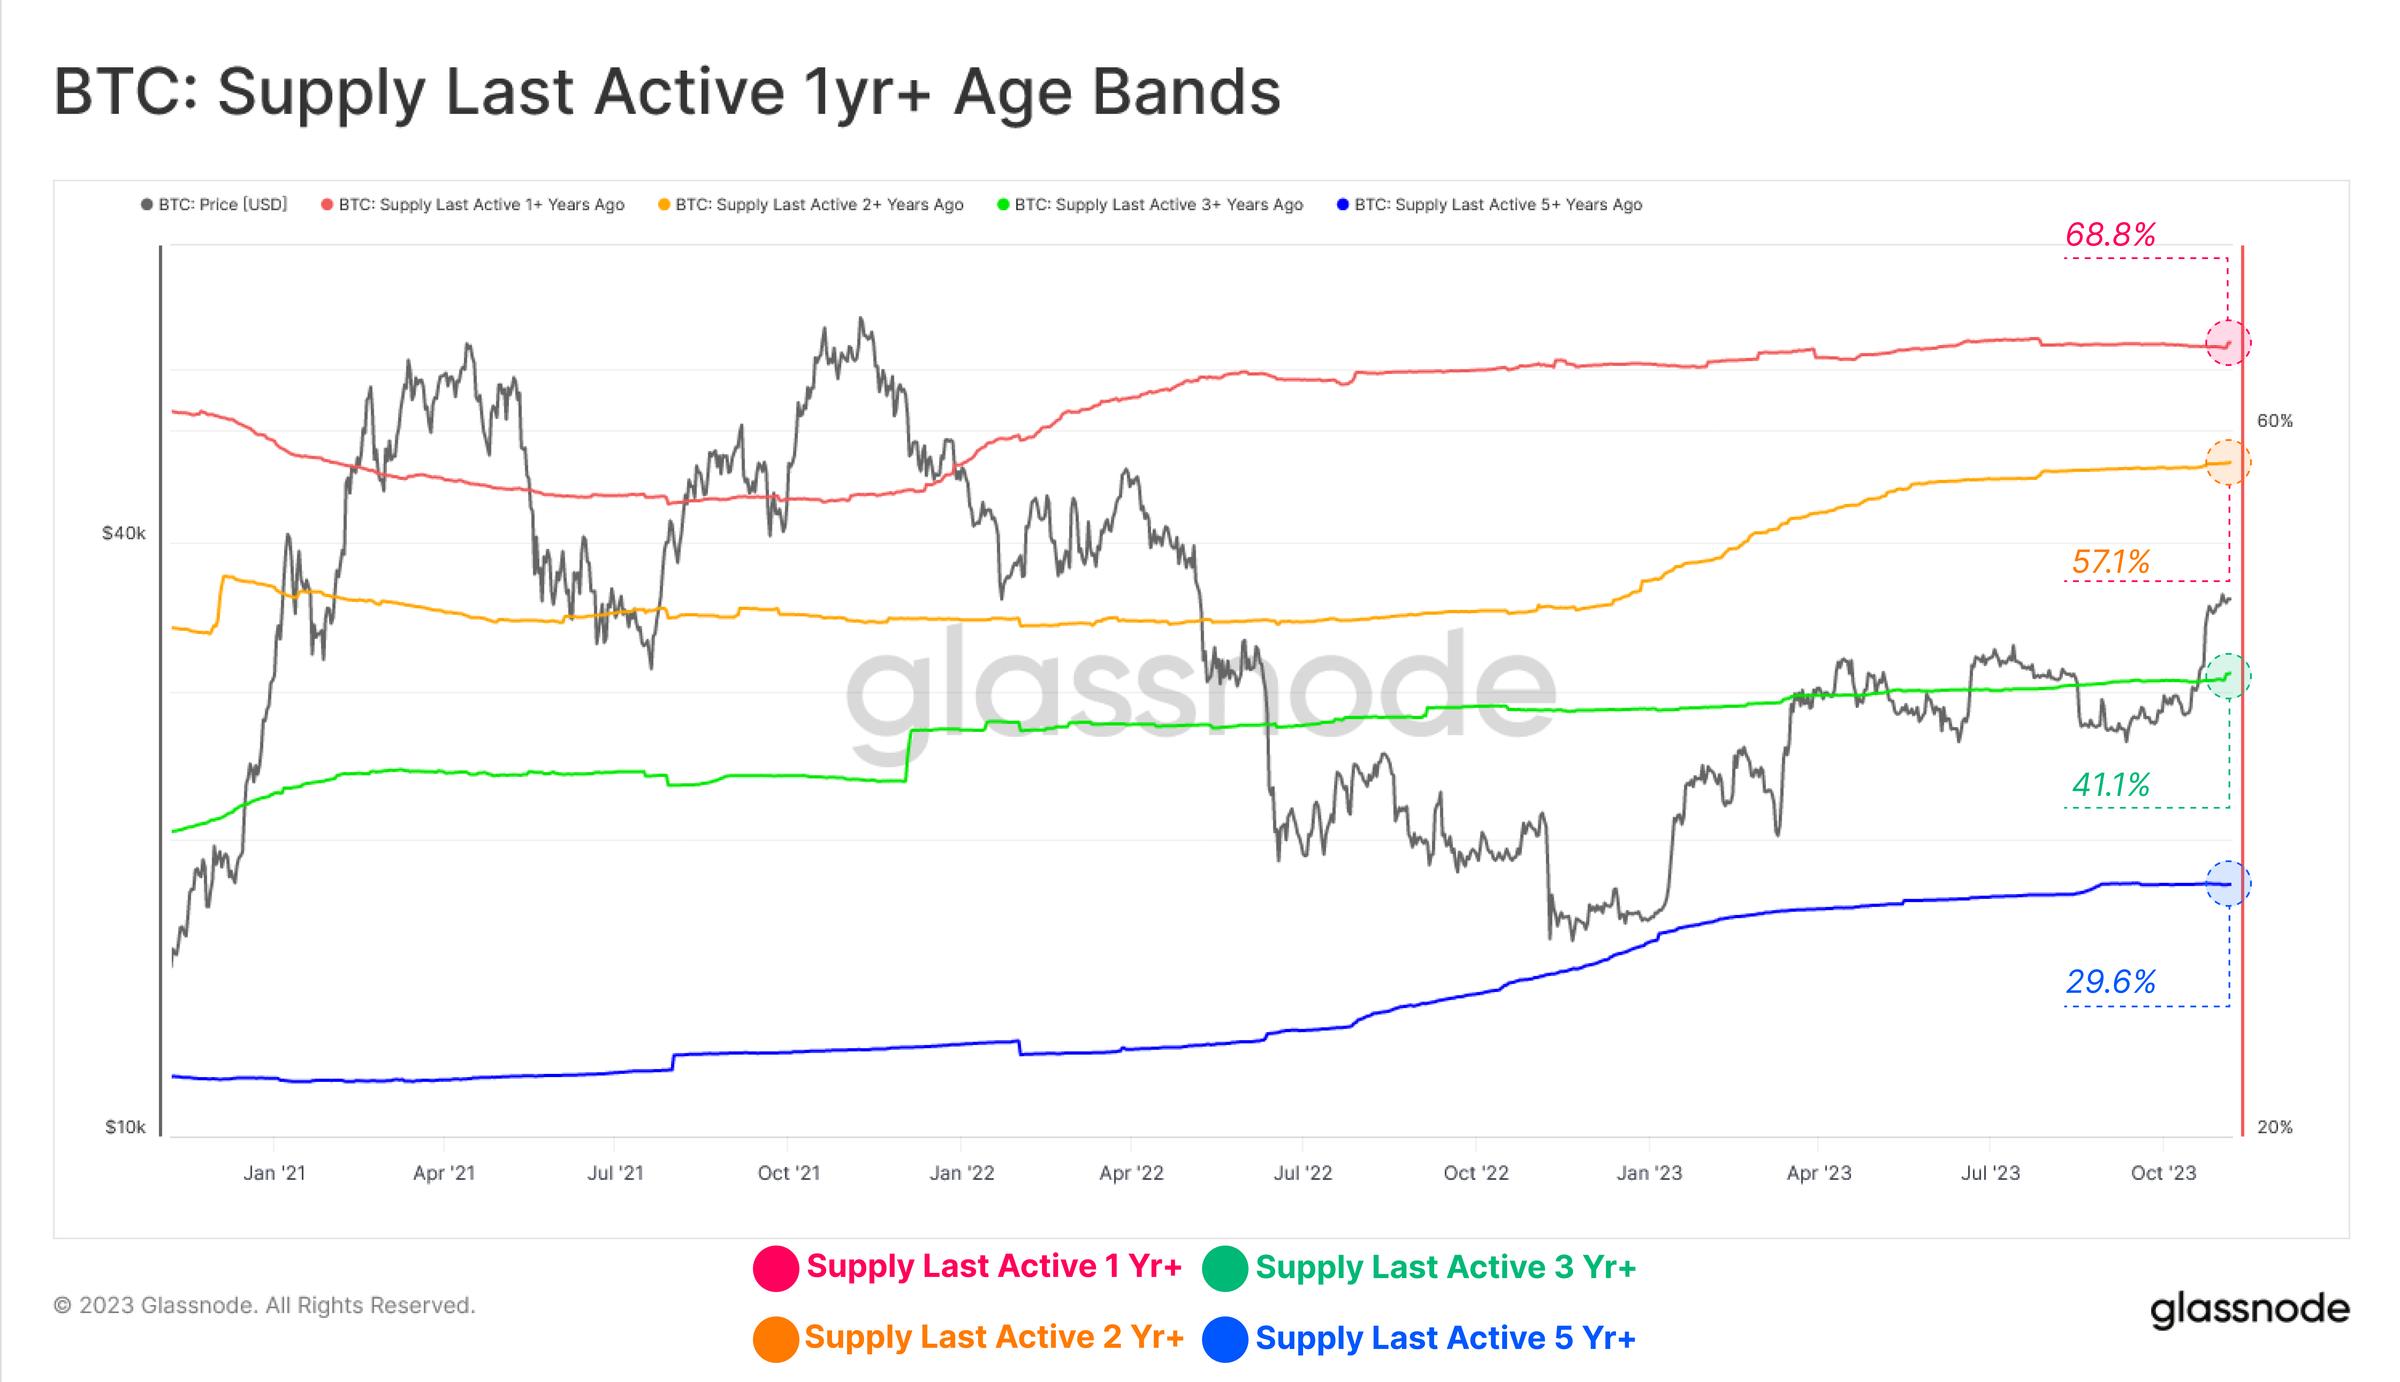
Digital asset price performance has been impressive this year, as we reported last week (see WoC Issue 44). Nevertheless, long-term Bitcoin investors have continued to hold, with the relative proportion of circulating supply last active over one year ago hovering near all-time highs across multiple timeframes.
-
🔴 Supply last active within the past 1 year: 68.8%
-
🟡 Supply last active within the past 2 years: 57.1%
-
🟢 Supply last active within the past 3 years: 41.1%
-
🔵 Supply last active within the past 5 years: 29.6%
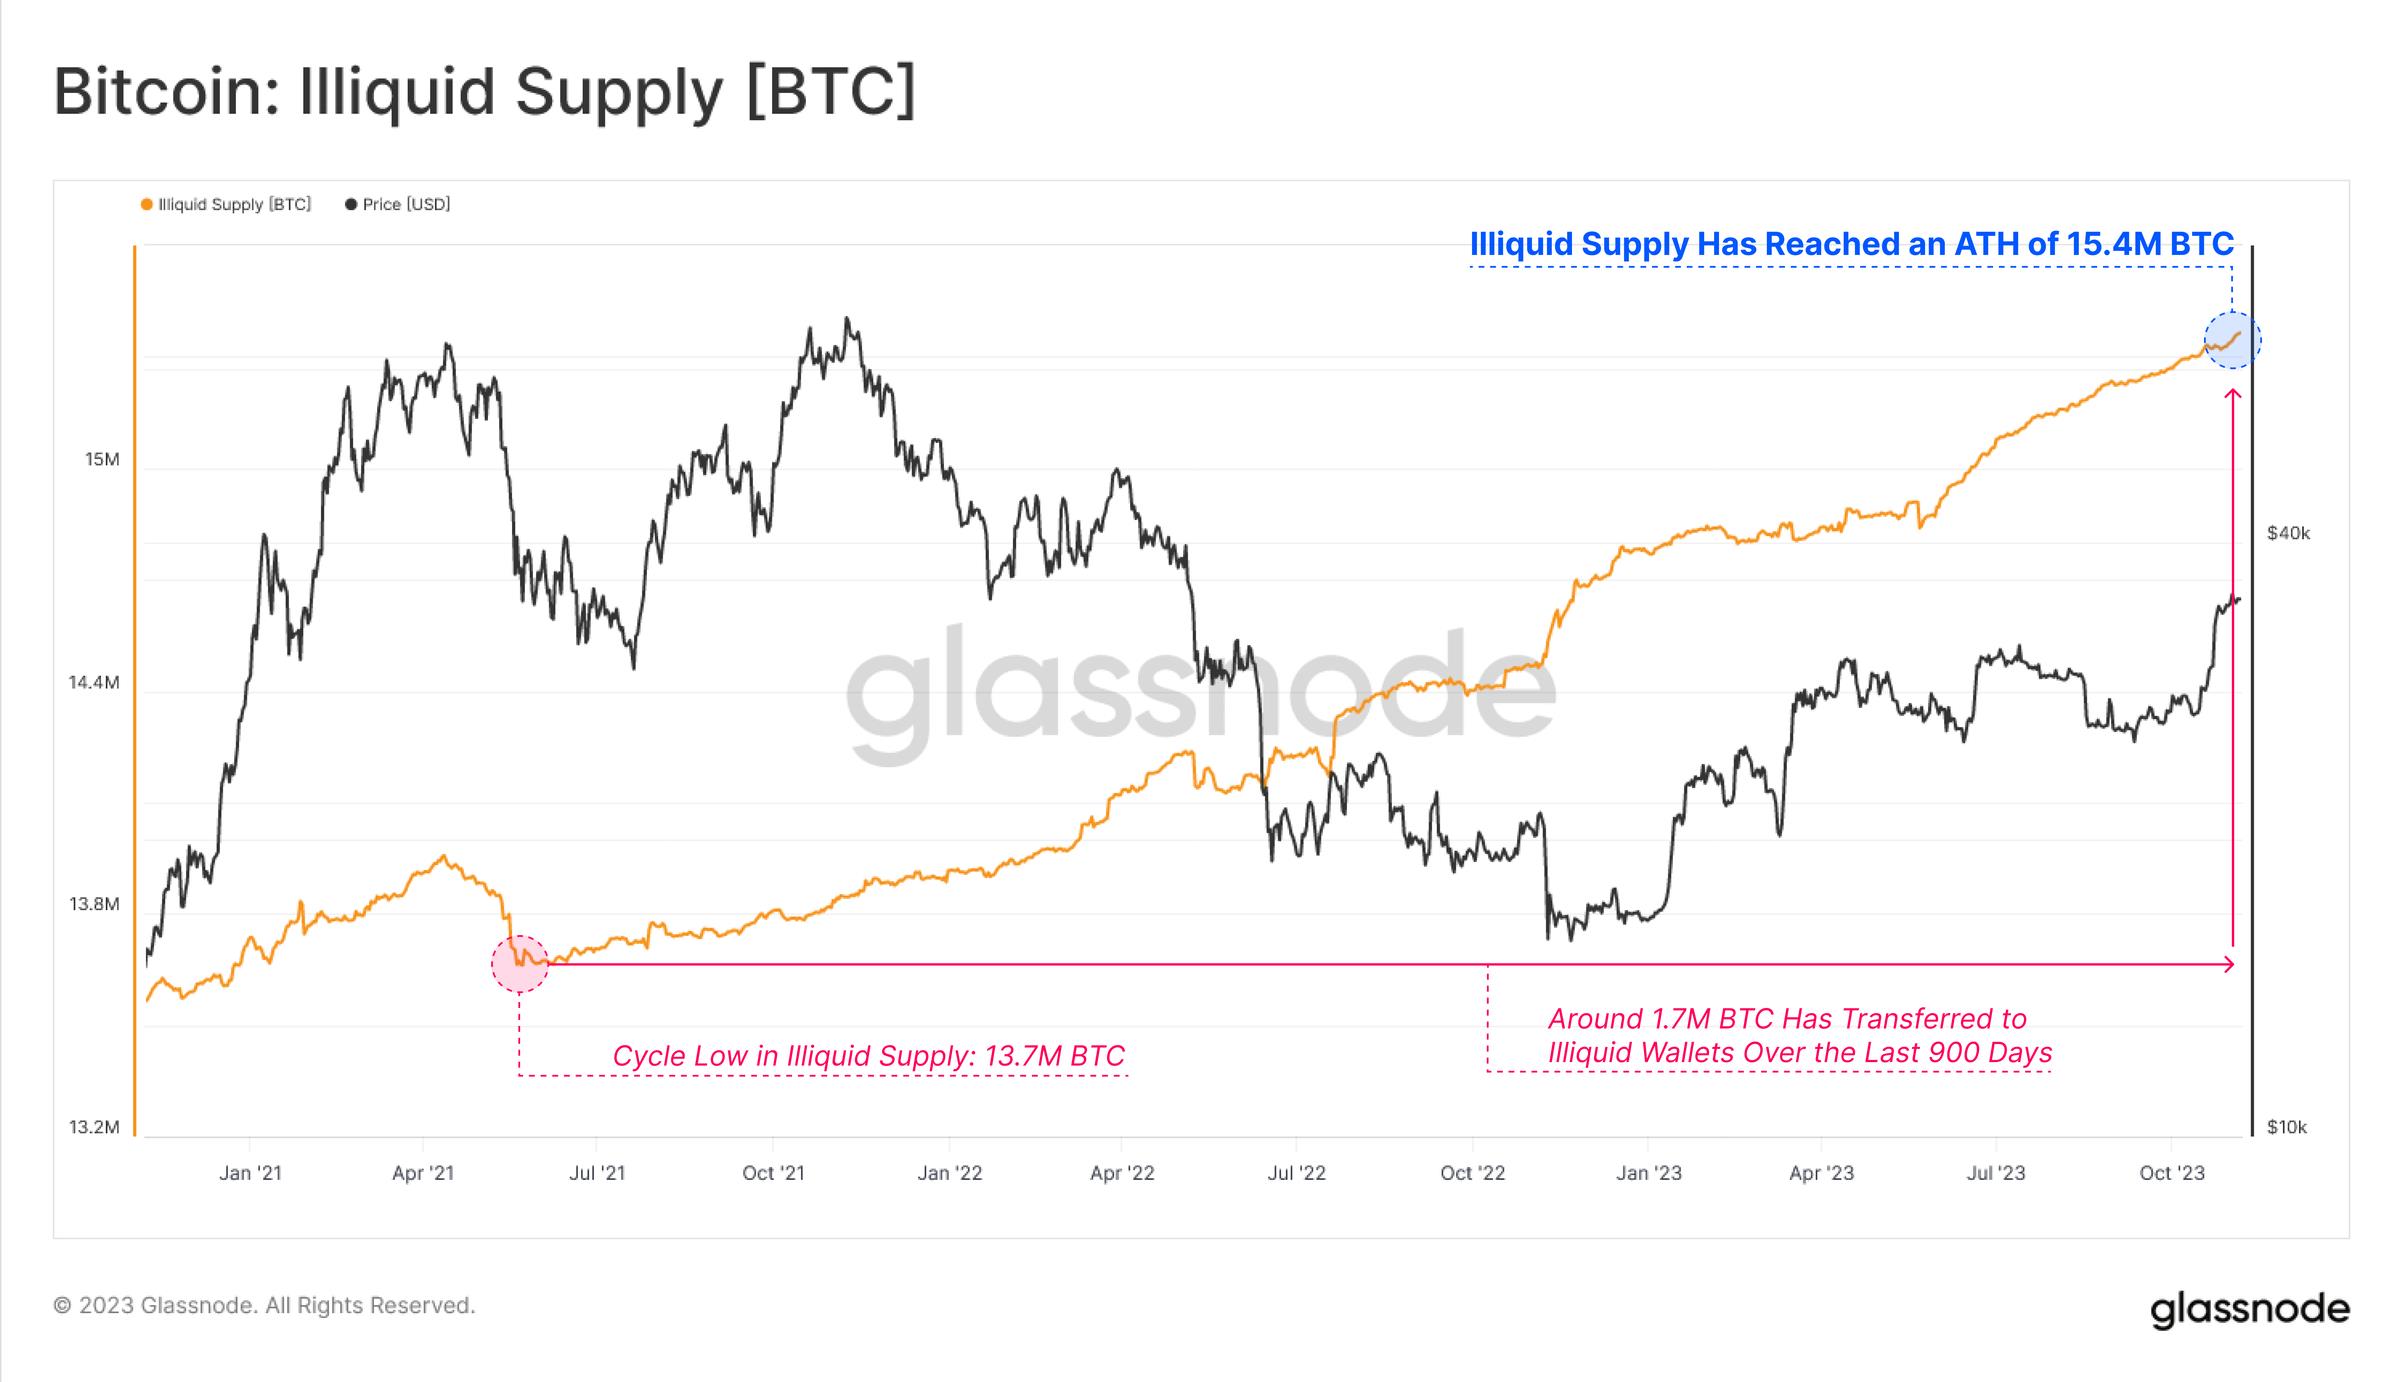
The illiquid supply metric, which measures supply held in wallets with the least spending history, has also reached an all-time high of 15.4 million BTC. Changes in illiquid supply often coincide with exchange withdrawals, indicating that investors continue moving their Bitcoin into self-custody wallets—over 1.7 million BTC have been withdrawn since May 2021.
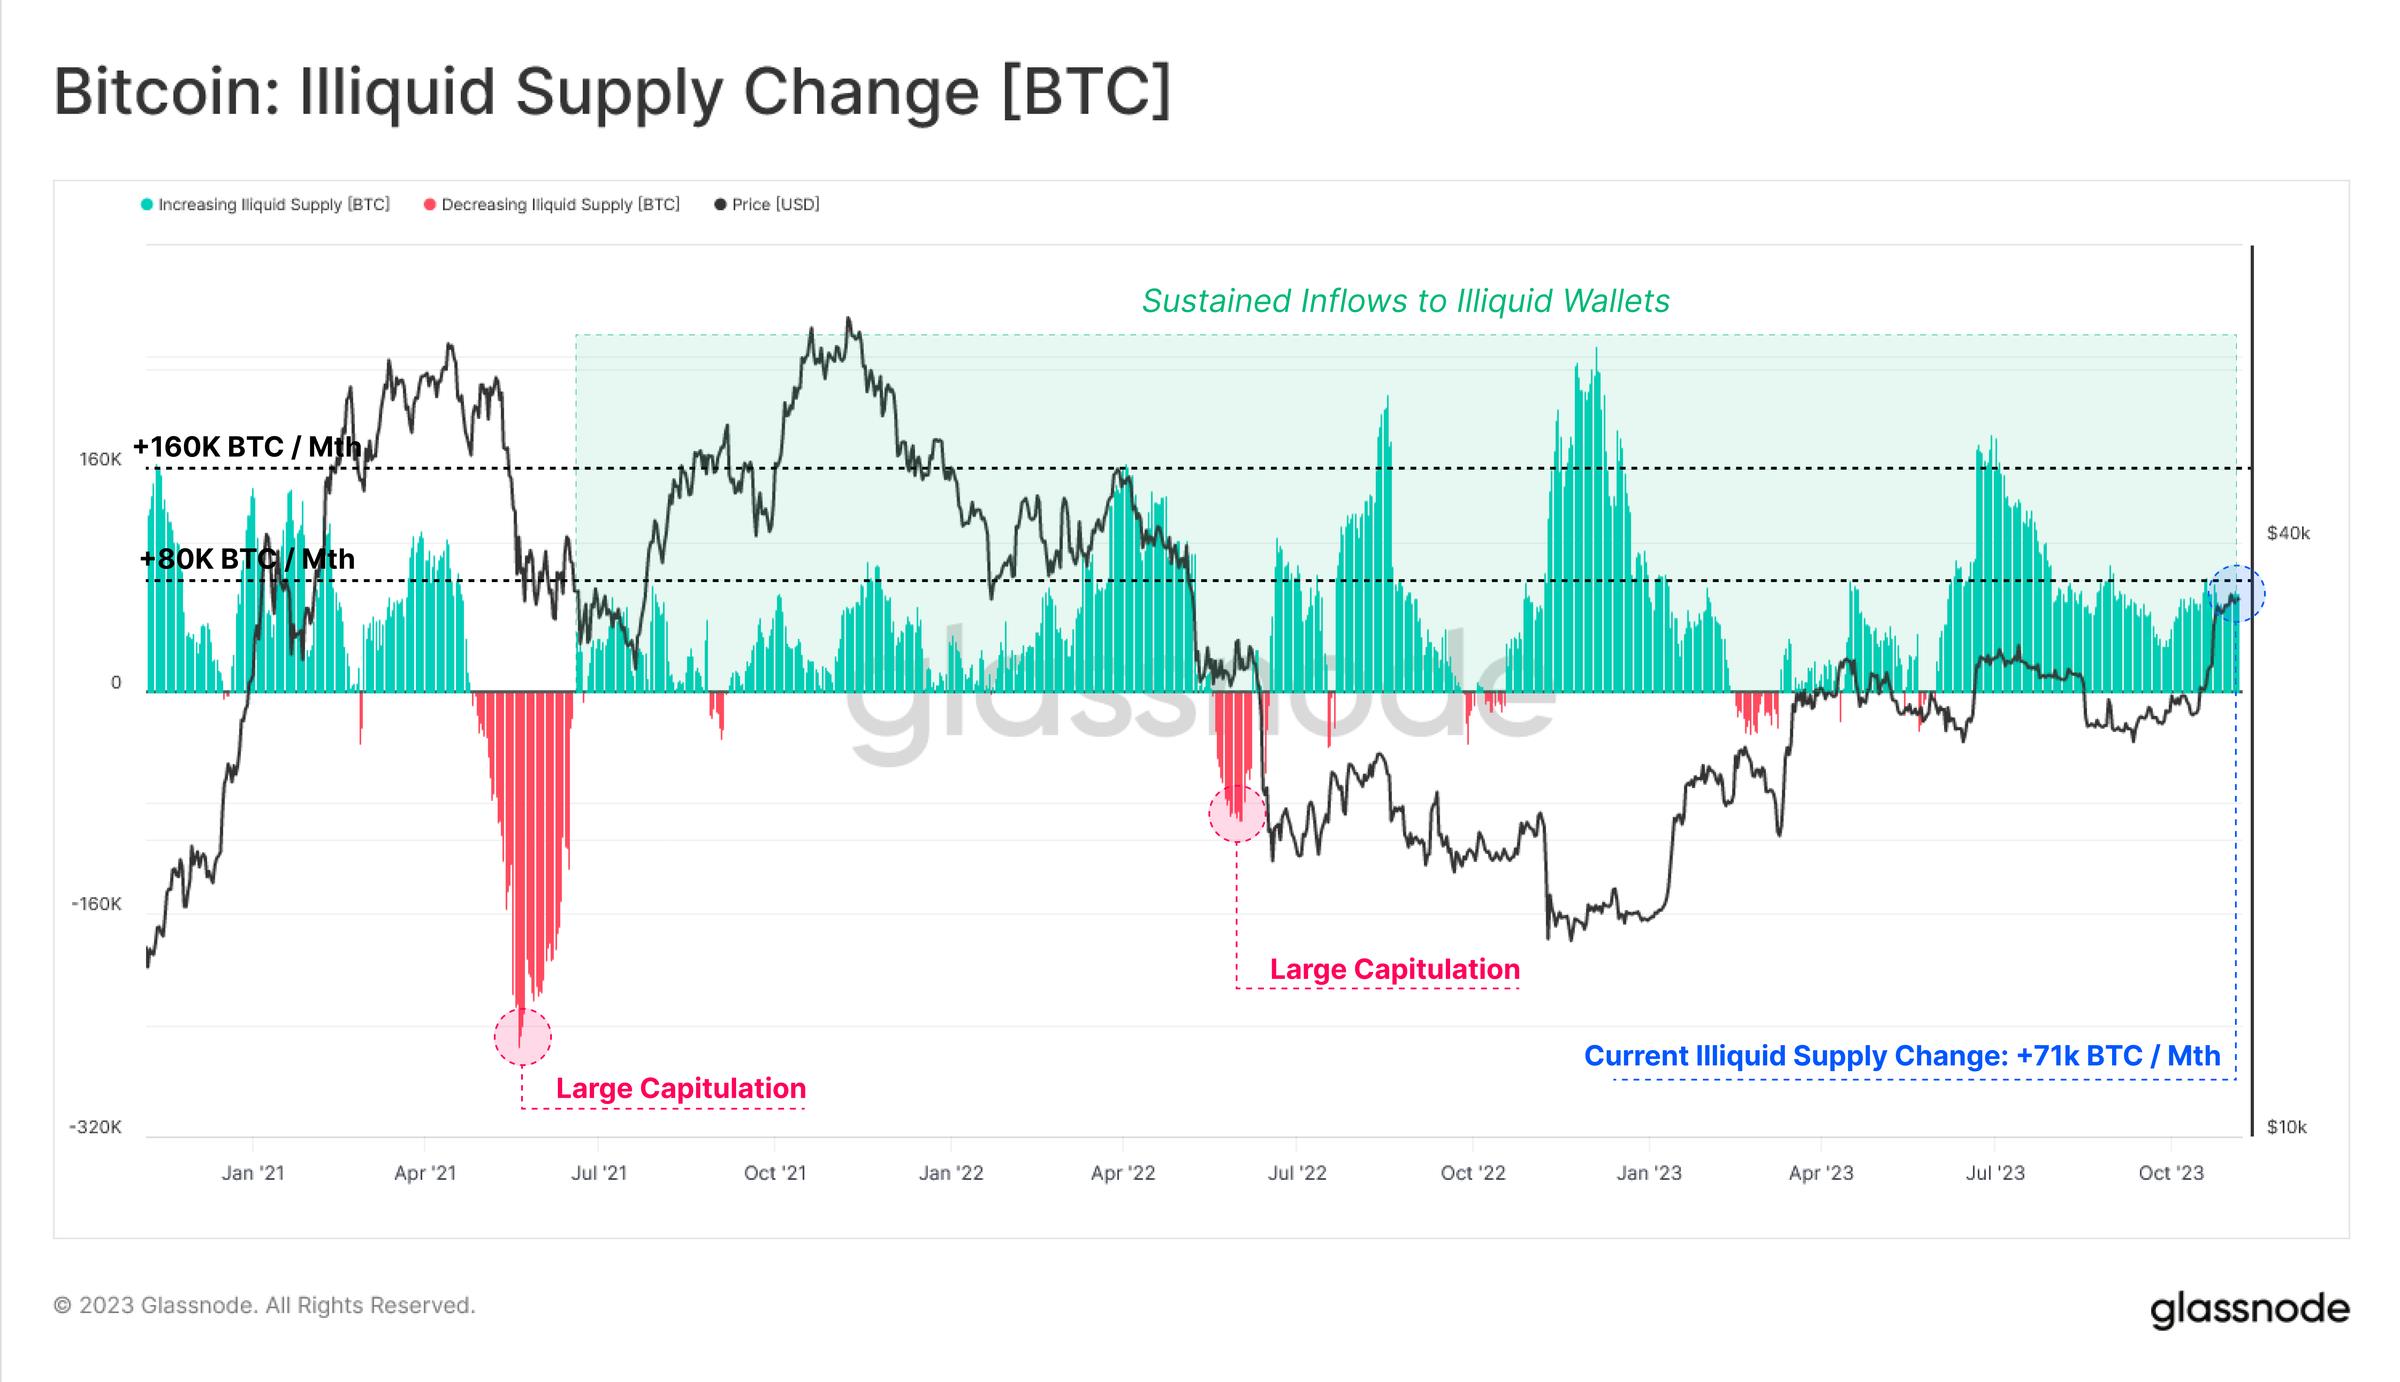
This is reflected in the monthly net change rate of illiquid supply, which is currently in a prolonged phase of net growth not seen in years.
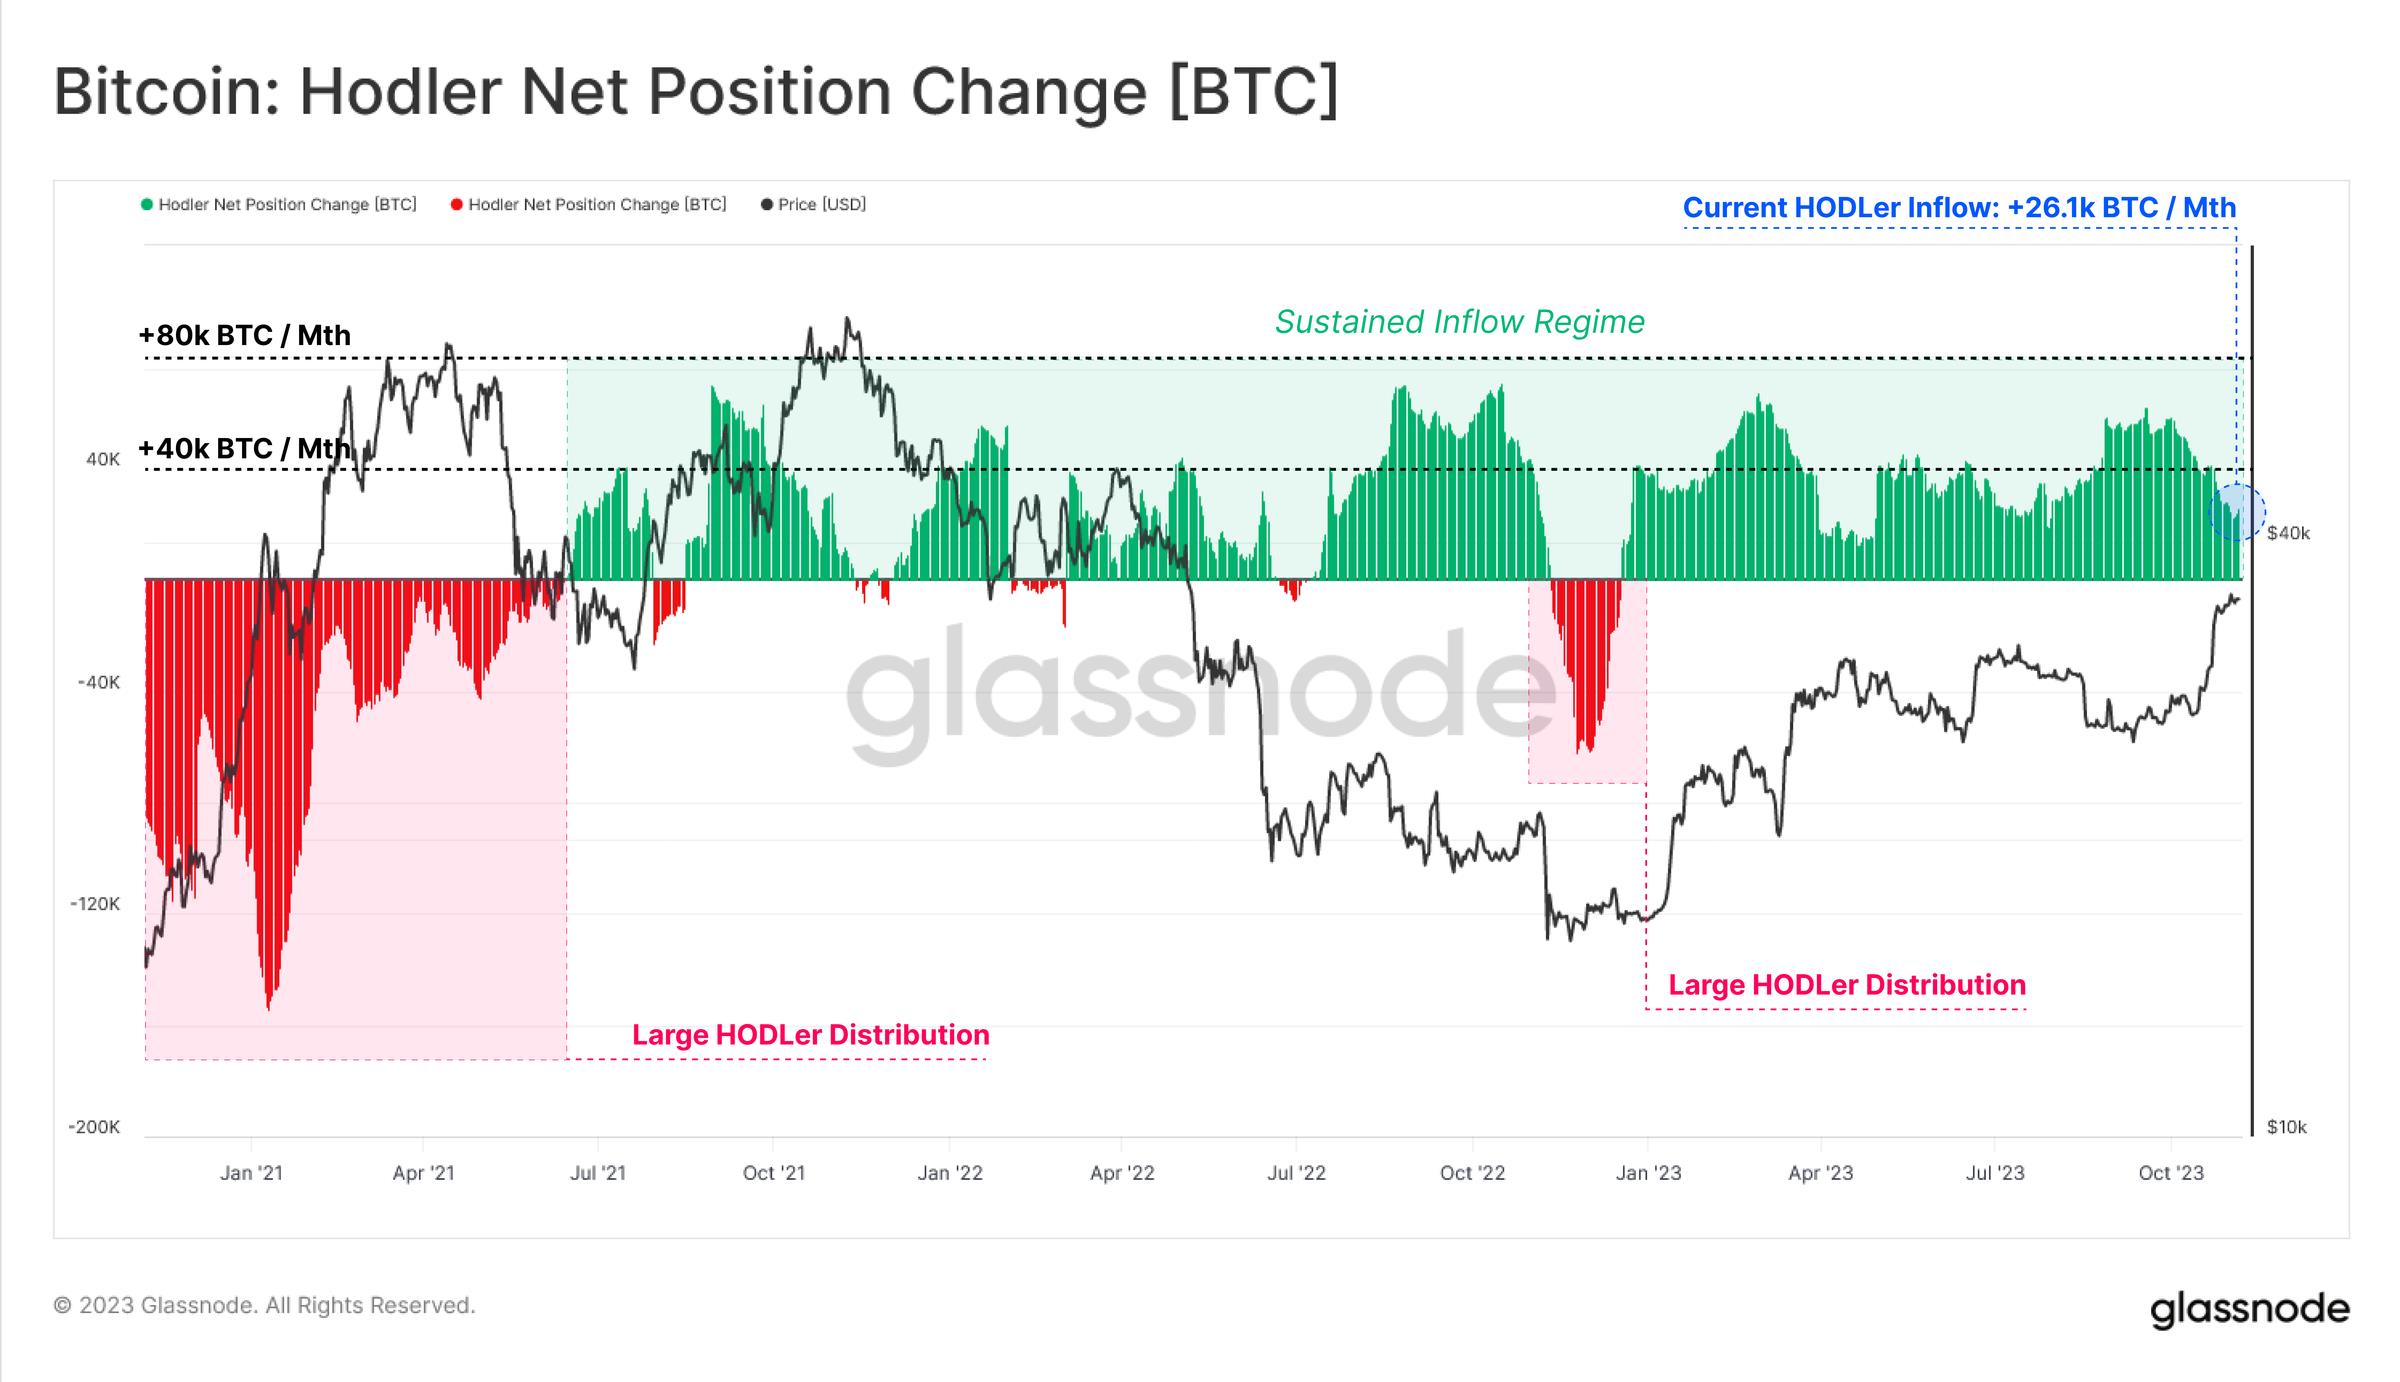
A similar pattern appears in the "Holder Net Position Change" metric. Vaulted Supply has experienced sustained inflows since June 2021, particularly following the sharp sell-off in June 2022 during the collapse of 3AC and LUNA-UST.
This metric reflects the overall trend in Bitcoin supply as investors accumulate and hold their BTC, avoiding trading activity.
Divergence in Conviction
The supply held by long-term holders (LTH) 🔵 is near all-time highs, while the supply held by short-term holders (STH) 🔴 is nearly at historic lows. This intriguing dynamic highlights increasing scarcity in Bitcoin's supply, as existing holders grow increasingly reluctant to sell.
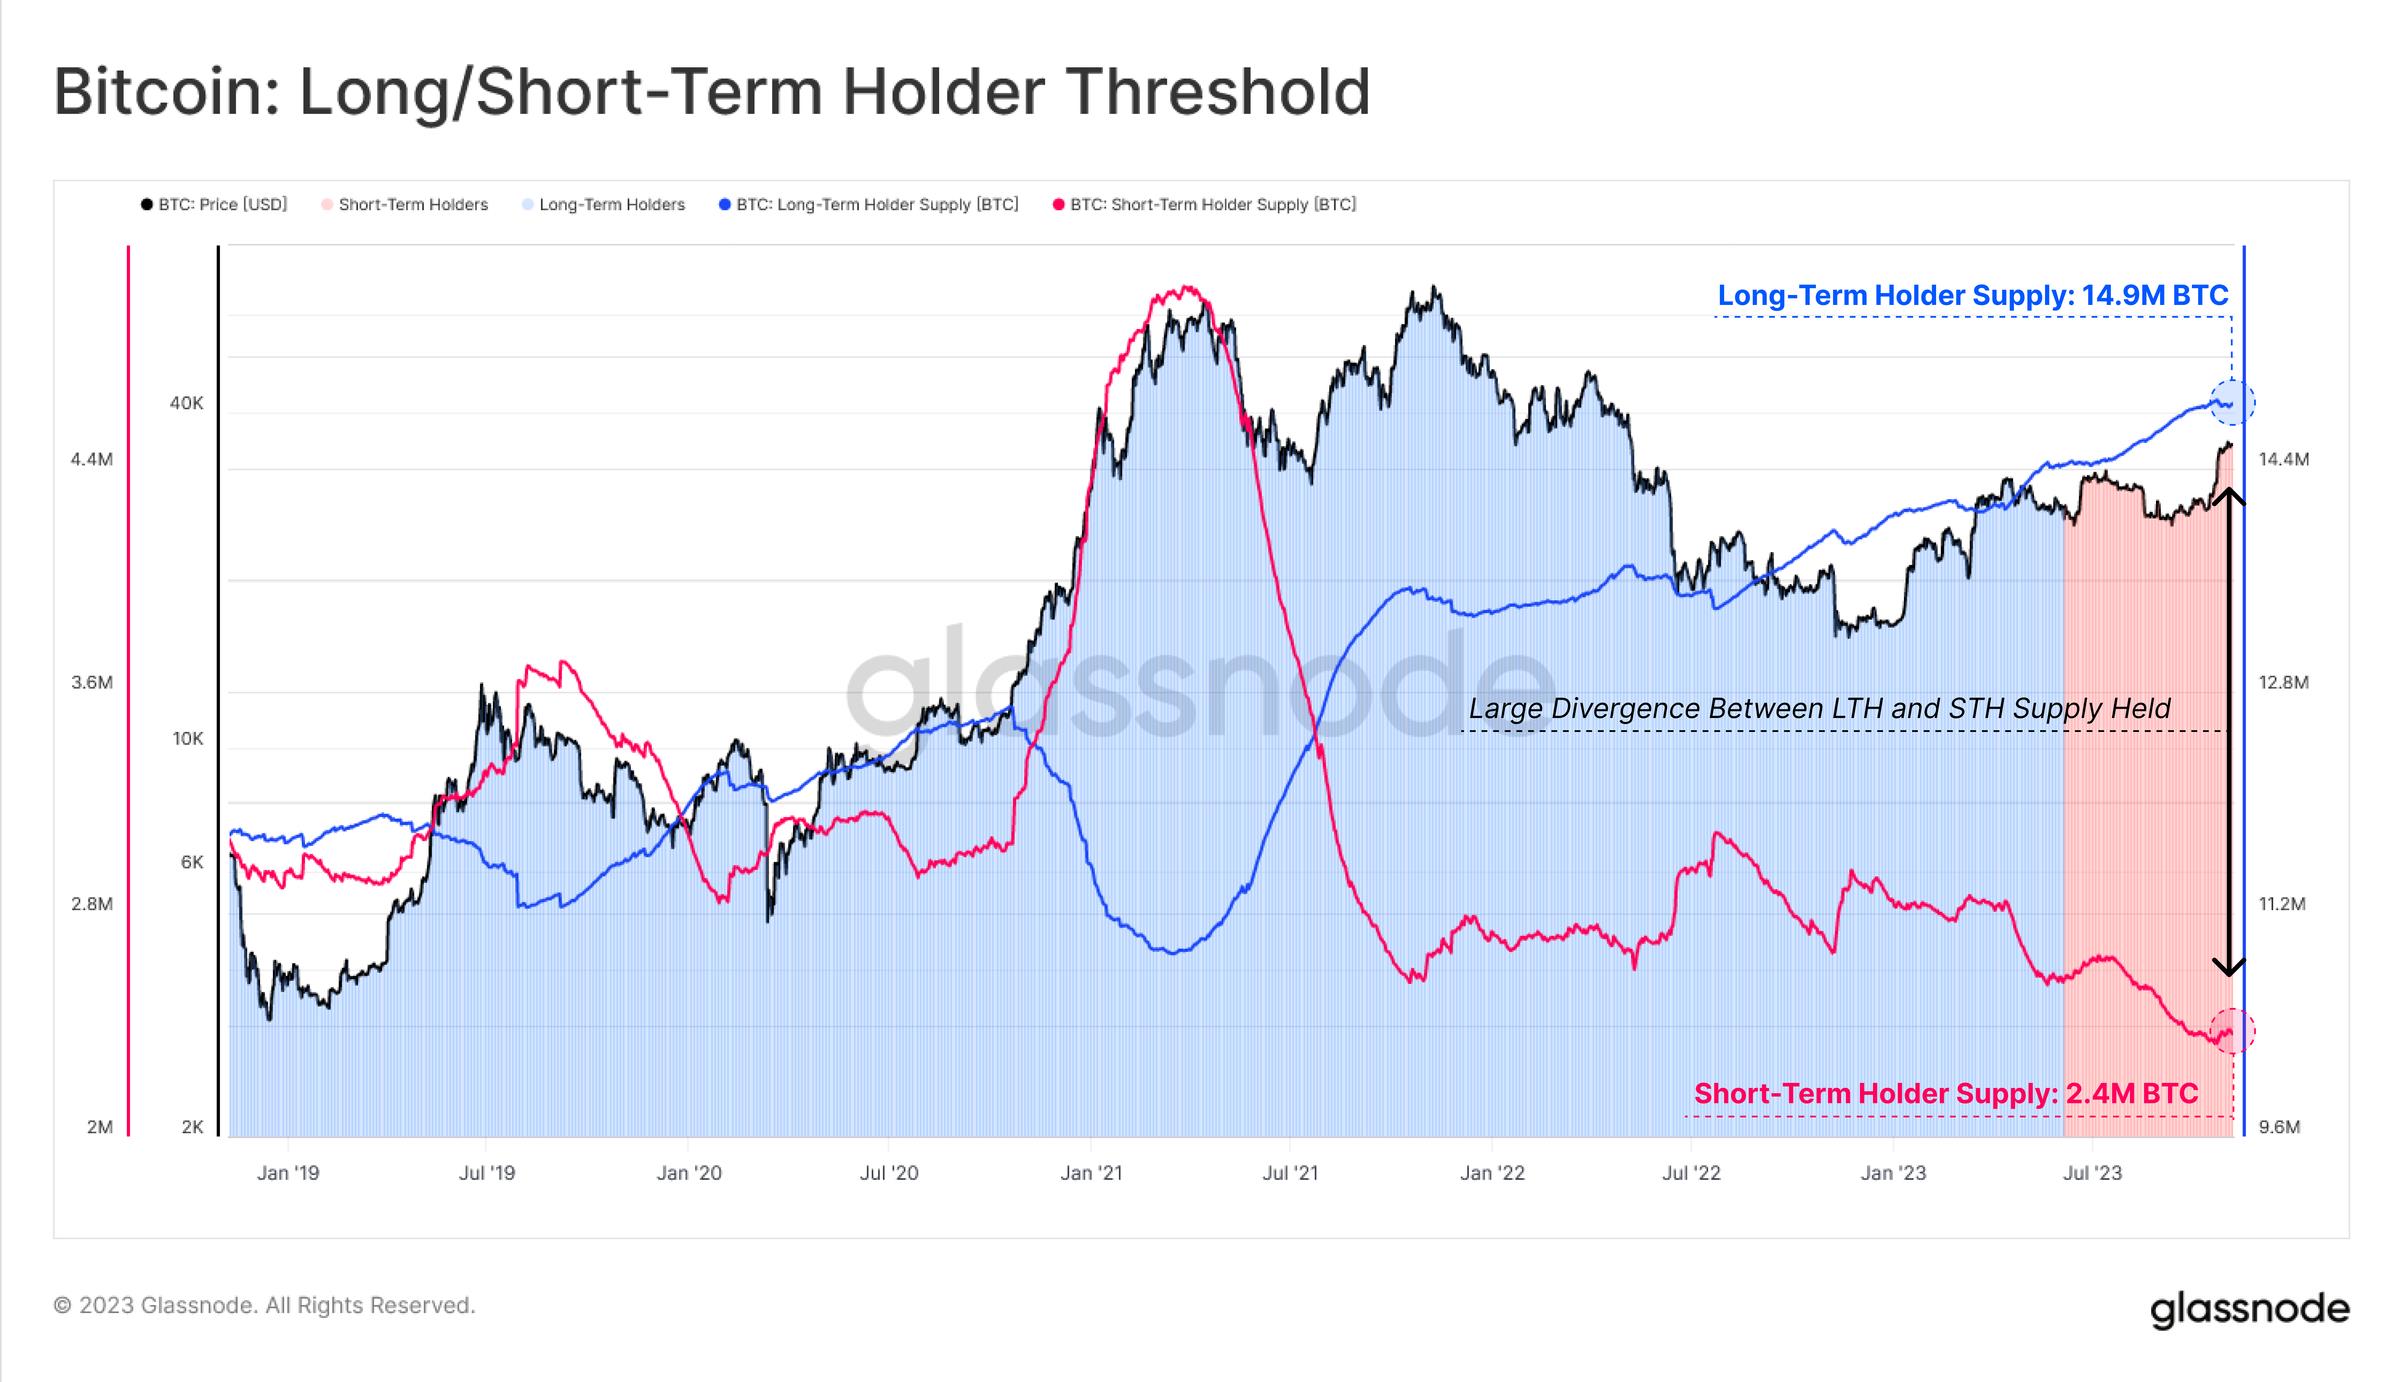
As discussed in our previous report, LTHs typically wait until prices break new all-time highs before increasing distribution. This was evident during the 2021 bull run when LTH supply declined sharply, STH supply rose correspondingly, and exchange inflows surged.
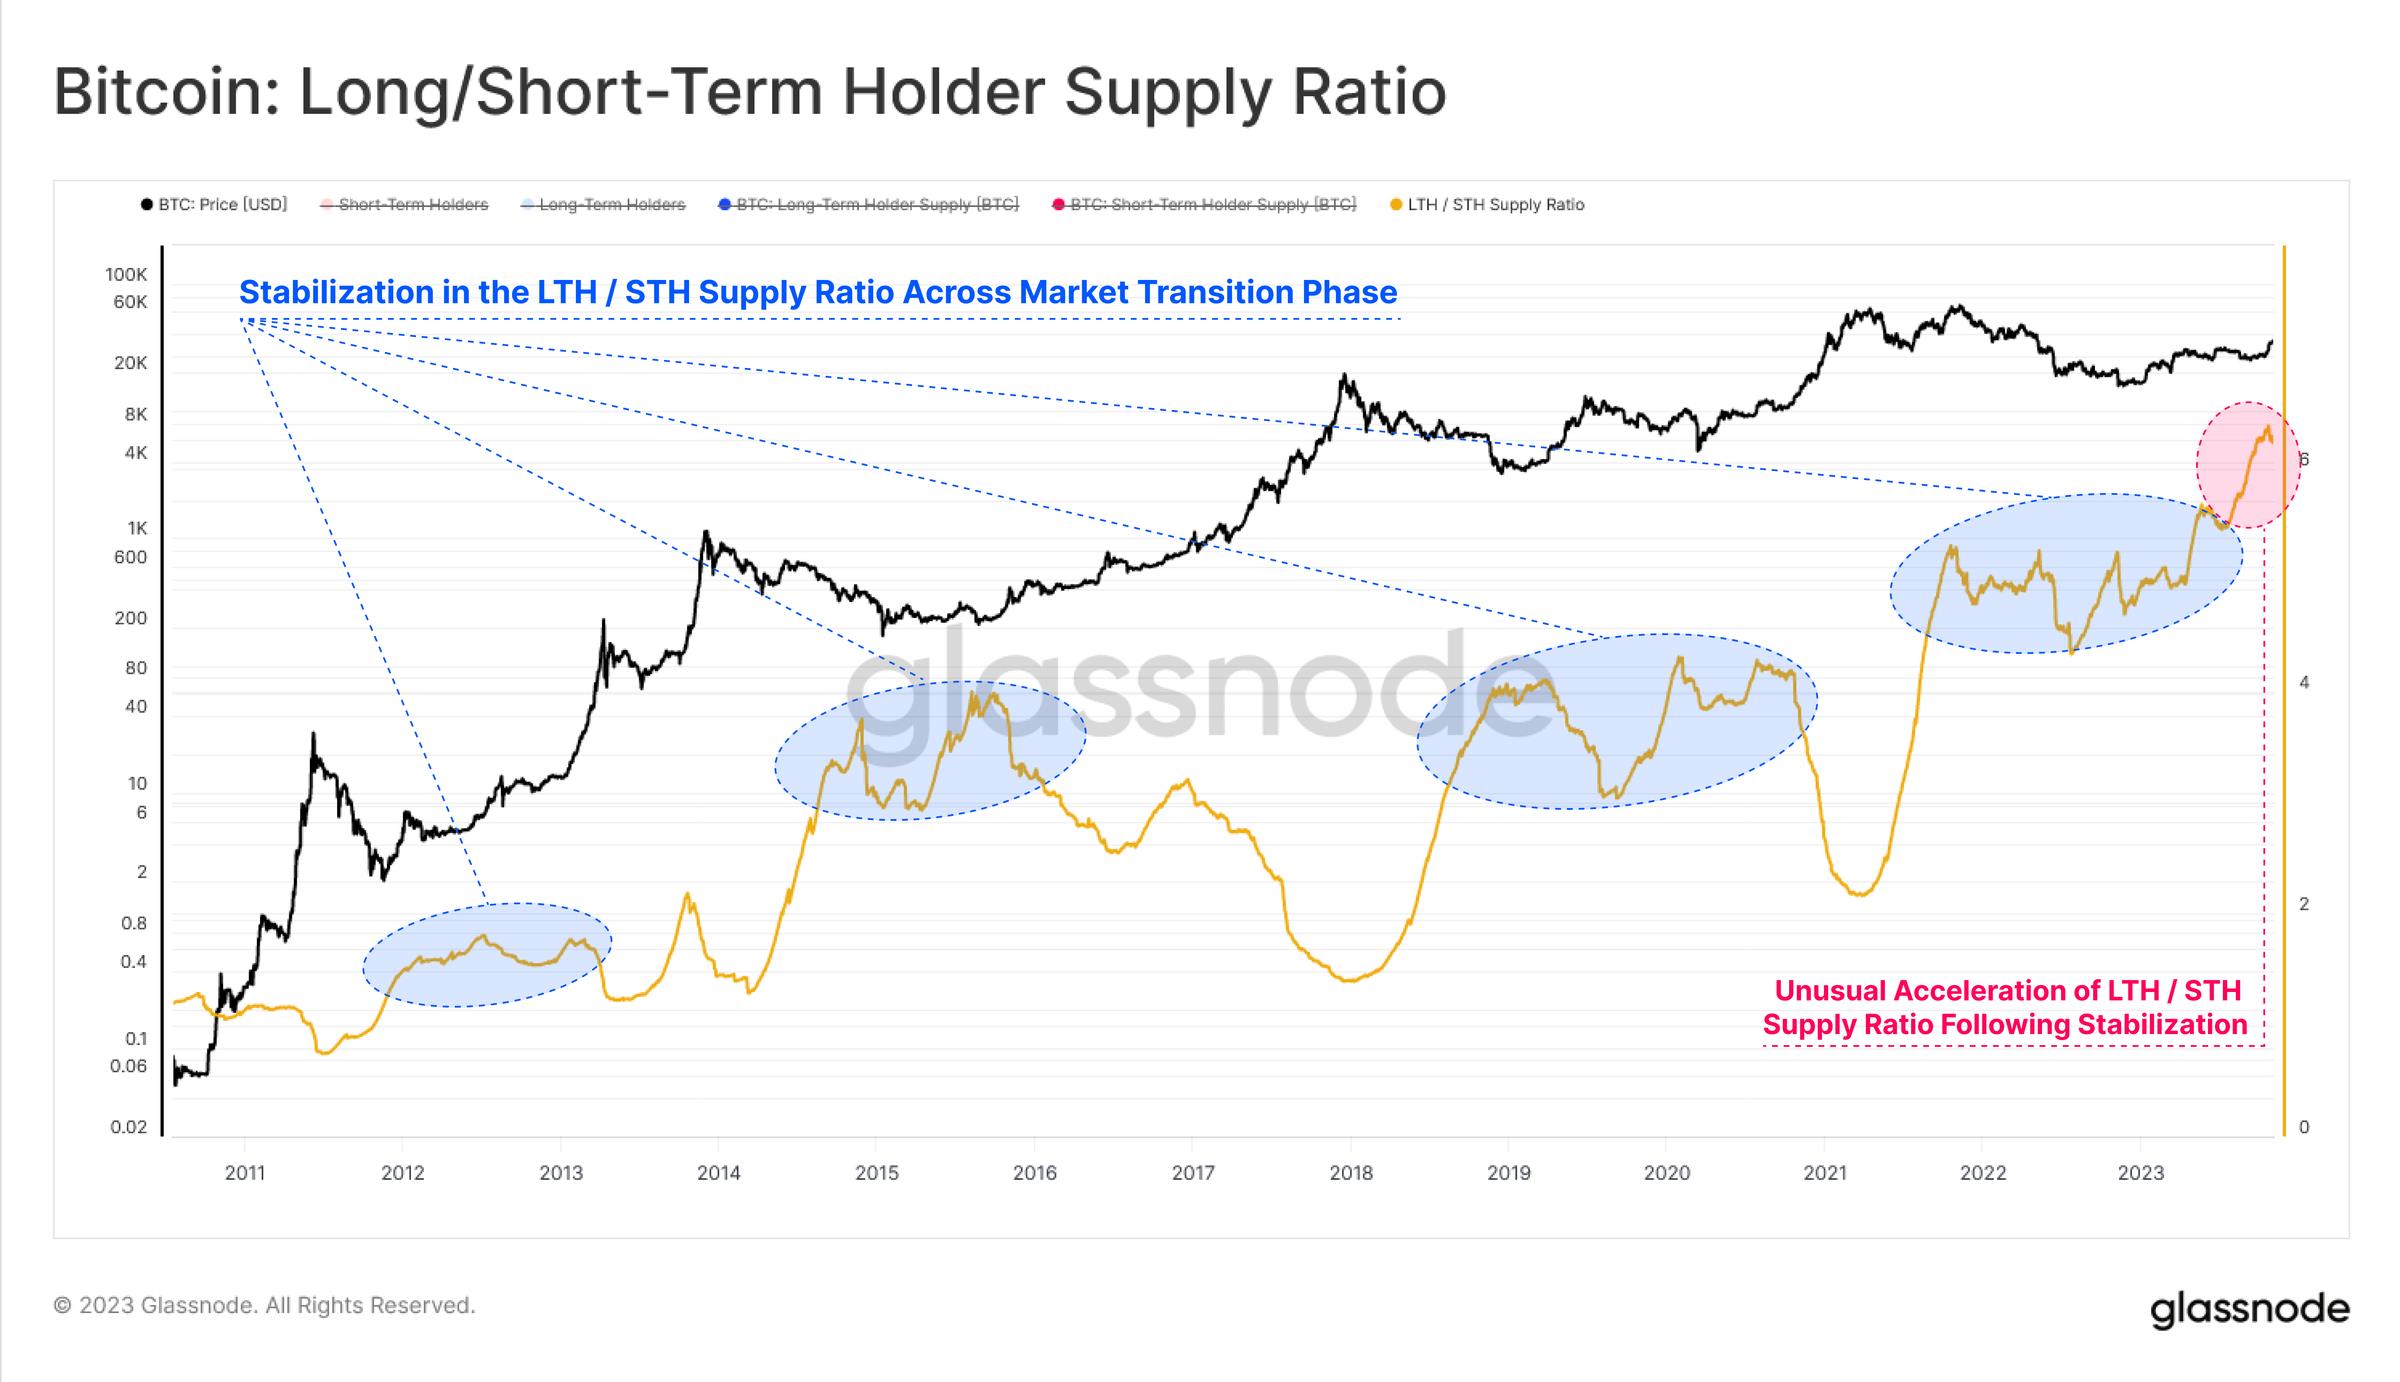
If we calculate the ratio between long-term and short-term holder supply, it has reached a new all-time high since July 2023. This clearly illustrates the degree of divergence between dormant and active supply, underscoring significant supply tightness.
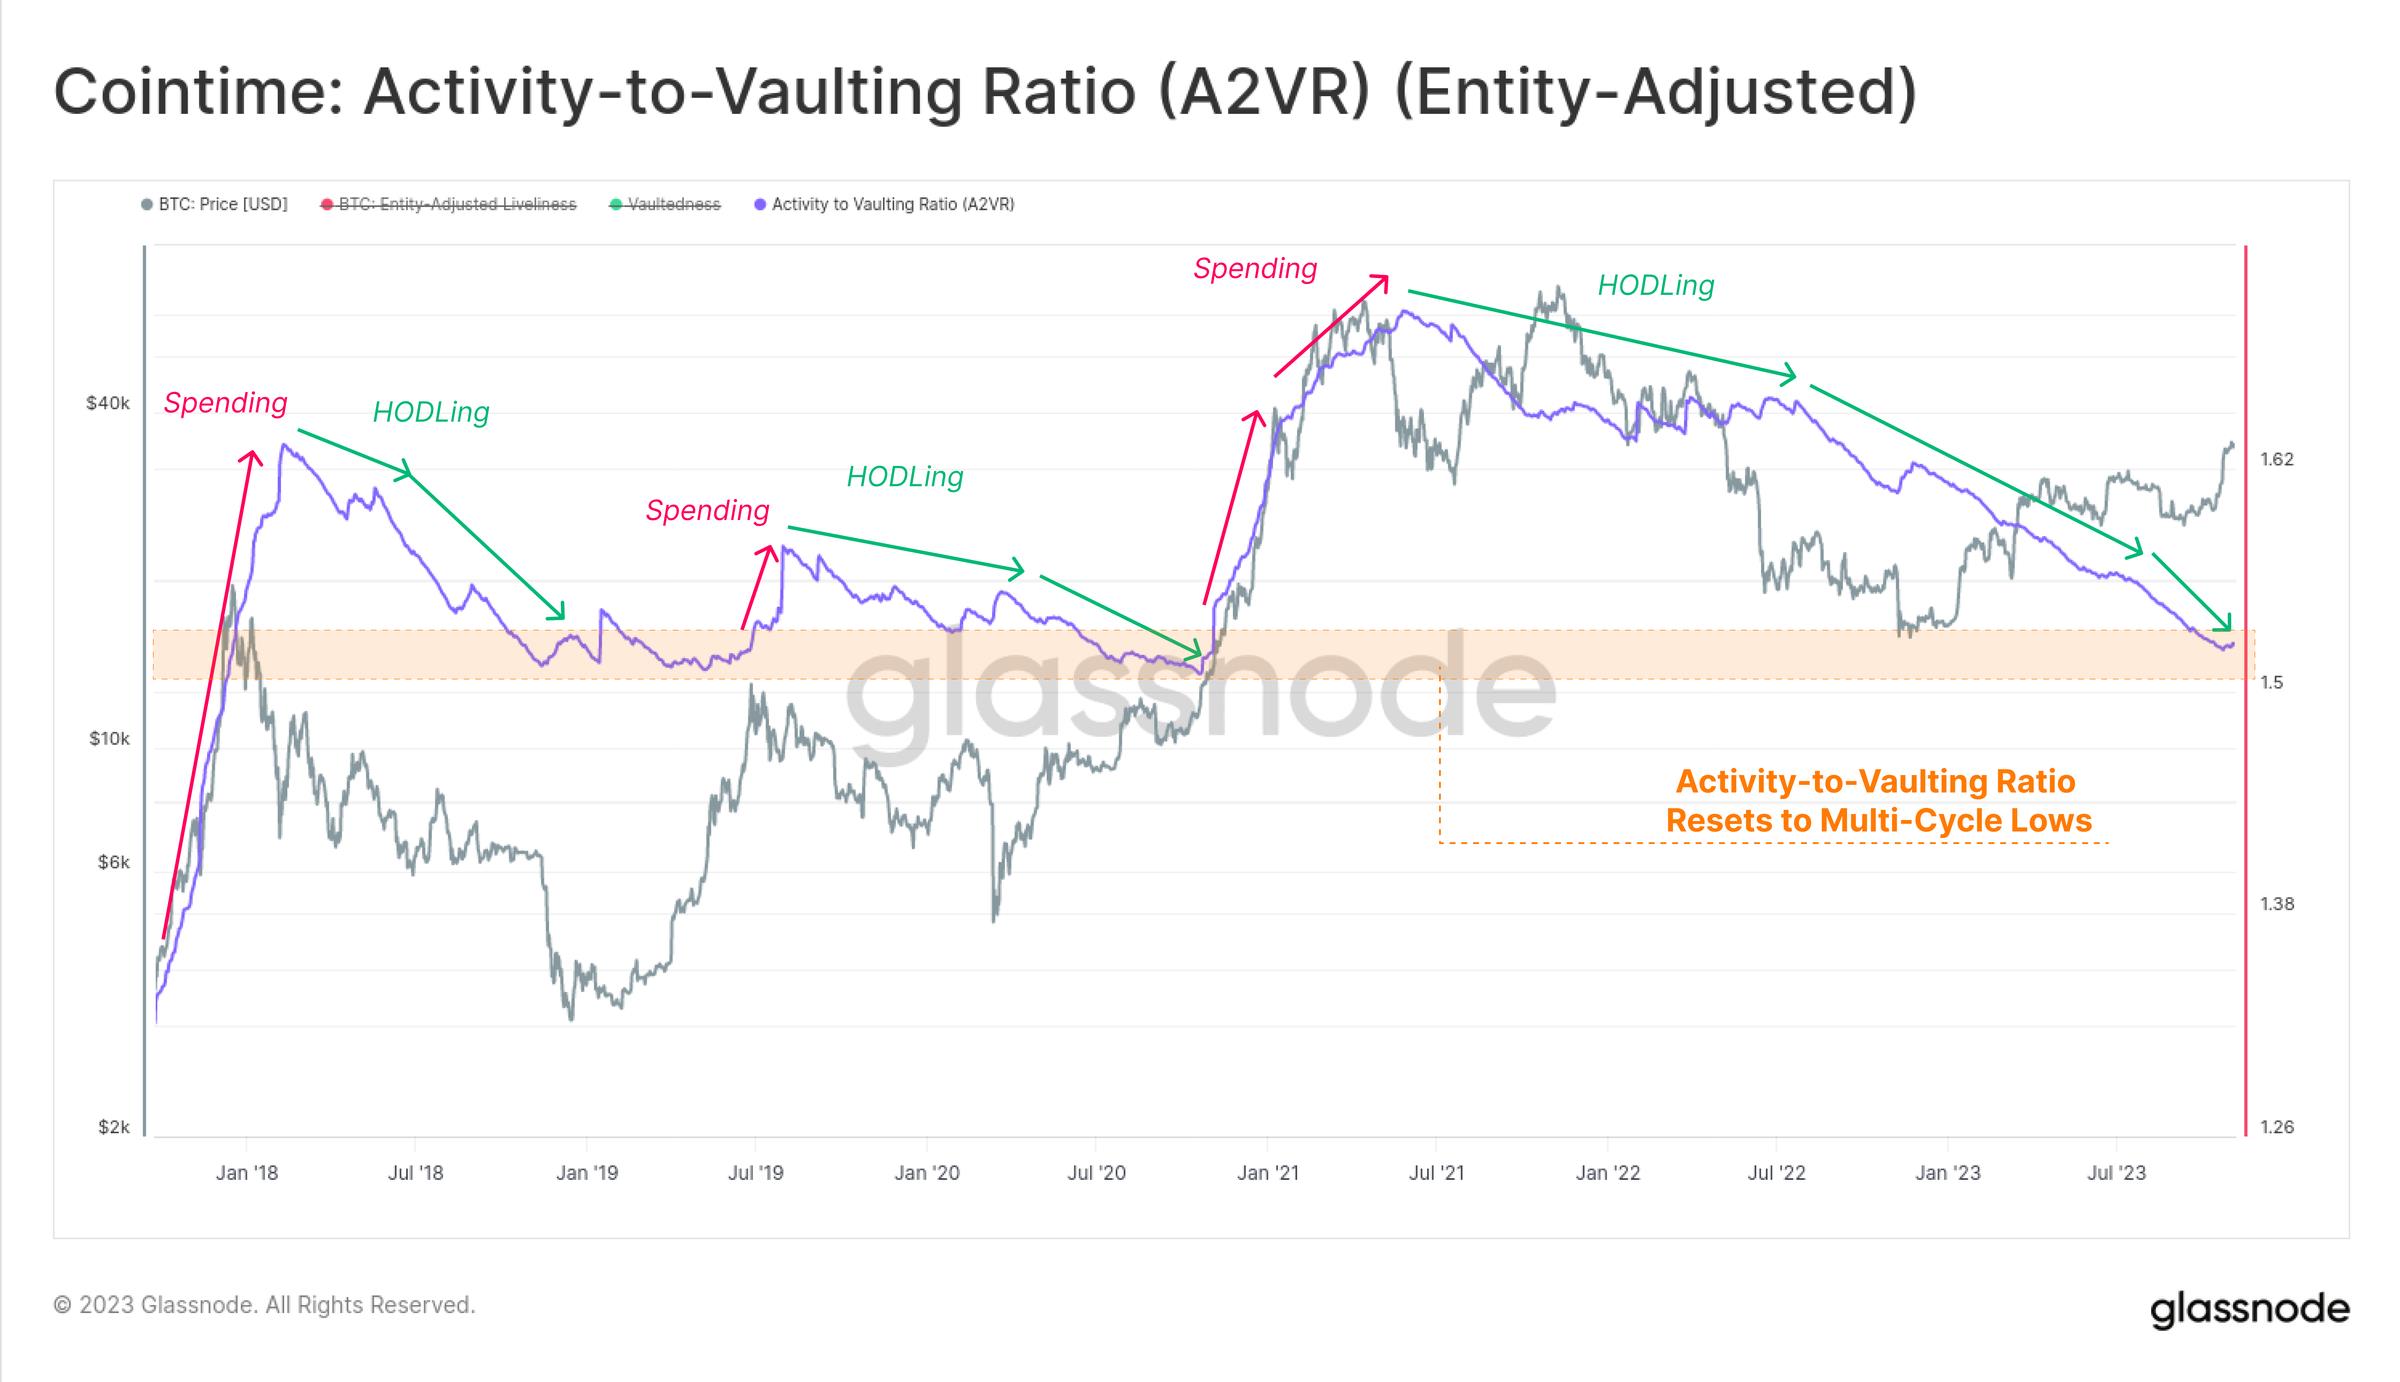
The "Active-Supply to Vaulted-Ratio" (A2VR) is a novel metric that elegantly captures this macro-level divergence. It measures the historical balance between "active" and "inactive" supply based on holding time units (typically coin-days or coin-blocks).
-
An upward trend indicates long-term holders are spending, with steeper increases signaling aggressive distribution.
-
A downward trend indicates investors prefer keeping coins inactive, with steeper declines reflecting accelerating hoarding behavior.
Since June 2021, the A2VR metric has been in a persistent downtrend, with its slope steepening significantly after June 2022. The indicator has now reached levels last seen in early 2019 and late 2020—both periods preceding major market rallies. This suggests the exuberance of the 2021–22 cycle has fully dissipated from the market.
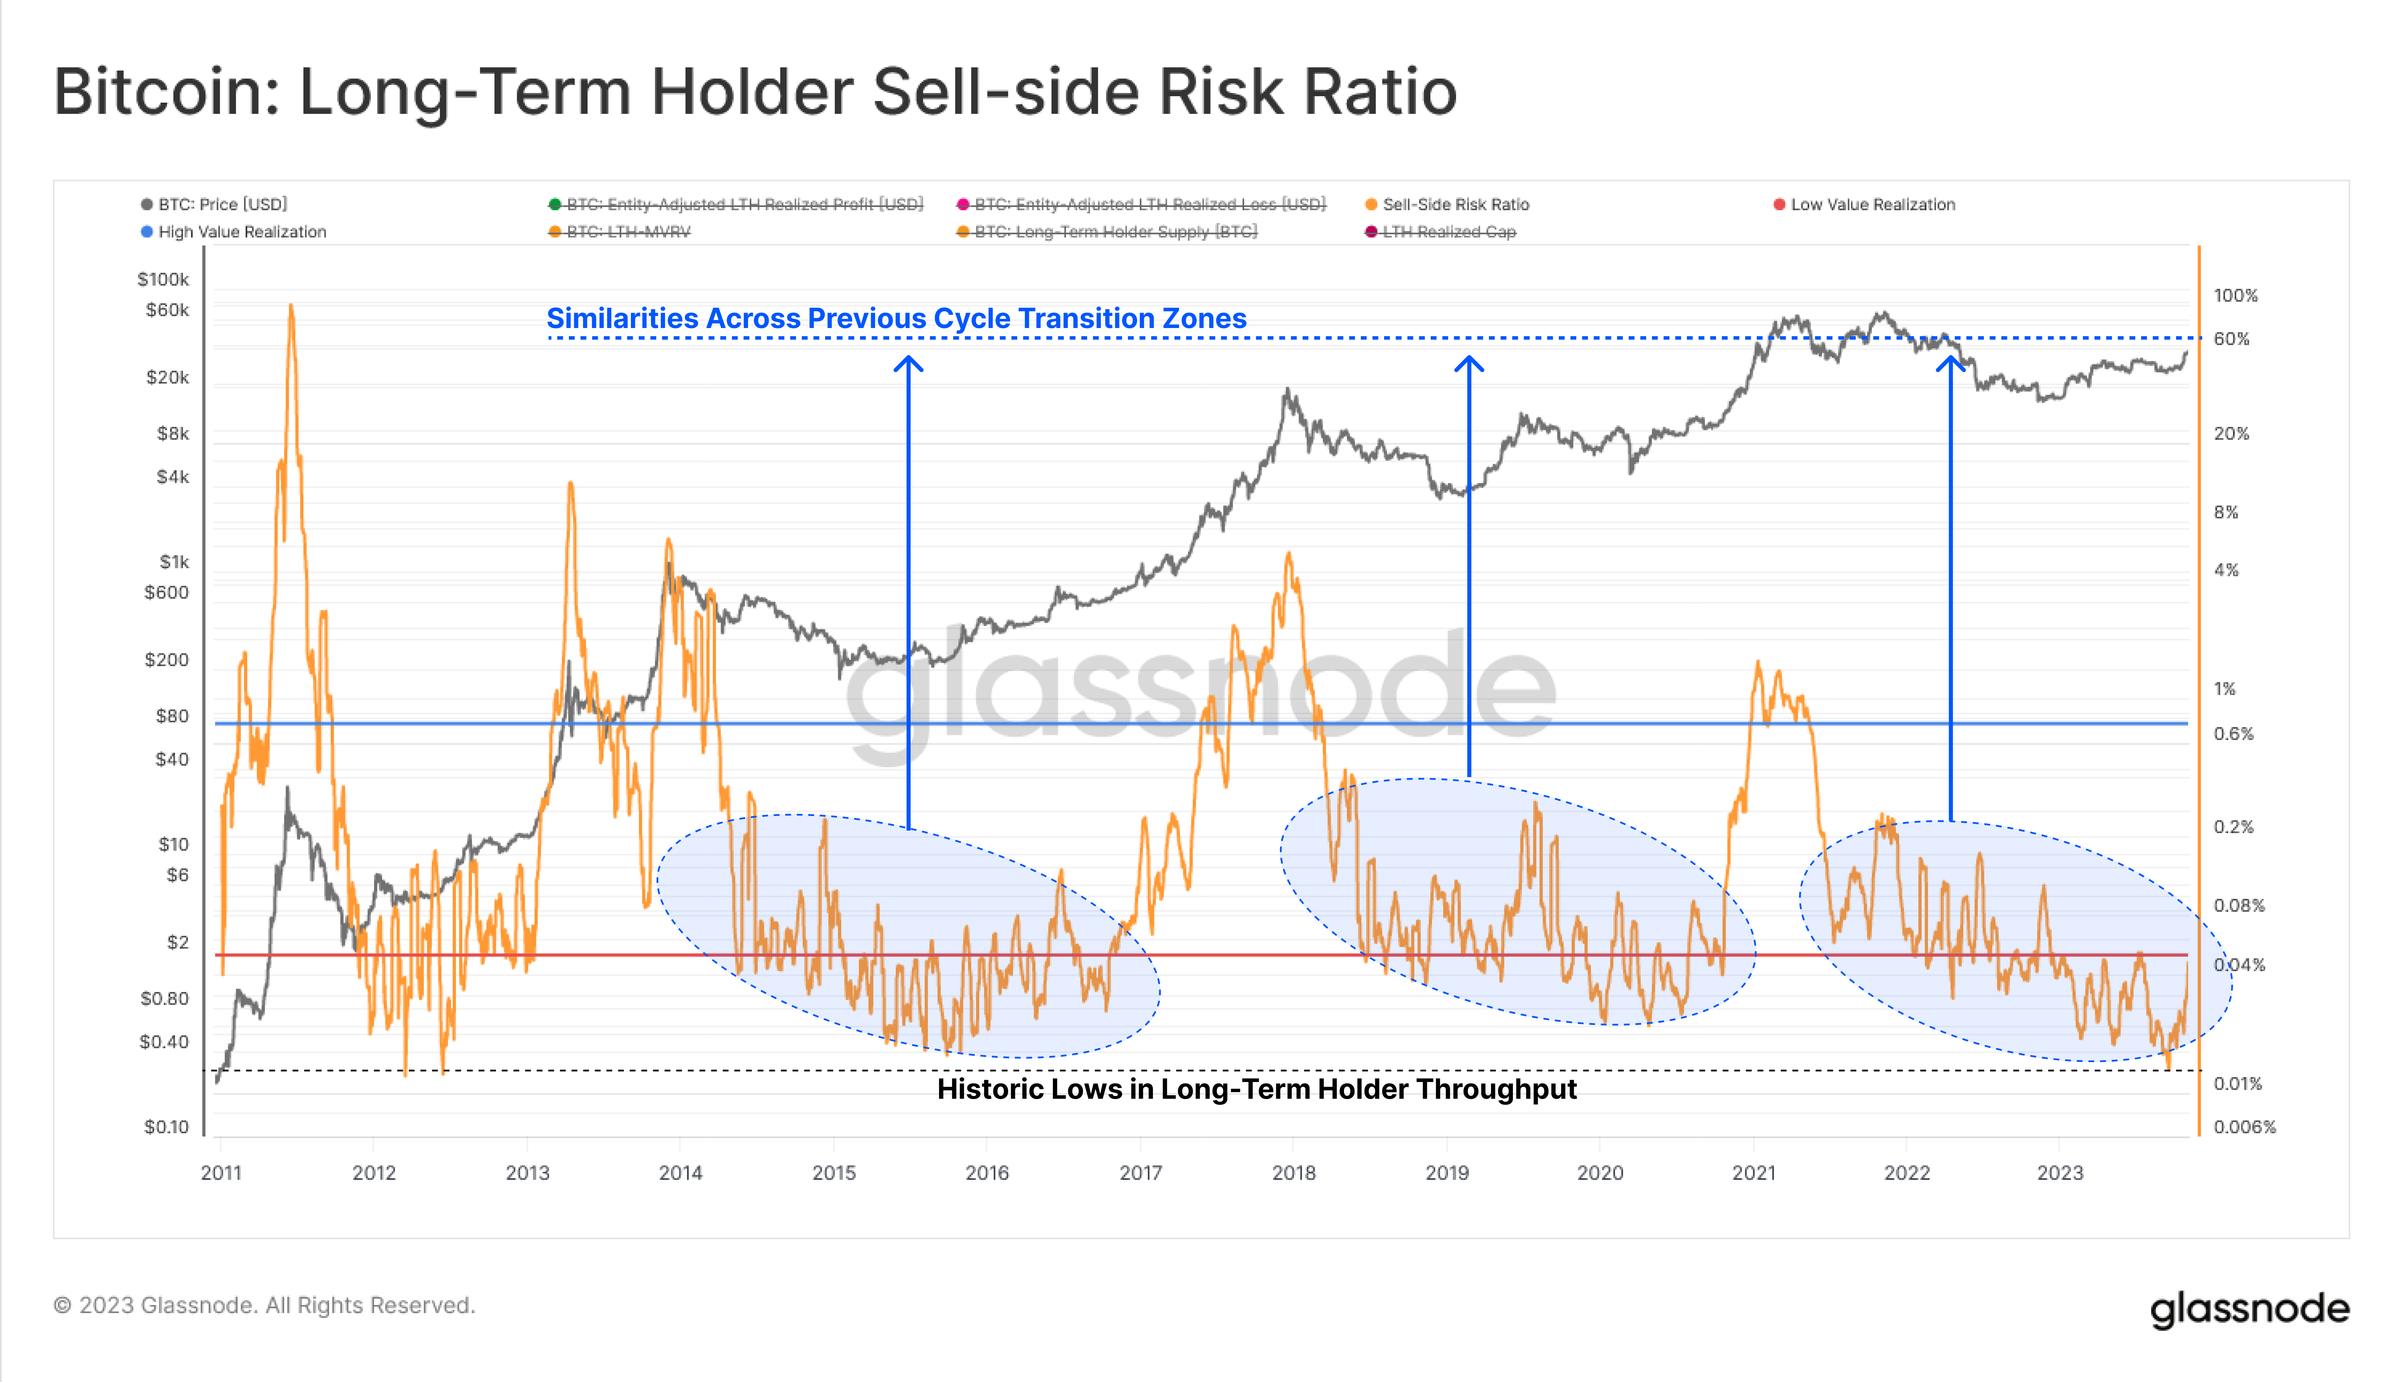
Another perspective on investor activity is analyzing spending behavior. The Spender Risk Ratio is a powerful tool assessing the relationship between investors’ absolute profit or loss and asset scale (measured by realized market cap). We interpret this metric as follows:
-
High values indicate investors are selling coins at large profits or losses relative to their cost basis.
-
Low values suggest most spent coins are close to break-even, implying exhaustion of "in/out" flows within the current price range.
In this case, we focus only on the short-term investor cohort, as they are among the primary drivers of daily price action. After the recent rise to $35,000, the Spender Risk Ratio spiked sharply from historic lows, suggesting investors in this group may soon take profits.

However, for long-term holders, while their Spender Risk Ratio has increased slightly, it remains very low in historical context. The current structure of this metric resembles conditions seen in late 2016 and late 2020—both periods marked by relatively tight Bitcoin supply.
Broad-Based Accumulation
The previous set of metrics primarily considered Bitcoin supply from the perspective of token age and maturity. Another angle is examining supply by entity size. The Cumulative Trend Score metric helps track supply accumulation across different entity sizes, revealing an unusual dynamic since late October last year.
Here, we observe a clear net inflow trend 🟦 across nearly all cohorts this year—the most pronounced example so far. We see market resistance forming when most groups experience net outflows 🟥, whereas balanced net inflows 🟦 tend to accompany price increases. This phenomenon suggests growing investor confidence and a shift in participant behavior.
Focusing on smaller entities—small holders (<1 BTC), mid-sized holders (1–10 BTC), and large holders (10–100 BTC)—we see meaningful accumulation patterns. The rate at which balances in this subgroup are increasing currently equals 92% of newly mined supply, maintaining elevated levels since May 2022.
Cost Basis Analysis
Finally, we can use the UTXO Realized Profit Distribution (URPD) to identify areas where cost bases are densely concentrated, as well as price levels with relatively little trading activity. Four key regions stand out near the current spot price.
-
Section A: Significant supply accumulated between $26,000 and $31,000 during Q2 and Q3 of 2023.
-
Section B: A "gap" exists between $31,000 and $33,000, a range the price moved through quickly.
-
Section C: A substantial amount of supply has recently transacted within the current price range of $33,000 to $35,000.
-
Section D: Approximately 620,000 BTC from the 2021–22 cycle have cost bases just above $35,000 to $40,000.
Lastly, we can add color to the URPD distribution by splitting holders into long-term 🔵 and short-term 🔴 categories. We observe that most coins held by short-term holders are now in profit, with the majority having cost bases between $25,000 and $30,000. The rising STH Spender Risk Ratio aligns with prior "profit-taking," transferring coins to new investors within the current price range.
Overall, this suggests the $30,000–$31,000 price range is a critical area to watch, representing the upper bound of the largest cluster of supply and cost basis concentration. Given the lack of traded supply between $35,000 and $30,000, market reactions could become particularly interesting if prices return to $30,000. This also aligns with the true market average price highlighted in WoC 43, our best estimate of the "active investor cost basis."
Summary and Conclusion
Bitcoin supply has historically been tight. Currently, numerous supply metrics describe a state of "coin dormancy" reaching multi-year or even all-time highs. This indicates that despite strong price performance this year, Bitcoin continues to be held by long-term investors. With the anticipated April halving and positive momentum around U.S. spot exchange-traded funds (ETFs), the coming months are shaping up to be exciting for Bitcoin investors.
Join TechFlow official community to stay tuned
Telegram:https://t.me/TechFlowDaily
X (Twitter):https://x.com/TechFlowPost
X (Twitter) EN:https://x.com/BlockFlow_News


