

What Can We Learn from the Past Three Years of Changes in the Dollar Market?
TechFlow Selected TechFlow Selected
What Can We Learn from the Past Three Years of Changes in the Dollar Market?
Each use of money is unique, and the popularity of each use conveys the currency's value to the market.
Written by: Ben Lilly
Compiled by: TechFlow
If there's one fundamental question affecting how we design metrics, it's this:
"What is money?"
Specifically, what causes people to use, spend, or hold onto it. This is a thought exercise that helps us better grasp the dynamics of both conventional government-issued currencies and crypto tokens.
Some may argue these principles don't apply to the latter. But we prefer to view crypto tokens as natively digital money. That means many definitions and mental models from traditional monetary theory can be applied to our field.
Rather than spending time giving you a high-level overview of what we're referencing, let's dive straight in.
Inflation Isn’t Just About Supply
Money has multiple uses.
We can light it on fire for warmth, fold it into origami, buy candy, store wealth, deposit it as collateral, or use it to purchase securities.
Each use is unique. And each use’s popularity signals value to the market.
If in some region money is primarily used as fuel for fire, its value might resemble that of its material composition. Meanwhile, if another part of the world uses their money to earn yield... the two could have vastly different values.
This view of money might seem strange. After all, we’re talking about currency. We mainly use it to buy things… right?
But data tells us otherwise… and these behaviors shift over time.
To help explain what we mean here, let’s try to recall our state of mind on March 16, 2020—during the peak of the coronavirus panic.
The Dow Jones Industrial Average dropped 12.9% that day.
The broader economy was in a similar state. Businesses closed, employees sent home, uncertainty reached its peak. It was a moment when holding dollars mattered more than anything else.
Indeed, the U.S. savings rate surged from 7.2% at the start of the year to 32% in April—the Fed’s highest recorded savings rate, double its previous average.
By summer 2020, the primary use of the dollar was holding.
In crypto, we call this the hodl metric.
At the time, this level of currency hoarding represented a massive behavioral shift. Its impact is now clearly visible.
Fewer dollars circulating in the economy and being spent on goods and services meant inflation was negligible.
Early 2020 saw inflation at 2.5%... by April, when behavior switched from “normal” to “hold,” inflation dropped to 0.3%, even falling to 0.1% in May.
This change in money usage directly affected inflation.
Meanwhile, M2 money supply rose from $15.4 trillion in early March to over $17 trillion within weeks. When supply increases so dramatically, we often expect inflation to follow immediately. But it didn’t.
If anything, this newly minted money acted more like kindling for inflation. But it needed a match.
That match was the shift in how the dollar was used.
In economics, we express this mindset shift through a mental model called the Quantity Theory of Money, or QTM. This concept was popularized by economists Anna Schwartz and Milton Friedman in their book *A Monetary History of the United States, 1867–1960*.
The title sounds like a textbook, but the idea isn’t hard to grasp. Simply put, it states that the amount of money in an economy multiplied by how frequently it changes hands (i.e., velocity of circulation, the opposite of savings rate) affects its value.
Lots of money, but little spending, means no inflation.
Lots of money, and lots of spending… well, that’s when the match lights the kindling.
Which brings us to the next mindset shift.
The Summer 2021 Spending Frenzy
One year after the COVID lockdowns began in 2020, they ended in summer 2021. Economies reopened worldwide. Concerts were planned… parades resumed… it felt like “summer vacation just started.”
The notion of hoarding money out of fear of losing jobs or needing essentials faded. The mindset around money shifted.
Previously, people were stockpiling cash like in a Cold War arms race. Then suddenly, it was as if everyone realized nuclear war wasn’t imminent.
This mindset shift caused the savings rate to plummet from 26.1% to under 10% in just two months. Below is the savings rate with May 2021 as reference—the beginning of summer 2021’s spending spree...
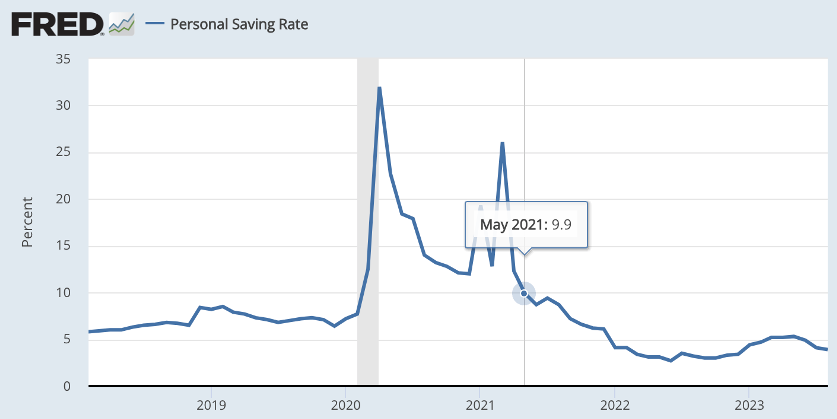
Dollars weren’t being held—they were being spent. In other words, the dollar was being used more as a payment method than as a store of value.
More money chasing goods and services…
Inflation arrived.
Here’s inflation on a chart. I bet you can guess which period the red arrow highlights—summer 2021.
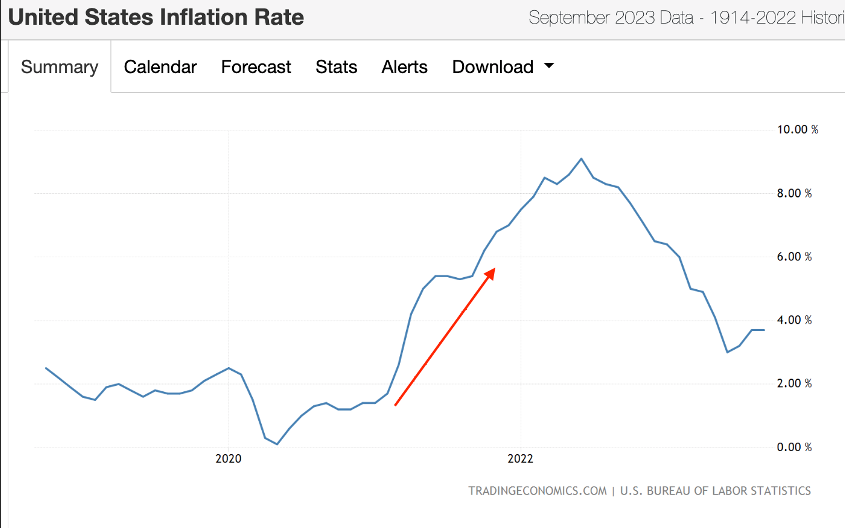
Inflation was at 1.4% in early 2021… and hit 5% by May.
It was as if the dollar had become hot potato. Nobody wanted to hold it.
Looking back, you might remember buying something you didn’t really need. Maybe a bigger TV, a computer monitor, a fancy ergonomic office chair, or even some home renovations. The spending spree was real.
Whatever you regret buying during that childish shopping spree…
Do you wish you’d kept that money in your pocket? I mean…
Now that same dollar earns you 5%. Imagine if you had converted your wealth into dollars at the start of 2022—you’d be earning 5% today. I bet you’d feel a bit better about that decision.
This brings us to the most recent shift in mindset about usage…
The Dollar Becomes a Hodl Asset
If we look back at the earlier inflation chart, we see inflation peaked at 9.1% in June 2022.
It’s nearly unimaginable how the economy allowed inflation to rise from 0.1% to over 9% in just one year. The primary use of money matters. And with our next usage shift, you’ll see it again.
Below is the earlier savings rate chart, zooming in on the post-COVID period. We can see the rate hits its lowest point in June 2022—the same month inflation peaks.
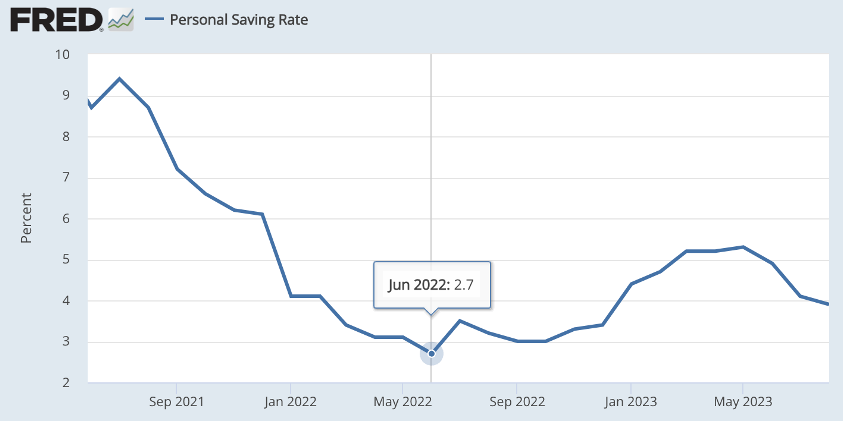
Yet the dollar supply changed very little… no sudden drop in supply caused inflation to reverse. So what exactly happened here?
The Federal Reserve changed market behavior.
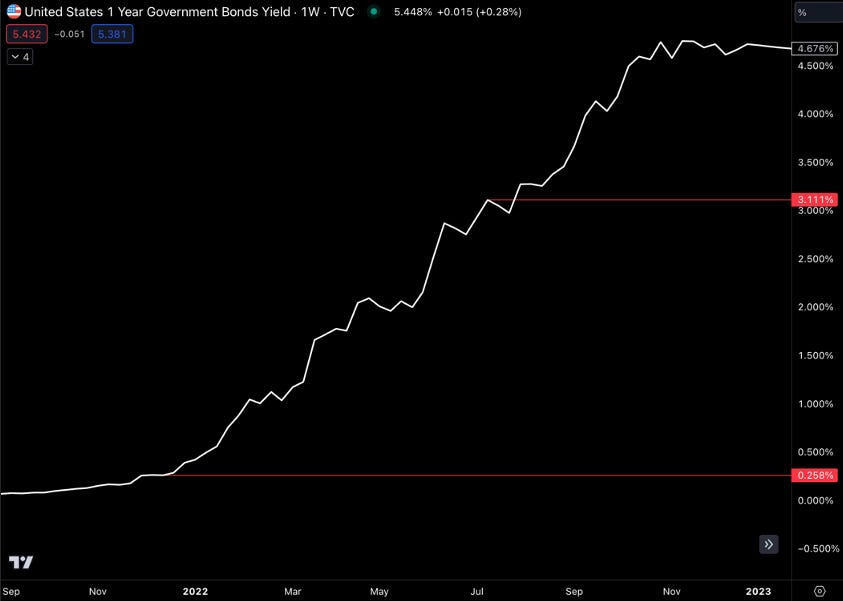
In the first half of 2022, the central bank raised borrowing rates three times—small hikes in March, then larger ones in May and June. Borrowing rates jumped from around 0.25% to 1.5%. A massive shift.
This major move incentivized sending dollars to the U.S. government for lending purposes (i.e., buying Treasury bonds) to earn actual cash flow. Just before 2022, lending those dollars earned you 0.25%. So for every $100,000 lent, you got $250.
But by June that year, the same $100,000 earned over $3,100. That’s a 1,140% increase in cash flow compared to six months prior. That’s significant.
So the market’s preference for how to use dollars shifted. Dollars were now more about earning meaningful cash flow than spending on goods and services. Sure, the dollar’s strength helped, but regardless, this is today’s dominant use case.
People want returns on price-stable assets—note this, token economists. We’re even seeing several projects bring this yield exposure onto public blockchains. That’s how popular it’s become.
So we have roughly the same dollar supply, but now it’s being spent less… As I write this in October 2023, inflation has stayed below 4% for four consecutive months. If anything, more people now want to hold dollars than ever before.
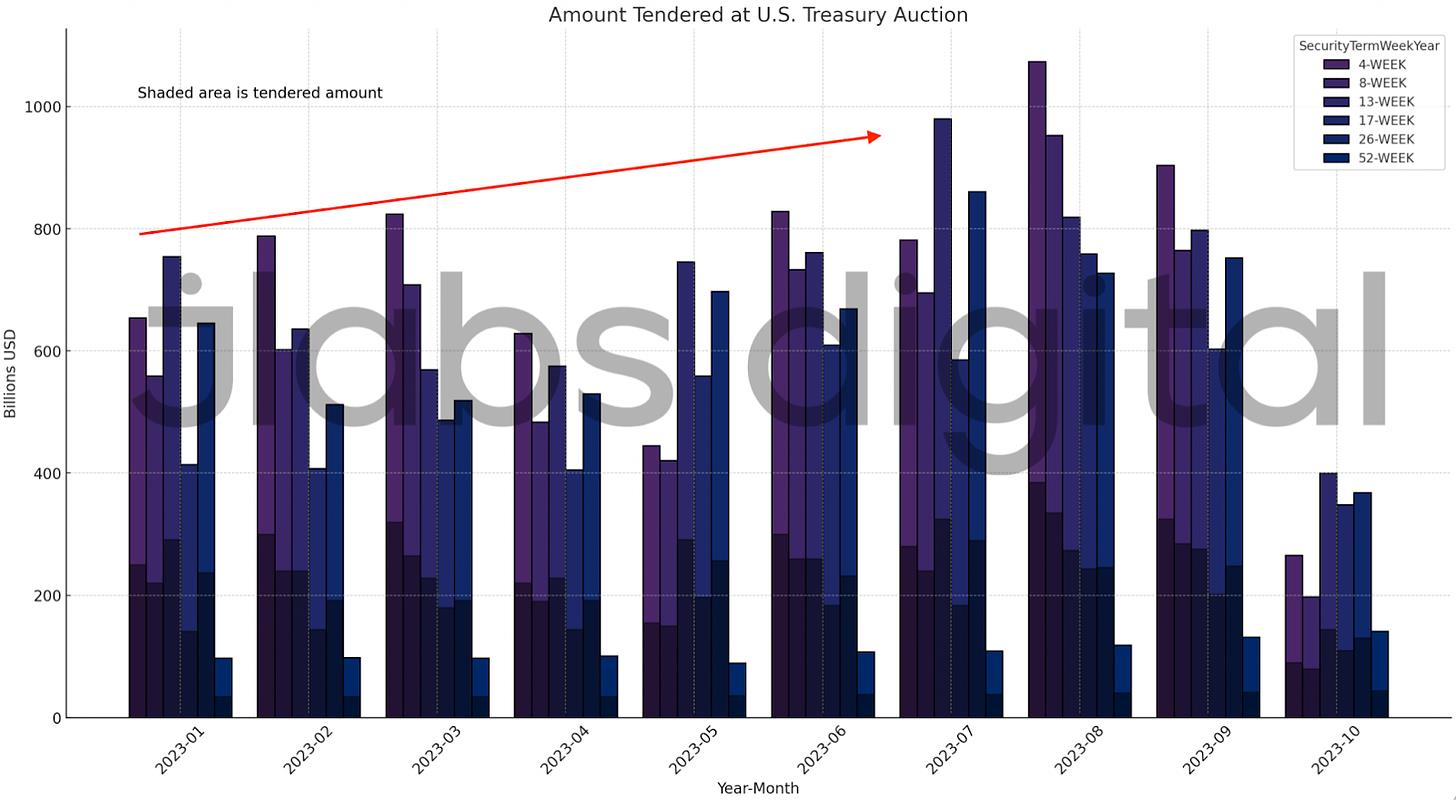
We can see this in rising demand on the Treasury market. In the chart below, each colored line represents a U.S. Treasury maturity. The height shows monthly bid amounts for each maturity. The shaded area in each bar shows bids awarded by the U.S. Treasury.
I mentioned earlier that inflation has been below 4% for the past four months. For the past six to eight months, bid volumes at Treasury auctions have been rising.
Here are Treasury auctions for maturities of 52 weeks or shorter.
And here are auctions for maturities longer than 52 weeks.
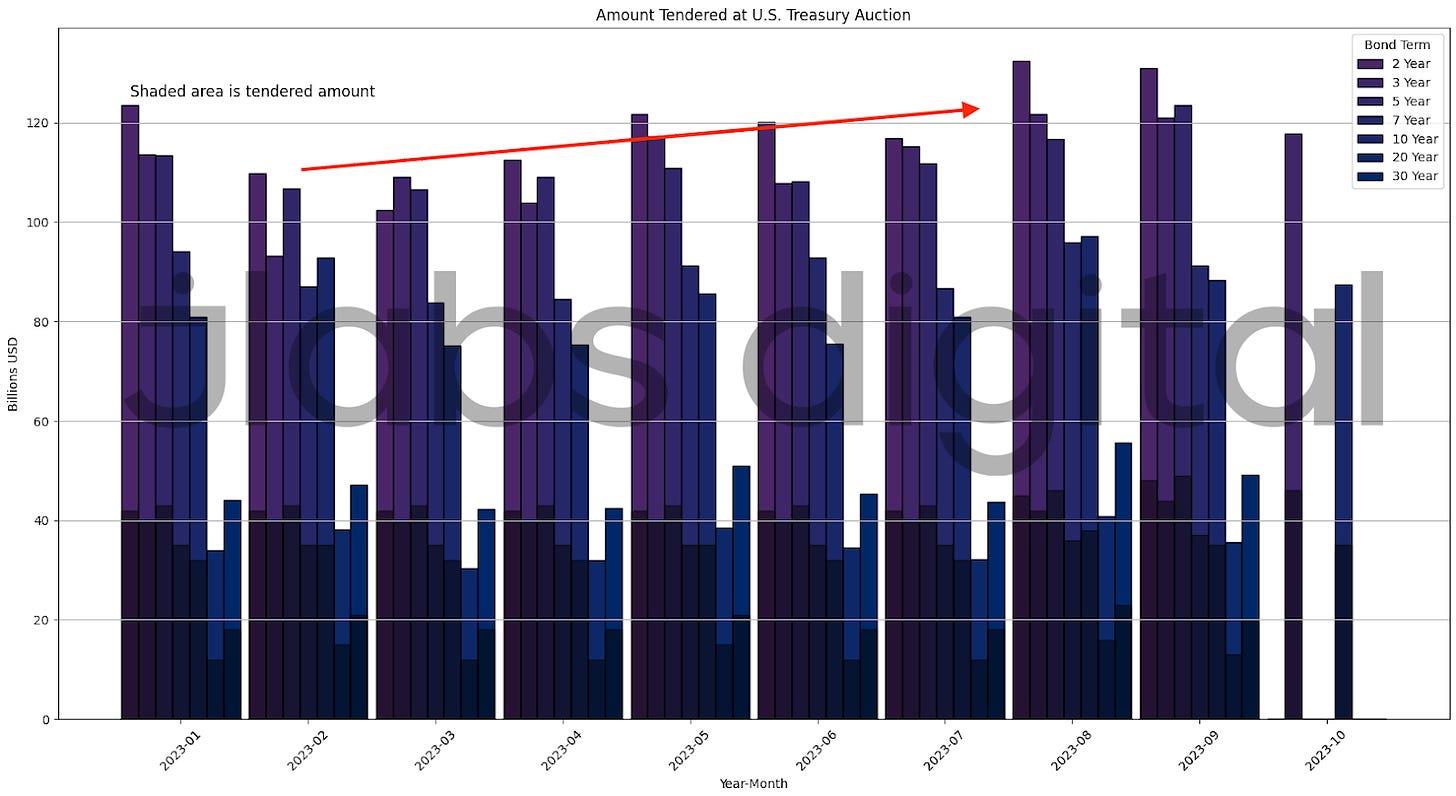
Both charts show increasing demand for using dollars to generate cash flow. This is essentially the ultimate form of “hodling.”
In summer 2020, people held cash out of fear. By 2023, the dollar-holding cohort holds to generate income. This is a more productive use of money.
That’s why my preferred version of QTM for crypto doesn’t focus on quantity—but quality. I call it the “Token Quality Theory.”
The Story Isn’t Over
This might seem like a lot of information.
But we can summarize it by revisiting the March 2020 timeframe and reflecting on how money usage evolved in the years since.
It evolved from a holding phase, to a spending phase, to a phase where money generates yield.
Throughout this progression, inflation went from very low to very high, then back down again.
Meanwhile, the amount of money in circulation had no direct impact on inflation. This means money supply affects the dollar’s price less than how the dollar is used.
Join TechFlow official community to stay tuned
Telegram:https://t.me/TechFlowDaily
X (Twitter):https://x.com/TechFlowPost
X (Twitter) EN:https://x.com/BlockFlow_News


