Glassnode On-Chain Weekly Report (2nd Week of September): Liquidity Drying Up and On-Chain Activity Slump
TechFlow Selected TechFlow Selected
Glassnode On-Chain Weekly Report (2nd Week of September): Liquidity Drying Up and On-Chain Activity Slump
Volatility, liquidity, trading volume, and on-chain settlement volume are all at historic lows. This increases the likelihood of the market entering a period of extreme apathy, fatigue, or even boredom.
Written by: UkuriaOC, Glassnode
Compiled by: TechFlow
Liquidity in the digital asset markets continues to dry up, with both on-chain and off-chain trading volumes reaching historic lows. While holding (HODLing) remains the dominant market behavior, a significant portion of supply is now teetering on the edge of substantial unrealized losses.
Summary
-
Liquidity, volatility, and trading volume across digital asset markets continue to contract, with many metrics reverting to pre-2020 bull market levels.
-
Stablecoin supply continues to decline, with all major stablecoins seeing redemptions except for USDT.
-
Long-term holders remain steadfast, engaging in minimal trading activity.
-
In contrast, short-term holders are on the verge of losses, as most of their supply was acquired at prices above the current trading range.
Digital asset markets have returned to an extremely narrow trading range, experiencing compressed volatility and exceptionally low trading volumes. In this report, we will further explore the liquidity drought and how on-chain data can help better characterize this market structure.
Supply Continues Declining
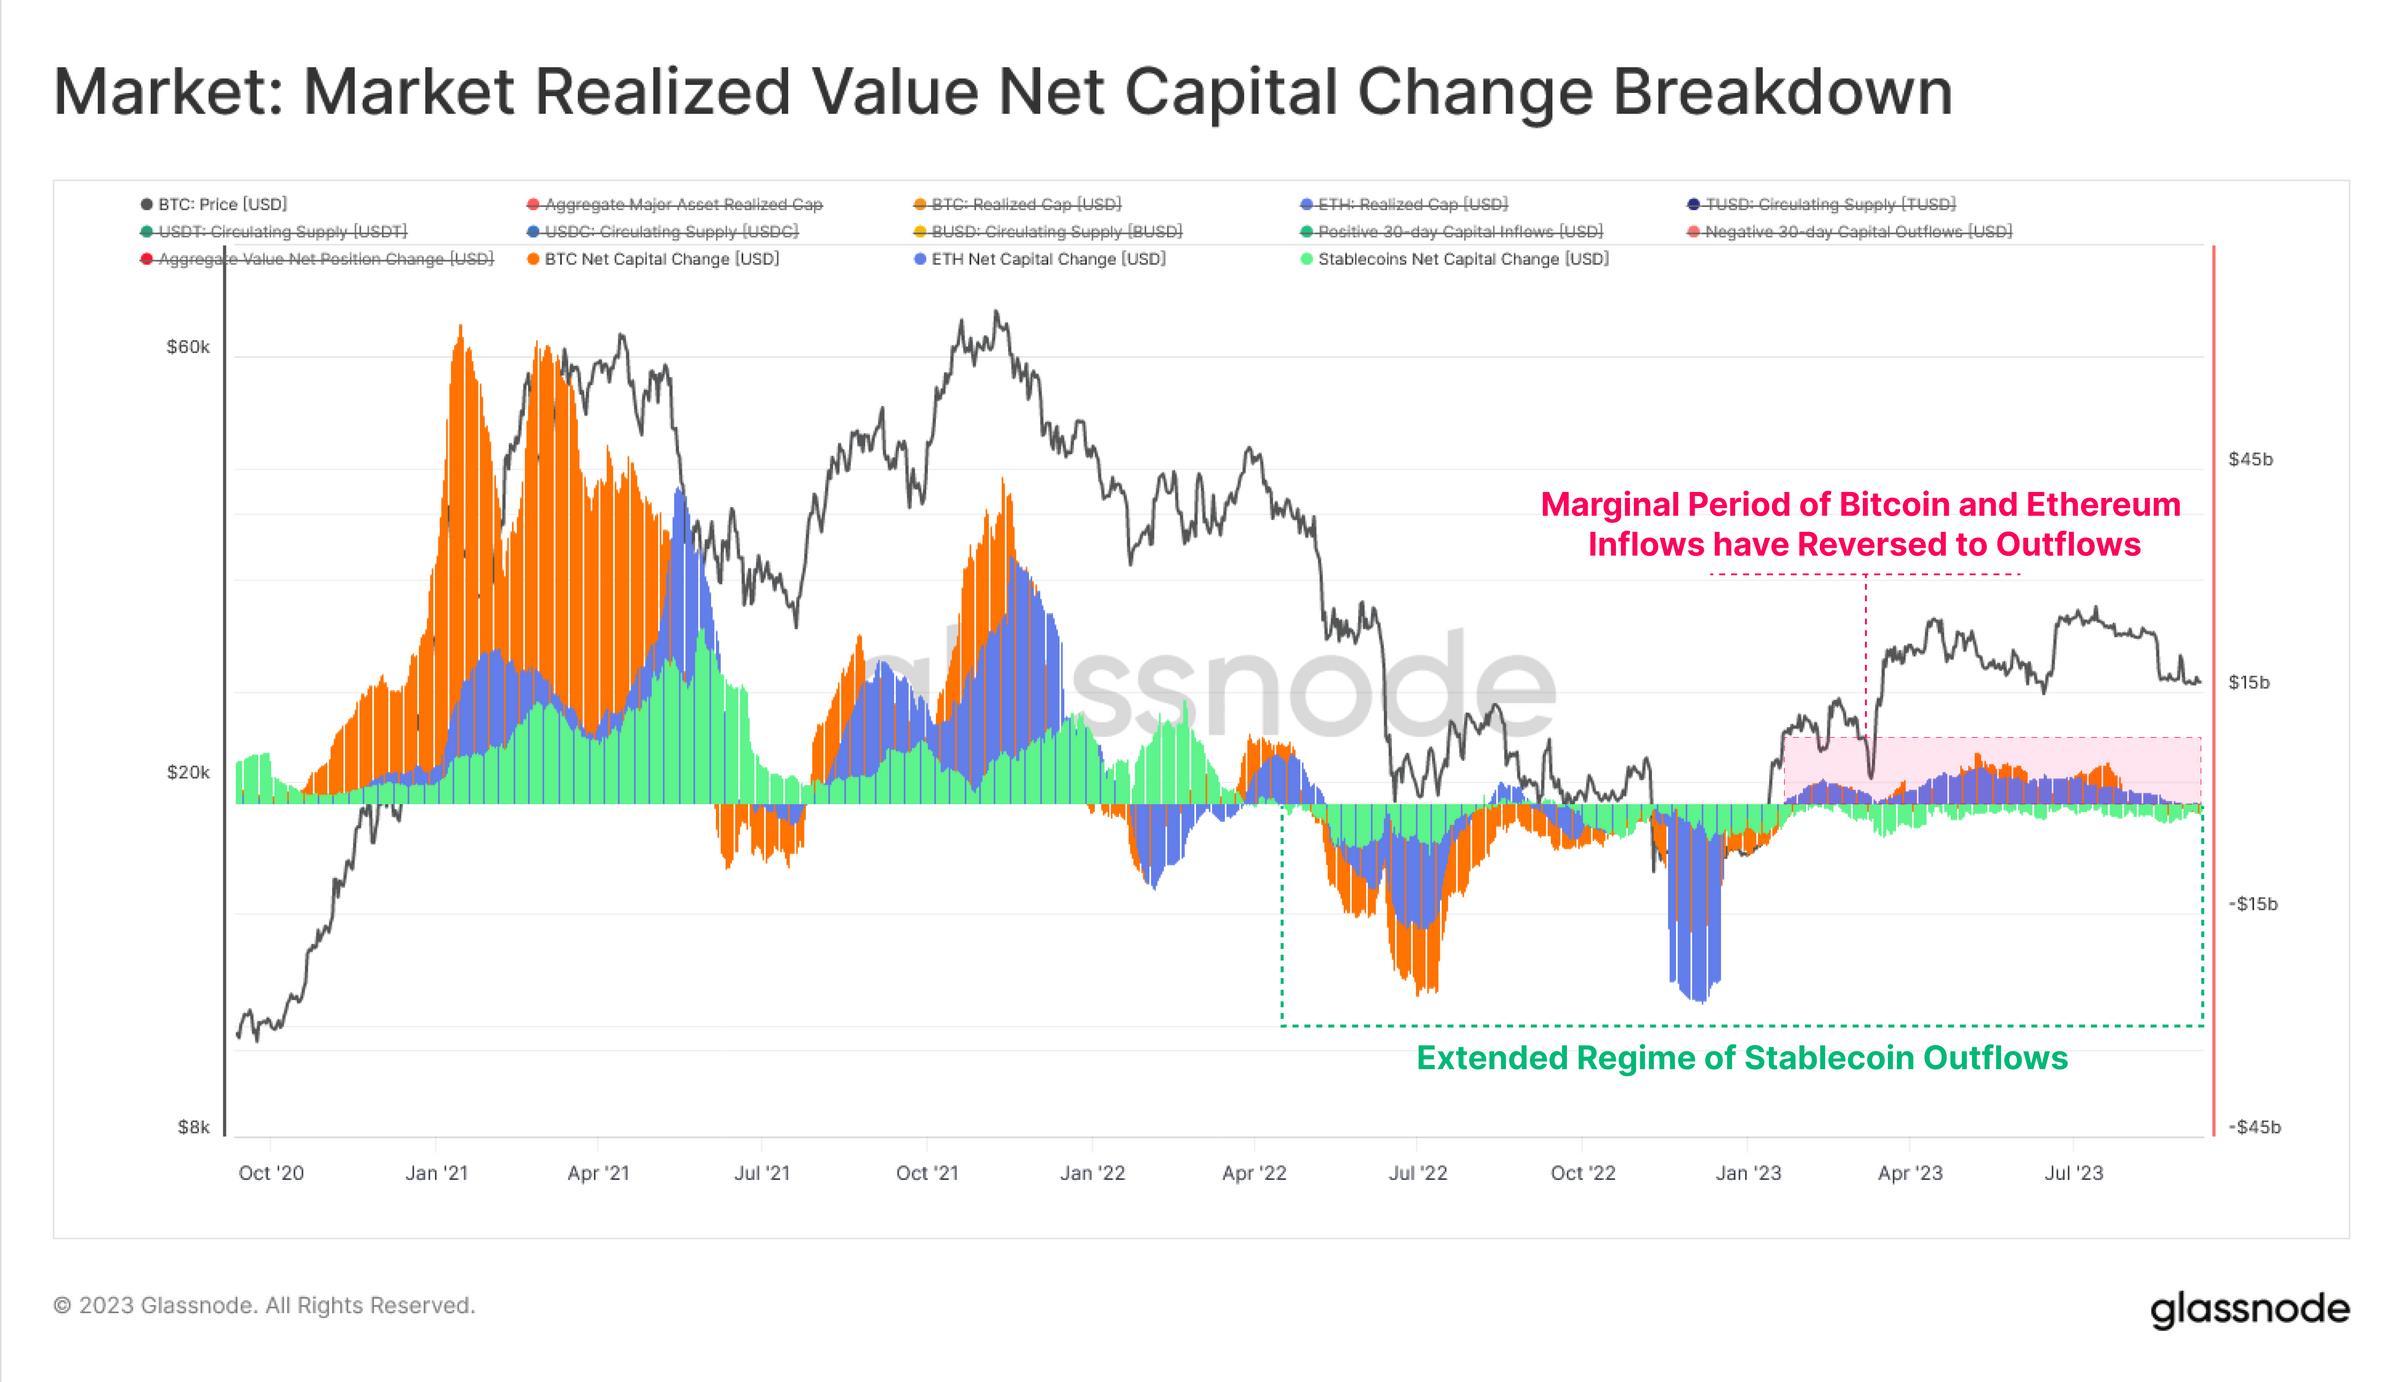
We begin with a macro perspective on capital flows into the sector, examining total invested capital held in three primary assets: Bitcoin, Ethereum, and stablecoins.
-
🟢 Stablecoin supply has been in continuous decline since April 2022, following redemptions triggered by the LUNA-UST collapse.
-
🟠 Bitcoin (BTC) and 🔵 Ethereum (ETH) have both seen net capital inflows since the beginning of the year, with their realized market caps growing by as much as $6.8 billion (BTC) and $4.8 billion (ETH) per month, respectively.
-
However, since late August, all three assets have reverted toward neutral or negative inflows, signaling a degree of stagnation and uncertainty in the market.
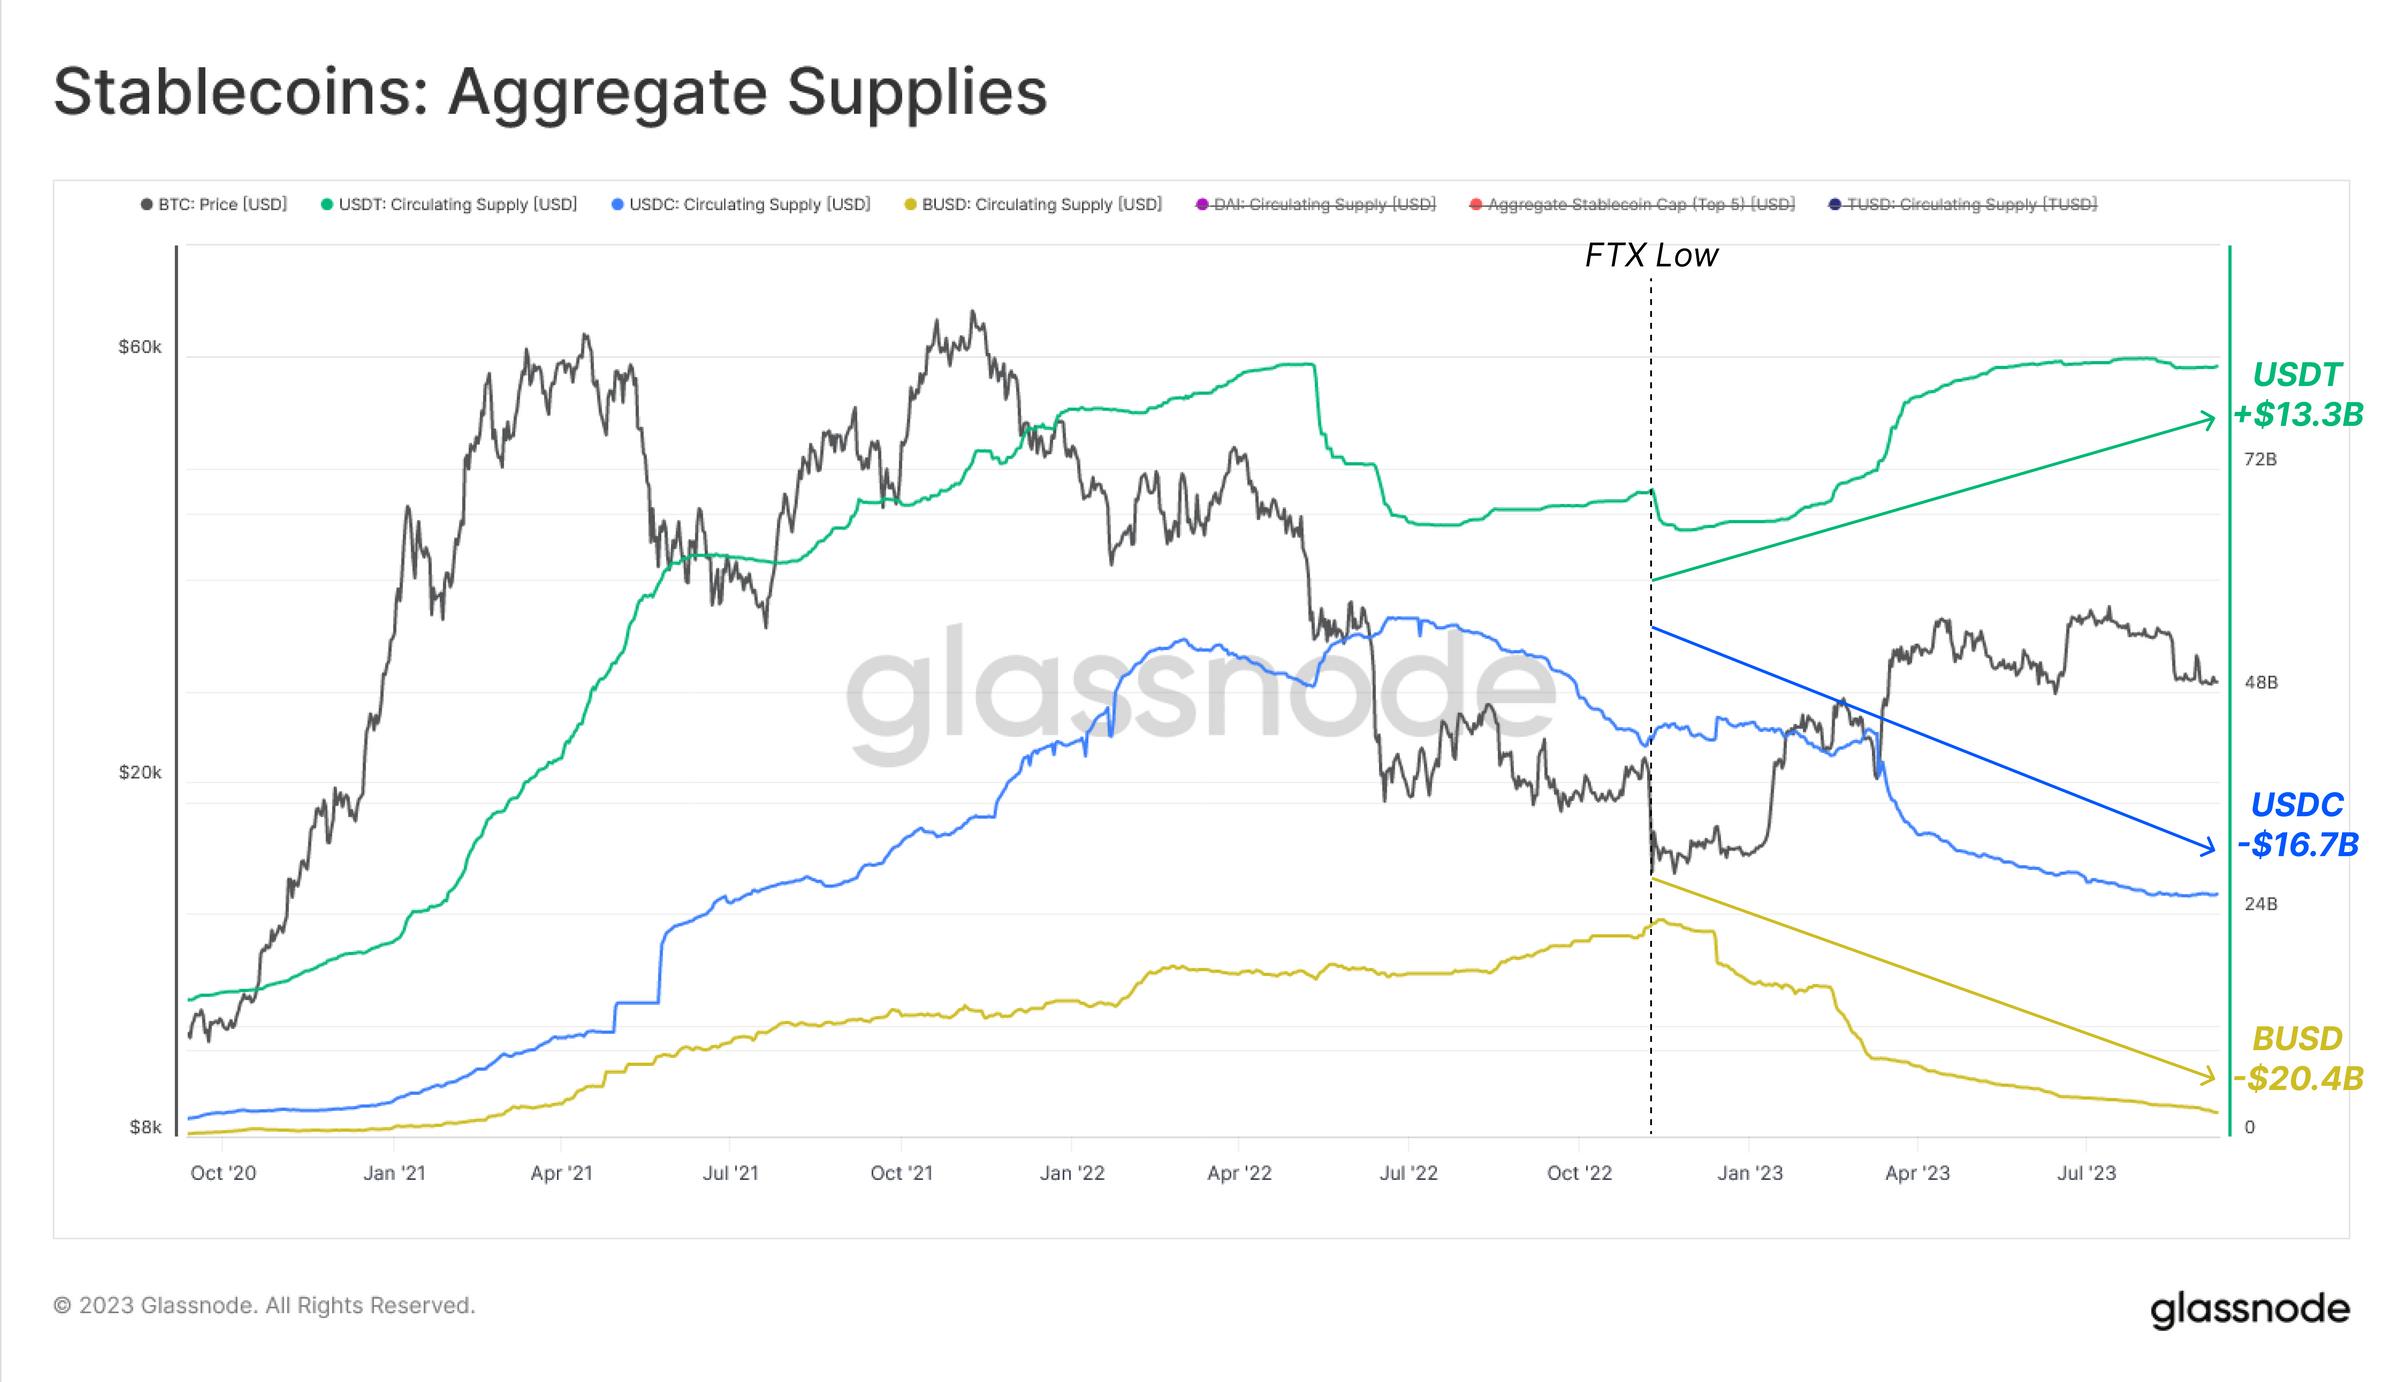
Analyzing stablecoins separately, we see a total of $43 billion withdrawn, representing a 26% decline from the March 2022 peak. This reflects both capital outflows during bearish conditions and the opportunity cost of higher interest rates that are not passed through to non-yielding stablecoins.

Breaking down the three largest stablecoins reveals uneven dynamics:
-
🟢 USDT’s supply has actually increased by $13.3 billion since its cycle low in November 2022.
-
🔵 USDC’s supply has declined nearly equally by $16.7 billion, possibly reflecting U.S. institutional movement toward higher-yielding instruments.
-
🟡 BUSD’s supply has collapsed by $20.4 billion (89%), primarily due to Paxos entering redemption-only mode following SEC enforcement action.
From a relative dominance perspective, Tether’s market share expansion is striking. Tether now accounts for 69% of the stablecoin market, a sharp contrast to its 44% low in June 2022.
BUSD’s dominance has fallen to 2.1%, while USDC’s stands at just 21.7%, significantly down from its peak of 38% over a year ago.

In the short term, we can examine the relative balance between buyers and sellers of the three main assets flowing into exchanges. We apply the following simple assumptions:
-
We assume the dollar value of Bitcoin and Ethereum inflows to exchanges represents “seller” pressure.
-
We assume the dollar value of stablecoin inflows to exchanges represents “buyer” pressure.
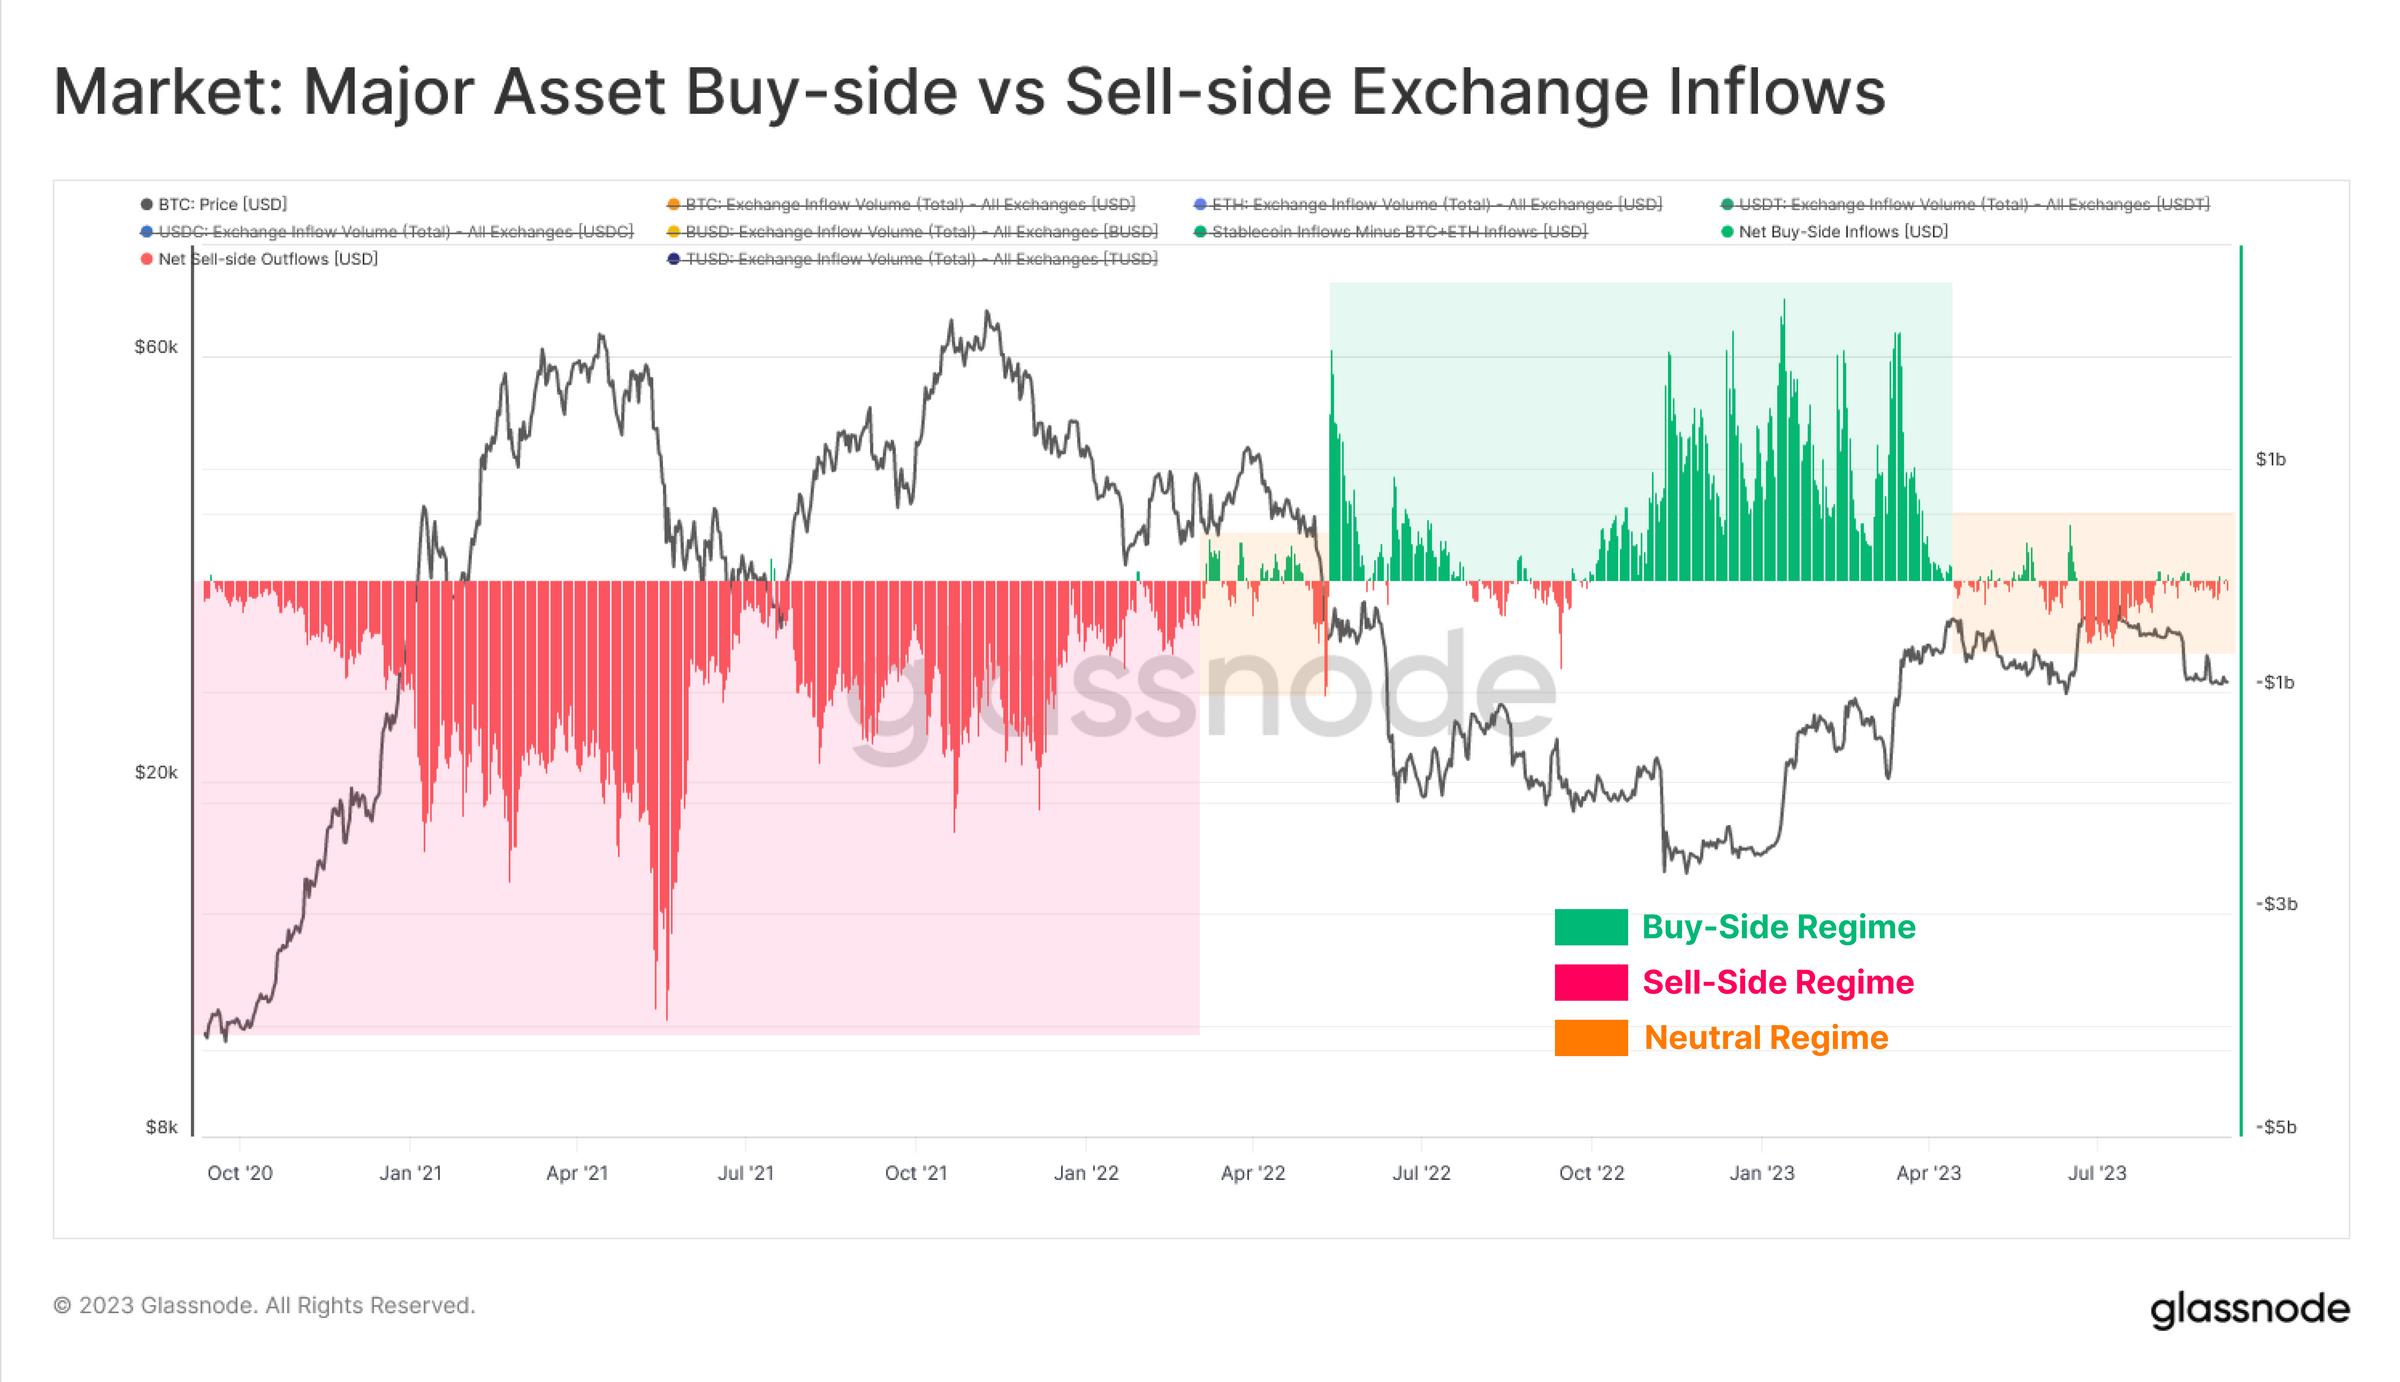
The chart below calculates the net dollar difference between stablecoin inflows (+ values) and BTC/ETH inflows. Rather than focusing on absolute magnitudes (which carry estimation errors), we emphasize significant shifts.
-
🟢 Positive values indicate a net buyer regime, where stablecoin inflows exceed BTC/ETH selling pressure.
-
🔴 Negative values indicate a net seller regime, where stablecoin inflows are less than BTC/ETH selling pressure.
The 2021 bull run was clearly dominated by net seller pressure, as investors took profits amid speculative frenzy. The mid-2022 collapses of LUNA-UST and 3AC marked a return to net accumulation, as investors sought to establish a market bottom.
However, since April this year, the market has reverted to a relatively neutral stance, consistent with slowing capital inflows into BTC and ETH and increasing market apathy and uncertainty.
On-chain Activity Is Very Quiet...
Despite recent price drops to $26,000 and renewed volatility following Grayscale’s legal victory over the SEC, realized volatility remains very low. The market remains in a historically low-volatility environment, which often precedes periods of heightened future volatility.

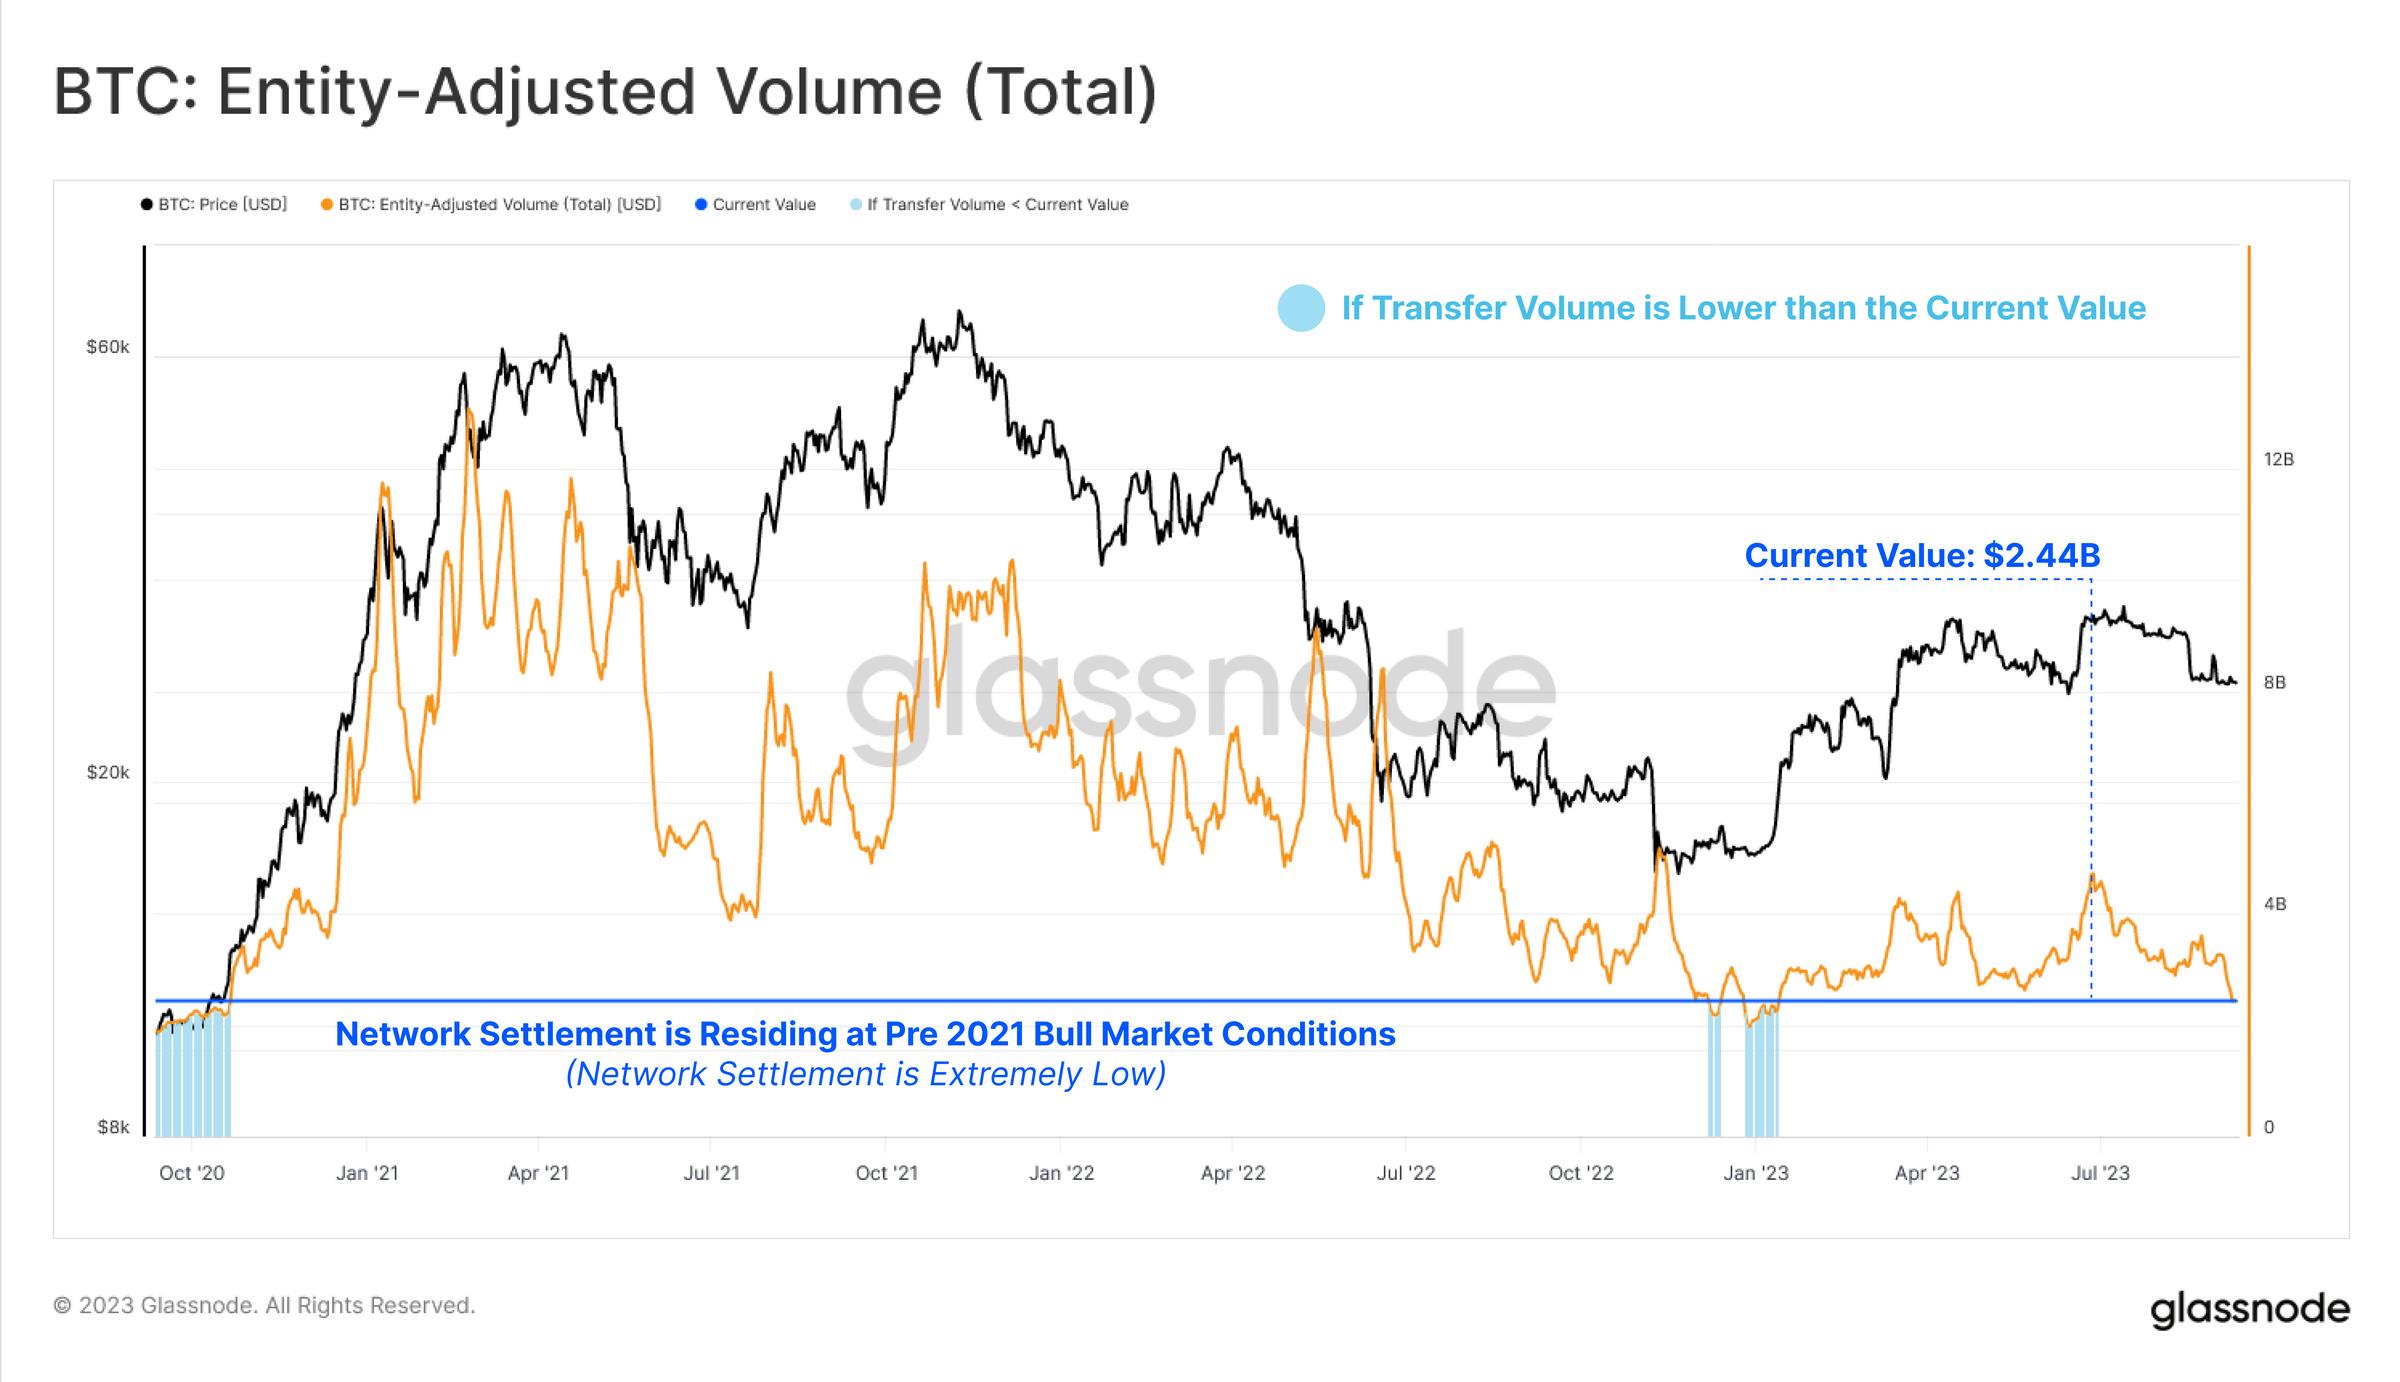
This low-liquidity, low-volatility environment is also reflected in Bitcoin’s settlement transaction volume. Dollar-denominated Bitcoin transaction volume is stagnant at a cyclical low of $2.44 billion per day—back to October 2020 levels.
Looking at on-chain realized value—the difference between purchase and sale prices of coins—we find it remains extremely quiet. The market is locking in minimal profits or losses overall, indicating most transacted coins are close to their original acquisition prices.
Realized profit and loss levels are comparable to those seen in 2020, highlighting that the exuberance of the 2021 bull market may have fully dissipated.

We can also track on-chain apathy and low liquidity by observing the proportion of wealth held by the most active and liquid segment—the “liquid supply” cohort (coins transferred within the past week).
Currently, the realized value held by the “liquid supply” cohort is at a historic low, indicating very few coins older than one week are being traded.

Off-chain Is Also Quiet…
In the OTC derivatives market, futures trading volume has suffered a similar fate, hitting a record low of $12 billion per day. The only period with lower volume was the calm at the end of 2022, when Bitcoin fluctuated within a $557 range for over two weeks.

However, we observe an interesting divergence in the options market, where trading volume has grown significantly in 2023, currently averaging $437 million per day. This may reflect market preference for the leverage and capital efficiency of options during periods of tighter overall liquidity.
It should be noted that although the options market now has a comparable open interest size to futures, its trading volume remains an order of magnitude smaller.

Similarly, despite several days of sharp volatility last month, implied volatility in the options market remains relatively low. The initial rise in volatility premium was short-lived, with 1-month implied volatility returning to a historic low of 33.9%.

Long-Term Holders
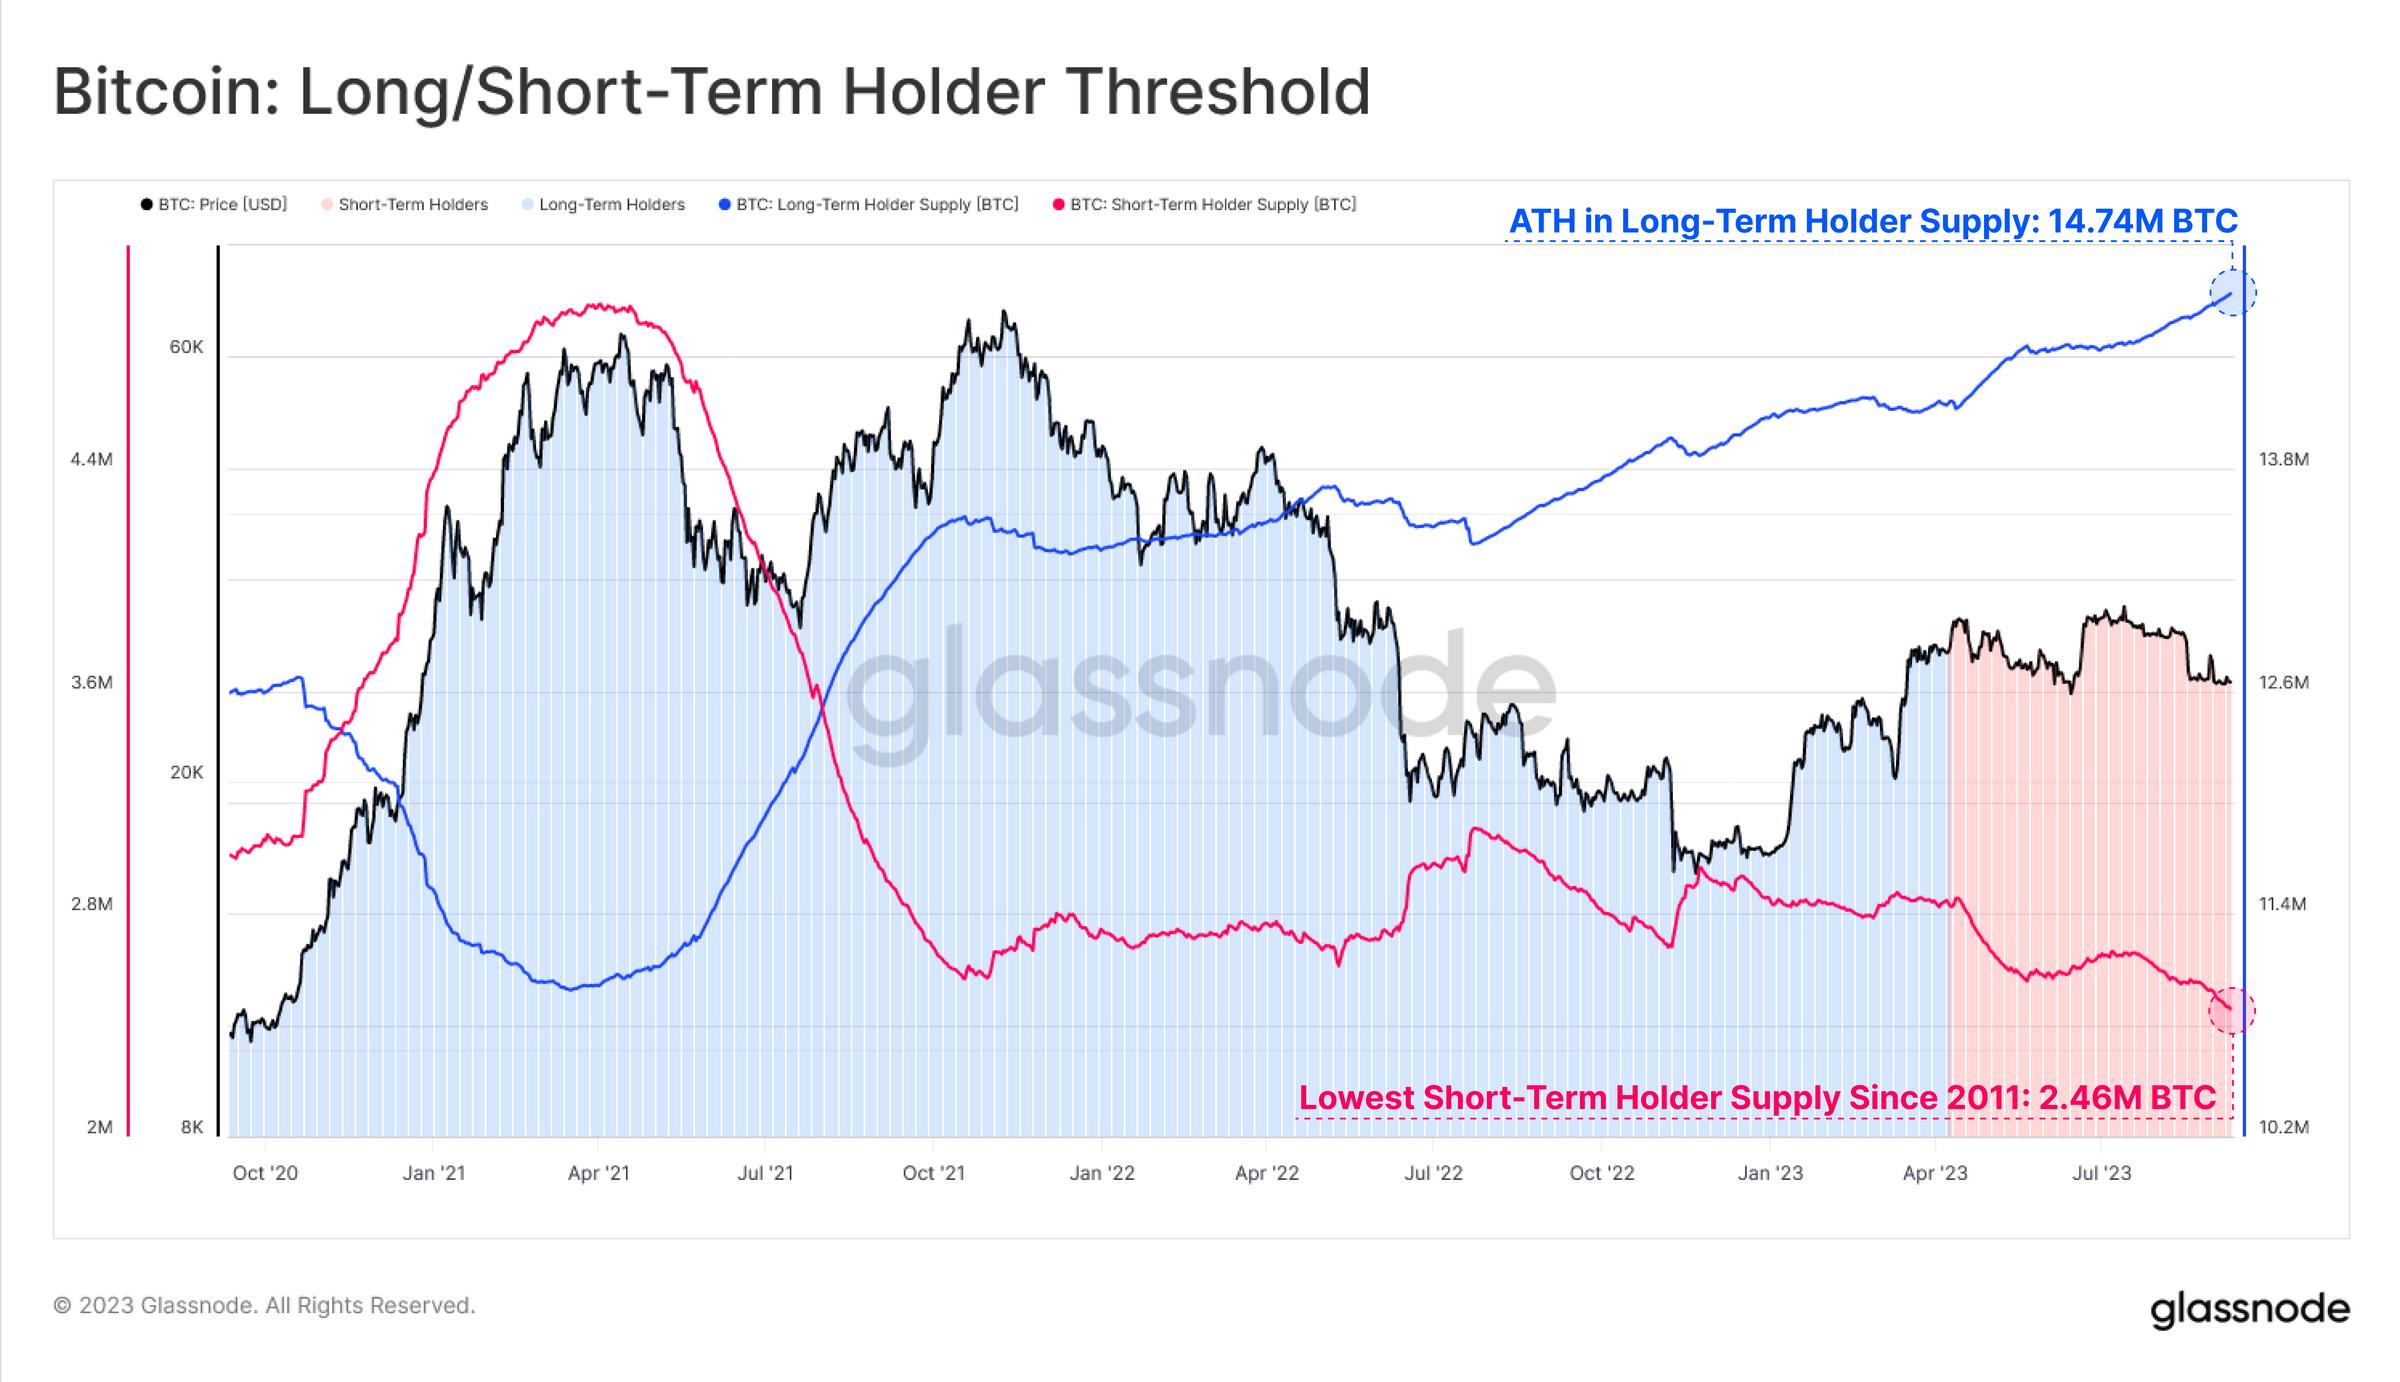
With both on-chain and off-chain domains exceptionally quiet, the long-term holder cohort now holds a record high of 14.74 million BTC. Conversely, the supply held by short-term holders—the more active market segment—has dropped to its lowest level since 2011.
Holding remains the dominant market dynamic, reflecting both strong conviction among existing holders and suggesting they may be the only ones left.
Consistency can be found in the "activity" metric, which elegantly compares the balance between coin-days destroyed and created. In other words, “activity” represents the relative equilibrium of “investor holding time” in the market.
Consistent with the net-seller market described earlier, “activity” surged in 2021 as older coins were spent and profits realized. As the bear market unfolded from May to December 2022, a strong downward trend emerged—marking a turning point from a trader-driven market to a holder-dominated one.
“Activity” has now returned to late-2020 levels and shows an increasingly steep downward trajectory. This indicates that overall “investor holding time” is rising, and investors are becoming increasingly reluctant to spend or relinquish their holdings.

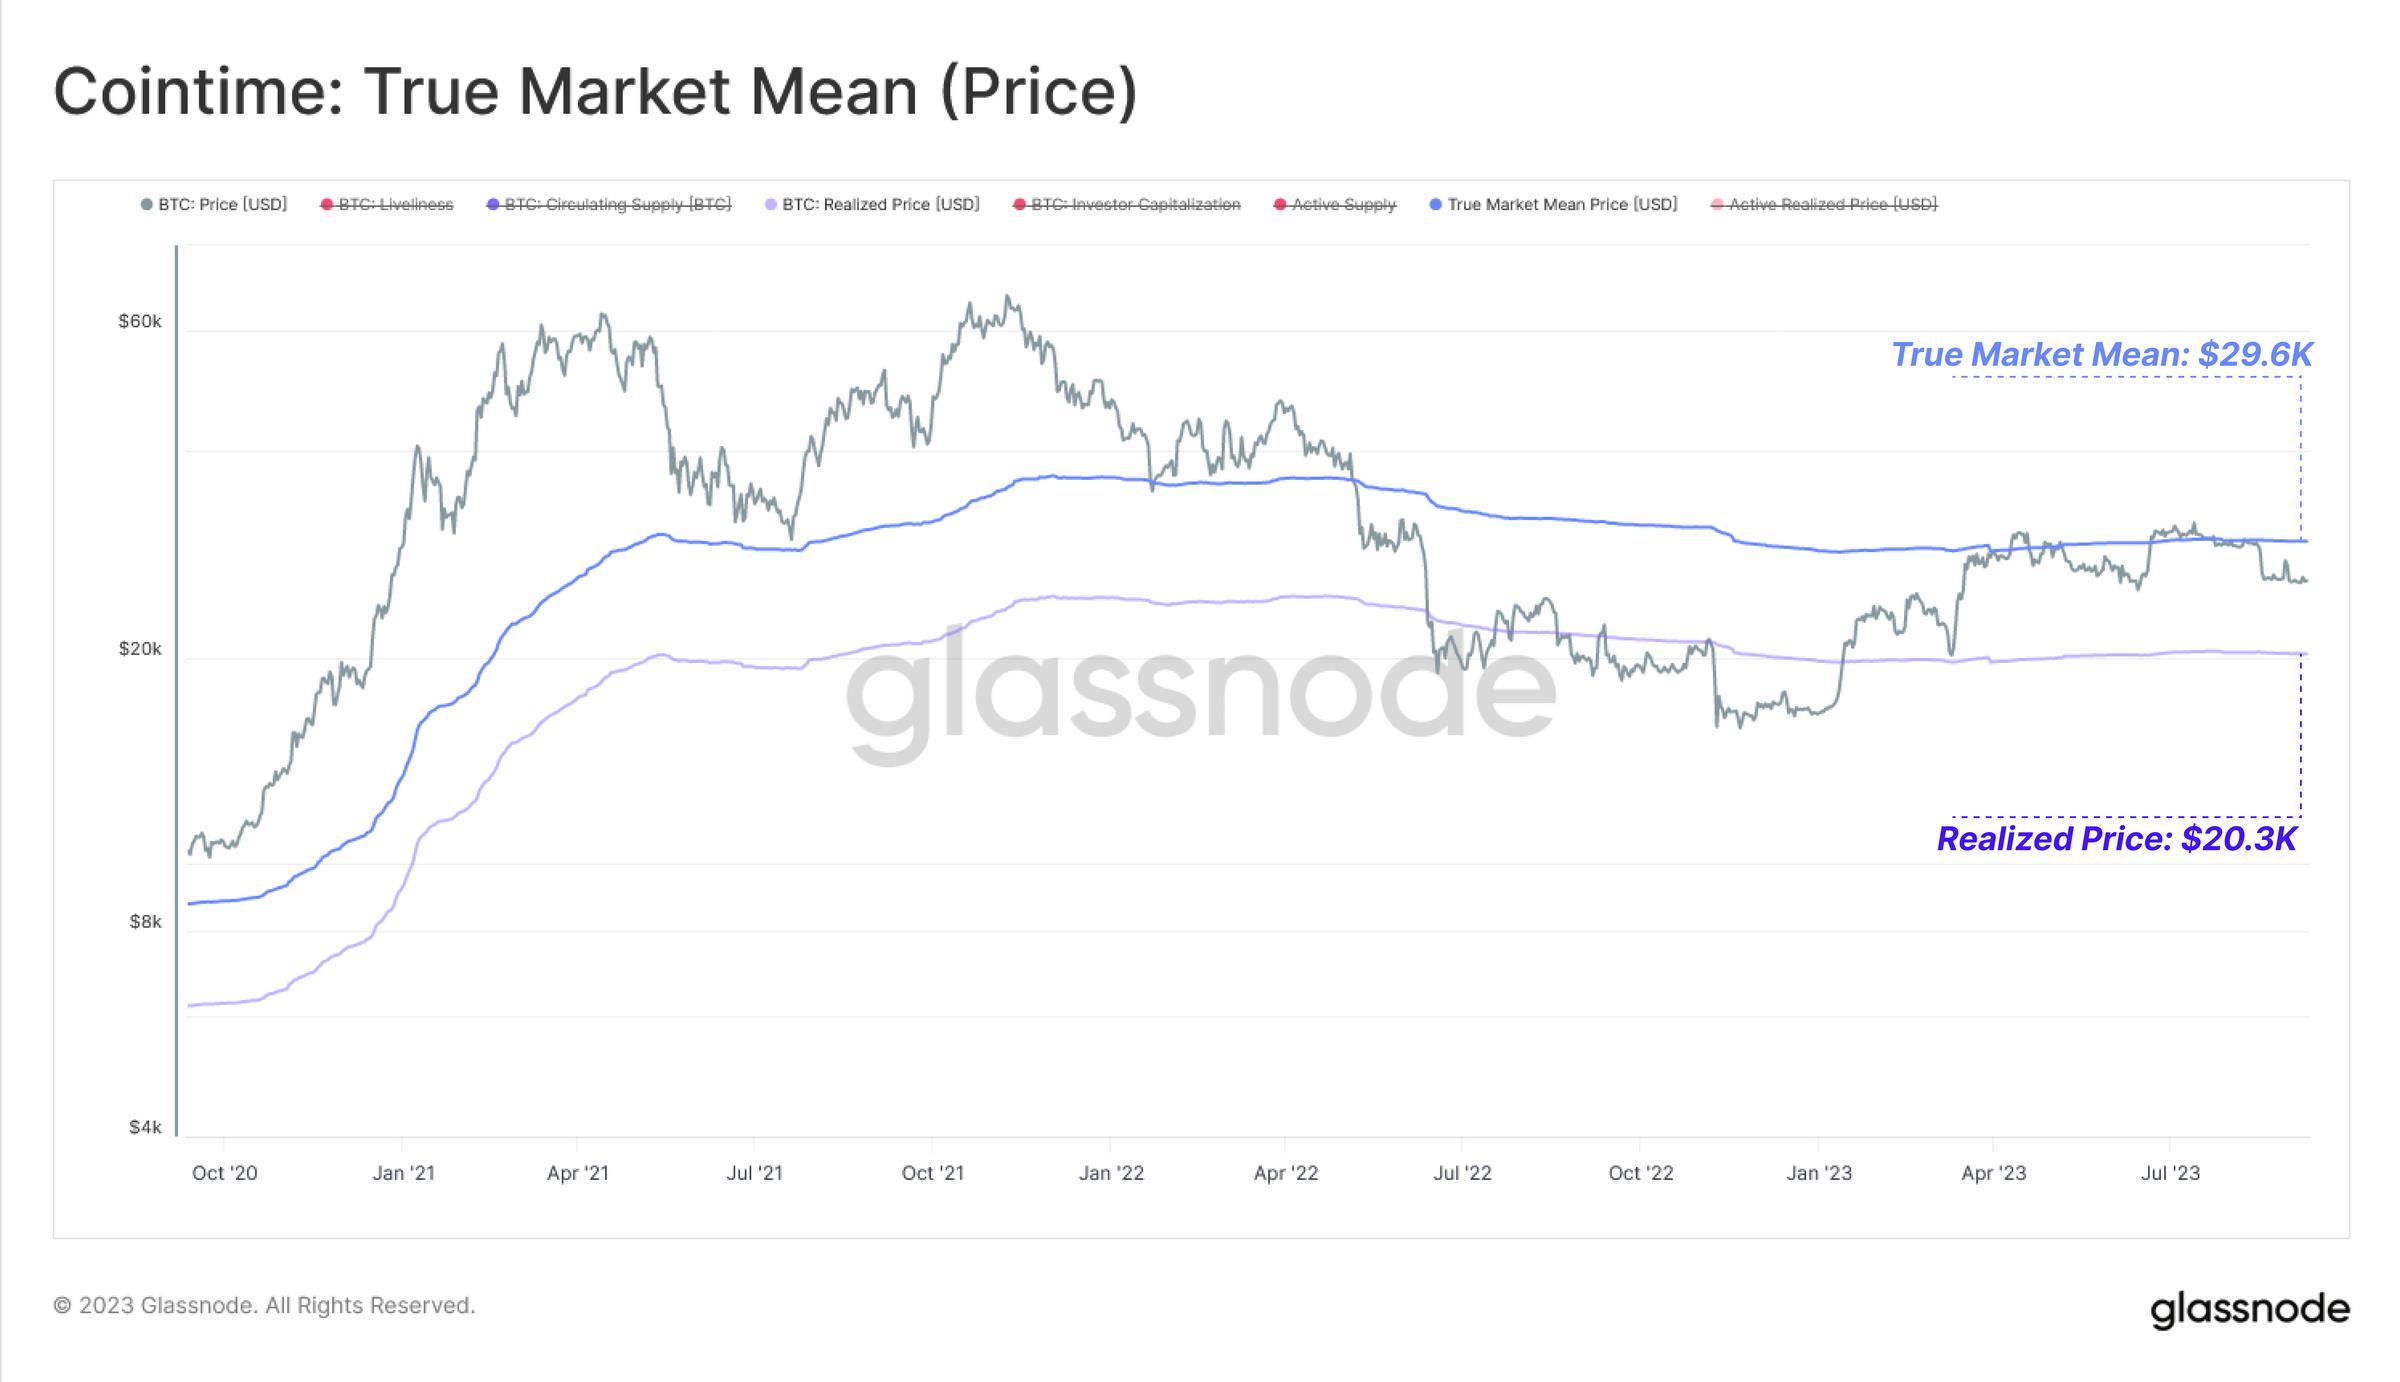
A key insight from this work is the evolution of the true market average price, which we consider the most accurate “cost basis” model for active Bitcoin investors. This model currently sits at $29,600 and has formed a psychological resistance level since April. The traditional realized price of $20,300, along with this model, has constrained most price action throughout the year.
Market Sensitivity
Applying these two pricing models to the URPD chart as psychological boundaries allows us to better describe the supply accumulated between them. Currently, over 4.81 million BTC have a cost basis between $20,300 and $29,600.
We can also see that, at the time of writing, with price slightly below $26,000, short-term holders 🔴 are almost entirely in loss. This likely makes this more price-sensitive cohort somewhat nervous.

The chart below shows the percentage of profitable supply within the short-term holder cohort. We see that the vast majority of their supply is in unrealized loss, with only 16.3% of holdings still “in profit.”

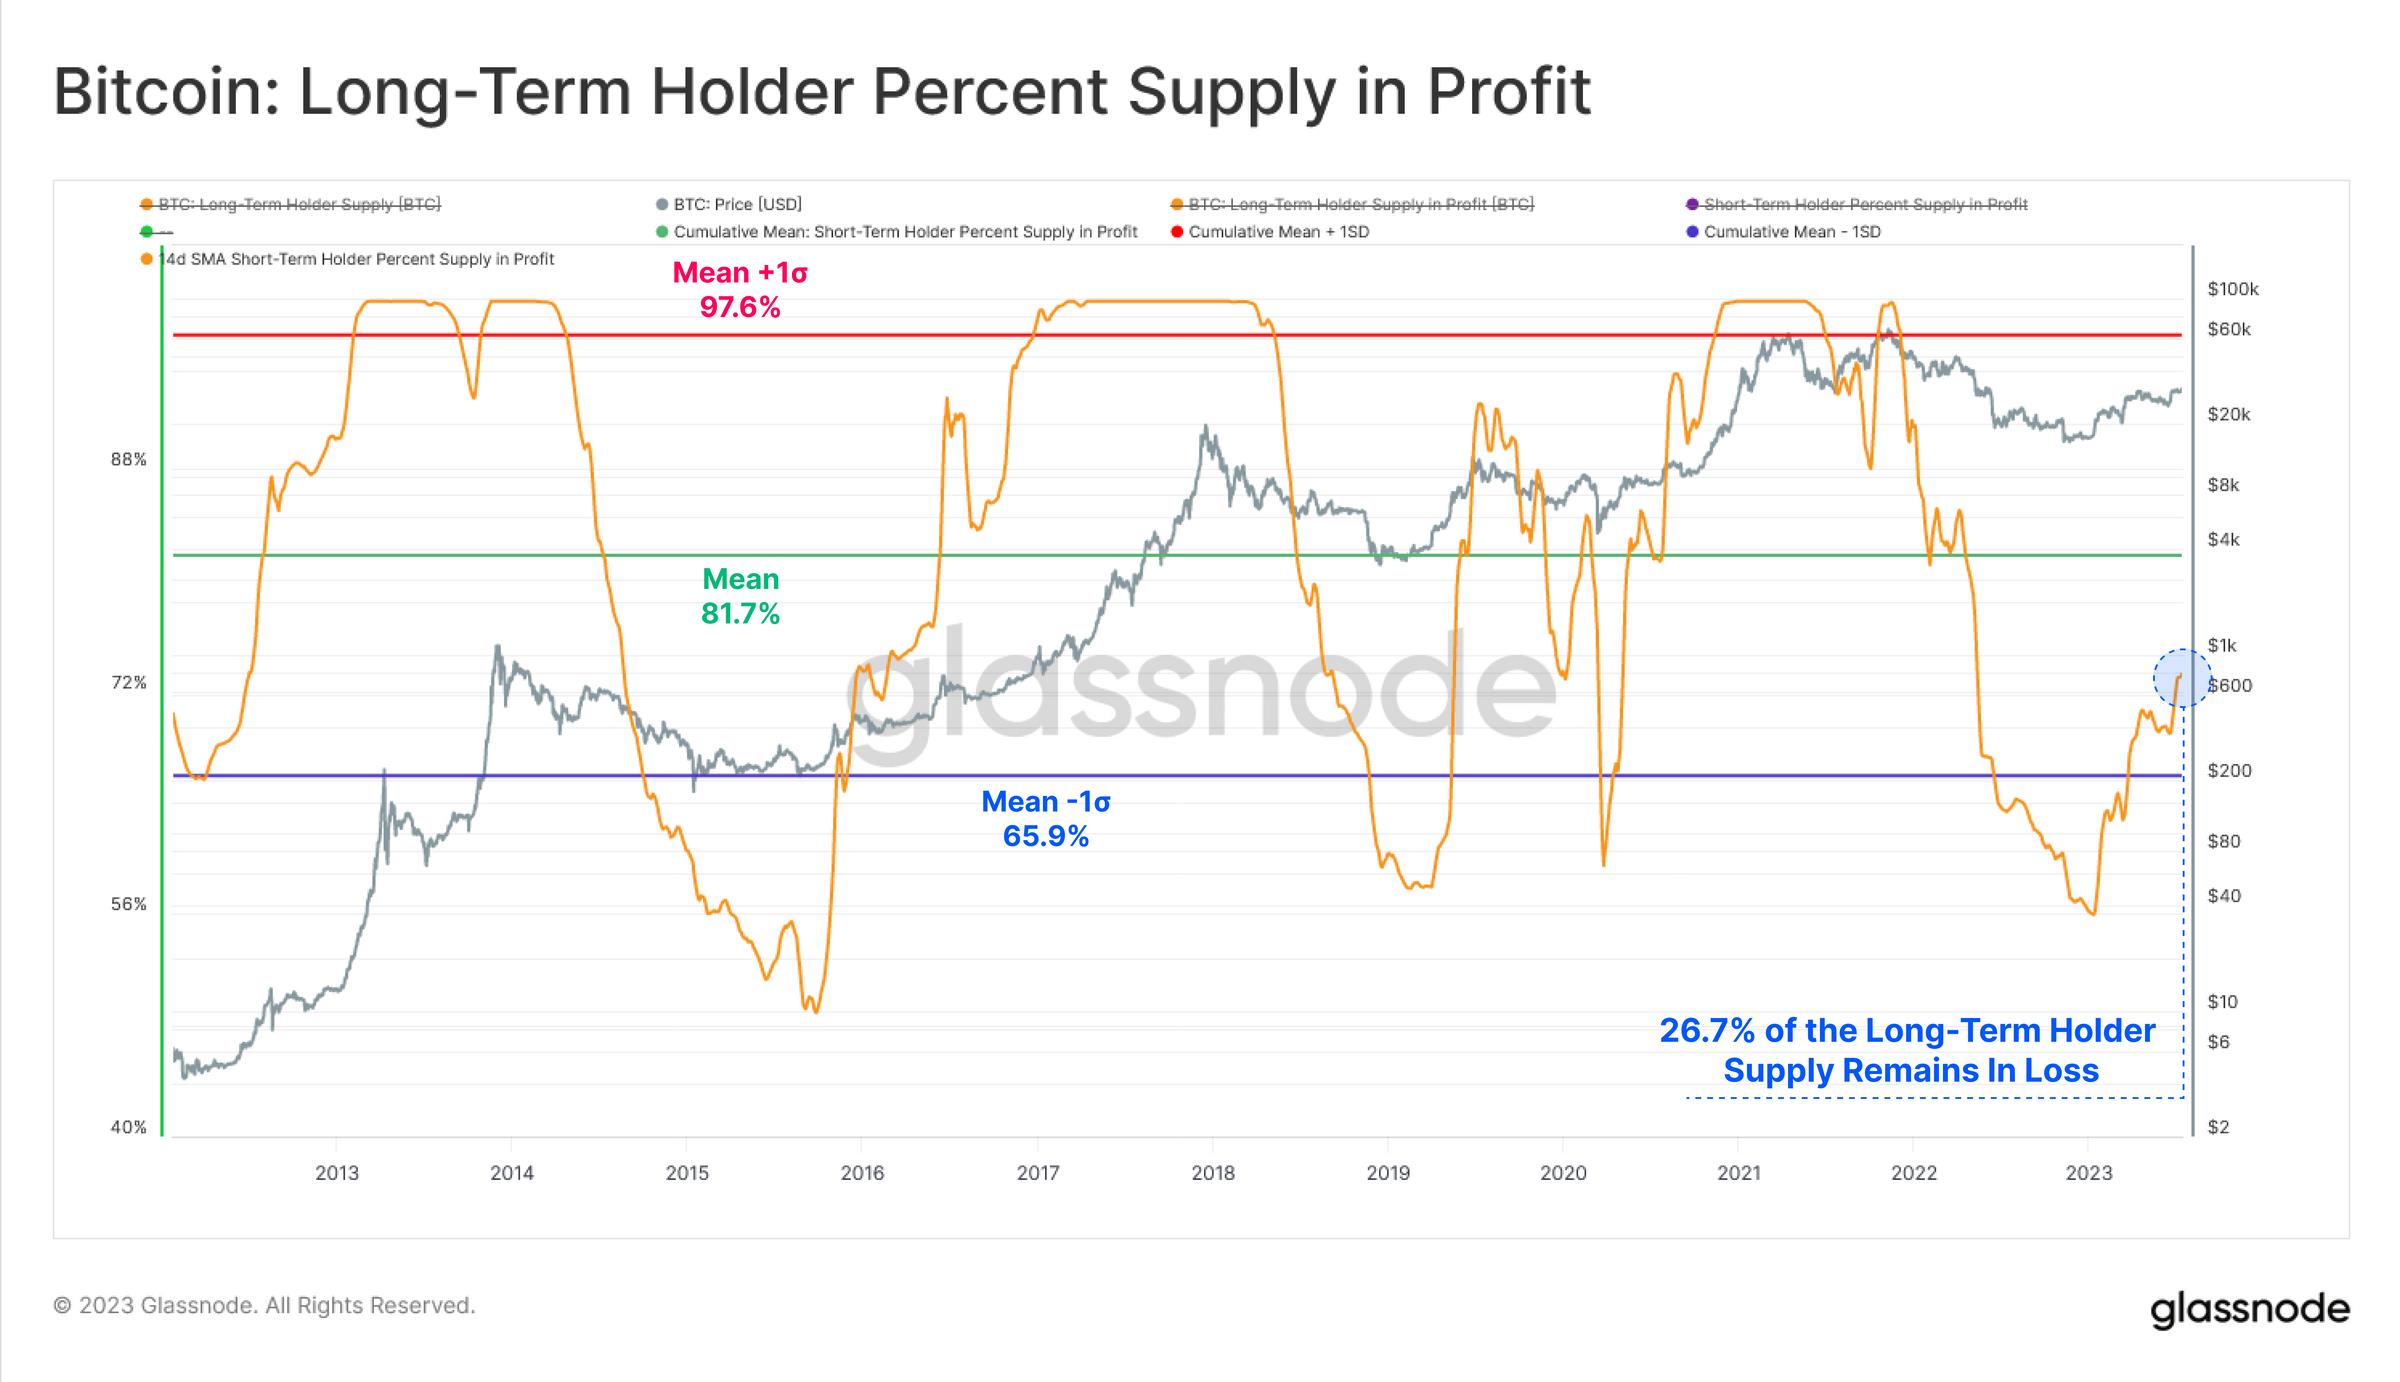
For long-term holders, profitability is gradually improving, though still at historically low levels and only recently emerging from a negative one-standard-deviation zone. While this is a positive trend, over 26.7% of long-term holder supply remains underwater relative to their entry prices—well below historical averages.
Although 2023 has seen a reasonably solid recovery for Bitcoin and digital assets, these findings suggest several psychological cost basis hurdles remain to be overcome.
Conclusion
Volatility, liquidity, trading volume, and on-chain settlement volumes are all at historic lows. This increases the likelihood that the market is entering a period of extreme apathy, fatigue, or even boredom.
The long-term holder cohort remains unwavering, showing little inclination to part with their tokens. In contrast, the short-term holder cohort is teetering on the edge of profitability, with much of their supply acquired at prices above the current $26,000 trading range. This suggests this group is becoming increasingly price-sensitive, and numerous psychological price levels remain untested.
Join TechFlow official community to stay tuned
Telegram:https://t.me/TechFlowDaily
X (Twitter):https://x.com/TechFlowPost
X (Twitter) EN:https://x.com/BlockFlow_News