A Brief Analysis of NFT Price Manipulation—A Case Study of DenDekaDan Genesis Omikuji
TechFlow Selected TechFlow Selected
A Brief Analysis of NFT Price Manipulation—A Case Study of DenDekaDan Genesis Omikuji
This article will share our research on manipulative behaviors in the NFT market, using DenDekaDan Genesis Omikuji as a case study.
Introduction
In a recent article, we analyzed wash trading behaviors conducted to capture trading rewards. In that piece, we briefly introduced another form of wash trading aimed at misleading the market, manipulating prices, and/or artificially inflating trading volume. In this article, we expand on our research into NFT market manipulation using DenDekaDan Genesis Omikuji as a case study. Across this collection, we identified a series of abnormal behaviors suggesting organized, artificial price inflation.
Wash trades conducted to earn trading rewards are typically easy to detect, as they usually involve repeated transactions between a small set of wallets. These traders generally have little incentive to conceal the fact that tokens are being traded among the same individual or entity—primarily because NFT marketplaces (mainly X2Y2 and LooksRare) do not penalize such behavior when distributing trading rewards.
In contrast, wash trading designed to create a false impression of genuine value in an NFT collection is often carried out in more covert yet coordinated ways. Parties potentially interested in such market manipulation include: NFT project teams, market makers, or well-capitalized whales with sufficient technical expertise to influence the broader market. More importantly, to conceal the fact that trading volume—and price increases—are generated by only a few entities through circular trades, these manipulative activities often involve large numbers of wallets, making it difficult to detect manipulation by focusing solely on a handful of addresses.
Methodology
To effectively identify organized market manipulation behind NFT trades, we focus on analyzing two types of data:
- Transaction data: This includes on-chain data such as transactions and prices (transaction prices and floor prices), as well as off-chain data like asks and bids.
- Address correlation: This involves examining financial linkages among traders, such as historical fund transfers between wallets, shared funding sources, and common destinations for outgoing funds.
By analyzing transaction data, we can uncover suspicious trends in price and volume. By digging deeper into connections among wallets, we can investigate whether certain entities control large clusters of wallets for coordinated trading and examine their behavioral patterns.
Case Study: DenDekaDan Genesis Omikuji
We sought to understand why the floor price of this collection surged from 0.05 ETH to 2.5 ETH (a 5,000% increase) within the first week following its launch on December 31, 2022. After analyzing the data, we found:
-
The combination of floor price trends, transaction prices, and ask price distributions reveals suspicious patterns, potentially indicating underlying price manipulation.
-
Among the addresses active in trading the collection during its first week, many exhibit financial interconnections.
Finding 1: The floor price shows a regular upward trend
The collection launched on December 31, 2022, and exhibited a consistent upward trend in floor price during the first week post-launch.
First, around January 1, the floor price rose to approximately 1 ETH. Over the next four days—from January 2 to January 5—the price increased by about 0.5 ETH every other day (on January 3 and January 5). After reaching approximately 2 ETH, the floor price stabilized within the 2–2.5 ETH range. While this regular pattern could be coincidental, it raises suspicion and prompted further investigation.
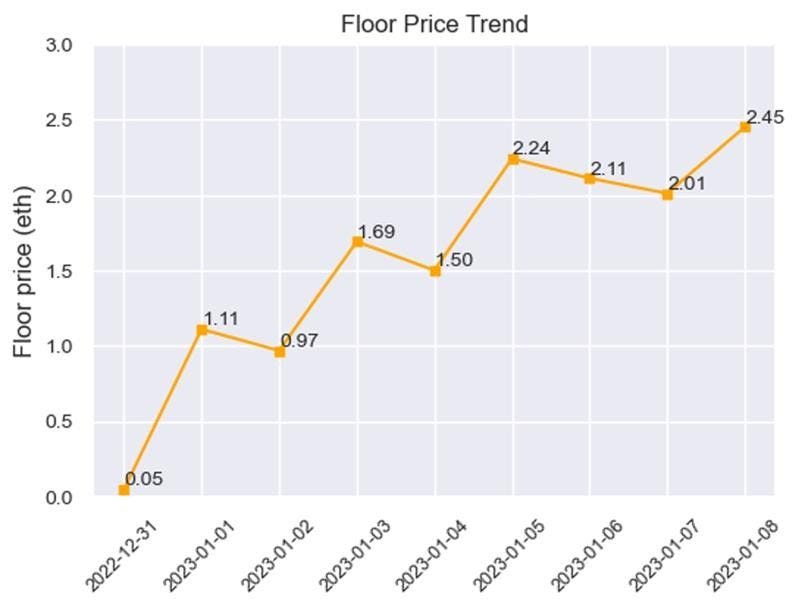
Figure 1: Regular increase in floor price during the first week after launch
Finding 2: Trading volume and transaction price distribution are also suspicious
Comparing daily trading volume with floor price trends, we observed that days with significant floor price changes (December 31, January 1, January 3, January 5) had much higher trading volumes than days with relatively stable prices (e.g., January 2, January 4, January 6). This suggests deliberate execution of large volumes of trades on January 1, January 3, and January 5 to influence the floor price.
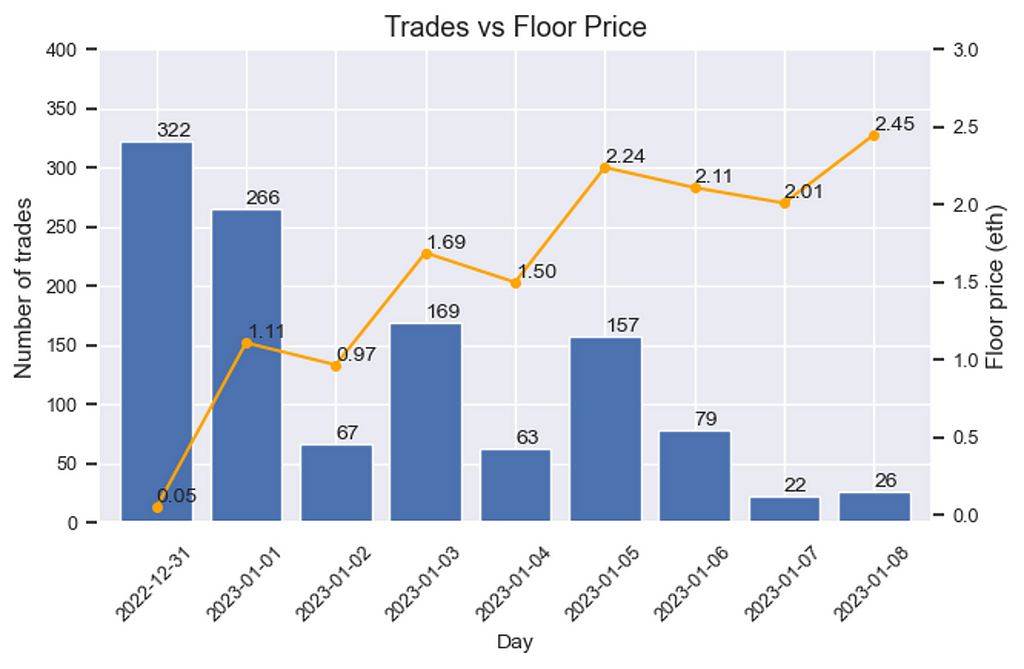
Figure 2: Trading volume spikes on days when floor price sharply increases
To test this hypothesis, we further examined the distribution of transaction prices during the first week. As shown in the chart below (with different colors representing transactions on different dates), nearly all daily transactions occurred at or slightly above the prevailing floor price. This is noteworthy because the most direct way to raise the floor price to a target level is to sweep all listings below that price. This serves as another signal of organized price manipulation.
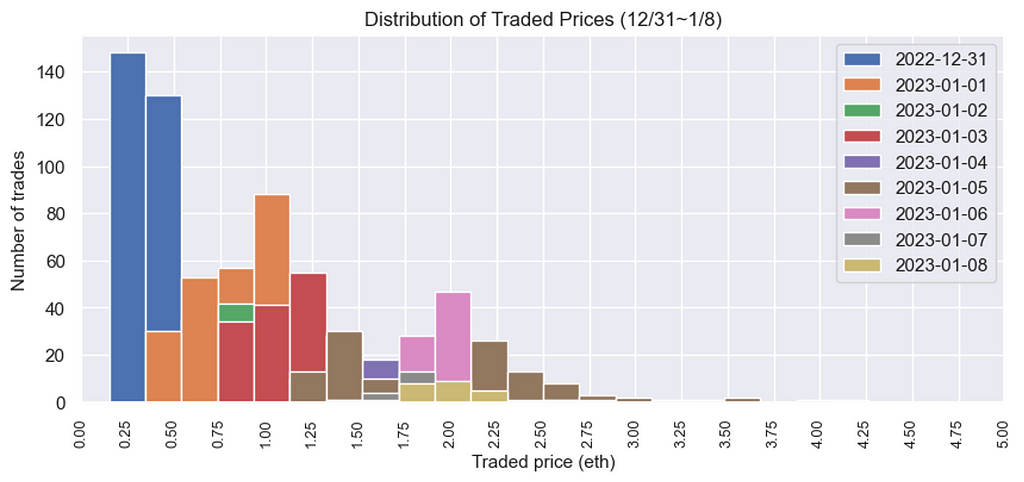
Figure 3: Transaction price distribution during the first week after launch
Finding 3: Ask price distribution mirrors transaction price patterns
Another key factor in raising the floor price is creating new asks (since floor price = lowest ask). Examining the distribution of ask prices, we found a pattern similar to that of transaction prices: ask prices moved systematically from lower to higher levels. Under normal circumstances, shortly after a collection’s launch—before consensus on its value forms—we would expect to see a more scattered distribution of seller asking prices. The observed orderly progression suggests coordination.
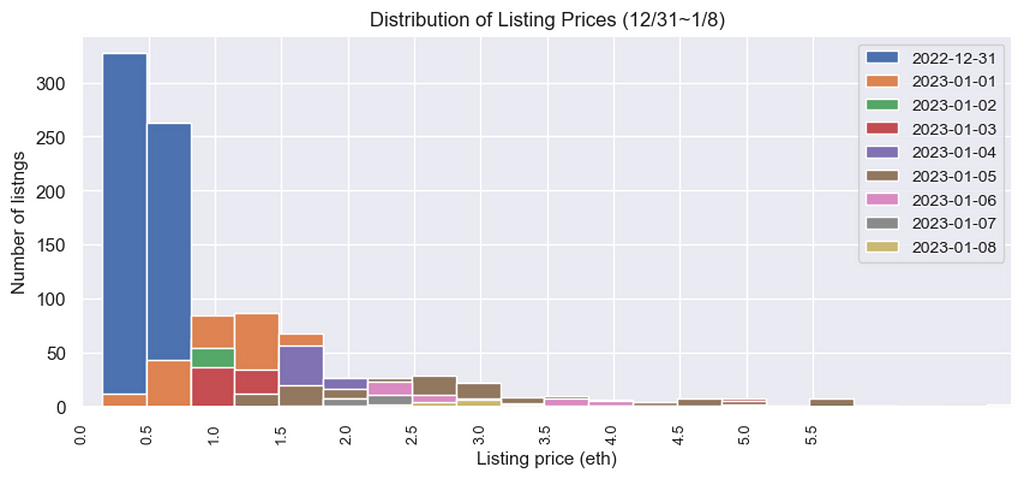
Figure 4: Ask price distribution during the first week after launch
Finding 4: Address Correlation
We found that 141 addresses (15%) among all first-week traders could be linked based on ETH transfer relationships between wallets. These addresses accounted for approximately 40% of the total trading volume during that week. This concentration raises the possibility that these wallets were controlled by a single entity or coordinated group, potentially the force behind the price manipulation. (Note: This study was conducted before we developed a more accurate address clustering algorithm for identifying wallet relationships, so the correlation data presented here may contain some inaccuracies. Nevertheless, we emphasize that identifying address clusters is highly valuable in investigating potential market manipulation.)
Conclusion
In this study, we shared a framework built upon our experience and industry knowledge to analyze NFT price manipulation. While it helps reveal suspicious patterns and behaviors, we acknowledge that this framework is still incomplete and continuously evolving. Given the scarcity of similar research, we hope that sharing our methodology contributes to the NFT ecosystem and the broader on-chain data analytics community. We also aim to spark discussion, draw greater attention to NFT market manipulation, and encourage further research and analysis. We believe that through collective efforts across the community, we can deepen our understanding of these issues and work toward sustainable development in this space.
Join TechFlow official community to stay tuned
Telegram:https://t.me/TechFlowDaily
X (Twitter):https://x.com/TechFlowPost
X (Twitter) EN:https://x.com/BlockFlow_News