
Chainalysis Latest Web3 Report Summary: NFTs Become Gateway for Newcomers, DeFi Dominates DAOs
TechFlow Selected TechFlow Selected
Chainalysis Latest Web3 Report Summary: NFTs Become Gateway for Newcomers, DeFi Dominates DAOs
Chainalysis has released their latest Web3 report; below is the summary of this 109-page report.
 Navigating Web3 tides with focused insights
Author: Joel John, Chainalysis
Translation: TechFlow intern
Chainalysis has released its latest Web3 report. Below is a summary of this 109-page document, along with some of my commentary.
One quick note before we begin— I use multiple charts to draw or support a conclusion. Different people may interpret the same data in entirely different ways. Data by itself is meaningless, which is why I back every claim with four or five charts—each piece being part of a larger picture. Let’s get started.
Retail is gathering here—through NFTs and gaming
The goal of crypto is mass adoption, but technology doesn’t jump from 0 to 100 overnight. It won't go from secret military tech to something your mom uses overnight. Instead, it seeps through social structures—starting with niche markets. This is clearly visible when flipping through the report, and the first chart that caught my attention illustrates this perfectly.
As early as Q1 2021, cross-chain transaction volume began declining—but the number of transfers did not. It wasn’t until Q1 of this year that transfer counts increased again. One reason: by Q2 2022, token prices were at historic highs—so multiplying by base price shows higher transaction volume. However, I find that while trading volume declined, the number of transfers remained within 10% of their all-time highs, for several reasons.
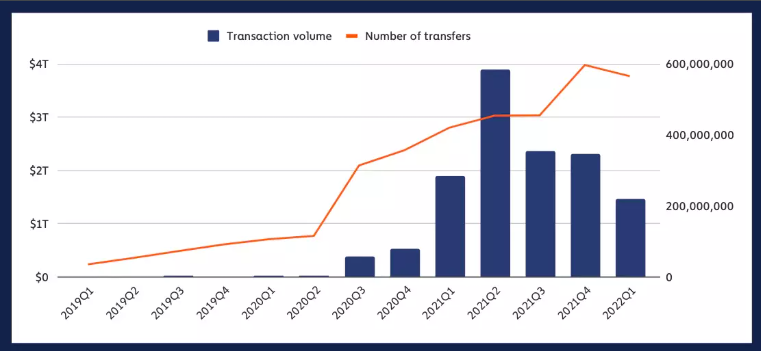
Historically, when reviewing transaction volume and transfer data, I assumed most activity was bots. But the industry has evolved. The chart below shows the relationship between received amounts and transfer counts.

Here, two retail-focused services stand out: gaming and NFTs. In terms of transaction volume (over $100 billion) and transfer count (over 10 million), NFTs appear far more active than gaming, where transfer volume hovers around just 8 million. Part of this may be due to high-value NFTs like Bored Apes (peaking above $500,000) compared to lower-priced in-game assets. My take—both areas have captured public imagination, and interest in gaming and NFTs today is significantly higher than in 2019.
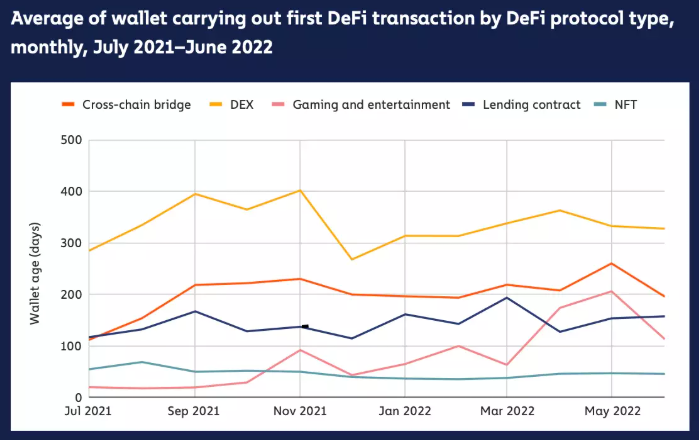
Check the chart below showing average wallet age per product category. DEX wallet addresses plateau around 300 days, suggesting the average DeFi user has been active for about a year. In contrast, game and NFT wallets show average activity under 50 days.
The higher number for gaming-related wallets likely reflects the recent decline of play-to-earn (P2E) models, leaving only older wallets still active. For NFTs—the figure remains flat, indicating a steady influx of new, active wallets into the ecosystem. (Or alternatively, users try NFTs and leave immediately, keeping the average wallet age low...)
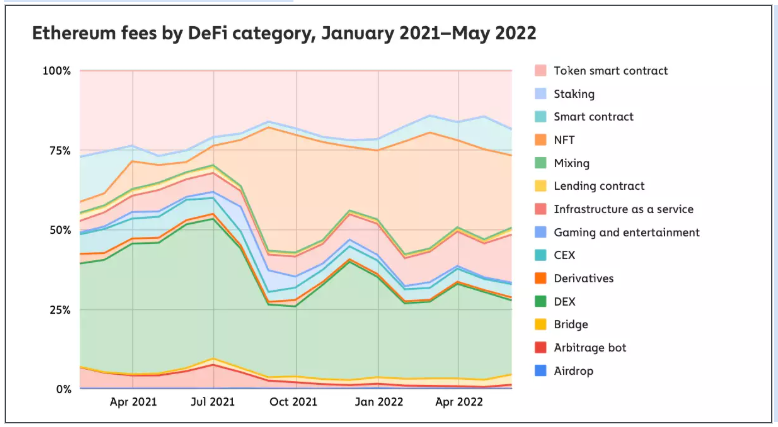
New wallets don’t matter much until they start spending—and that’s exactly what the next chart reveals. Until July 2021, NFT payment fees were below 5%; now they’re around 20–25%. I find this fascinating—as among all categories tracked by Chainalysis, NFTs are growing the fastest.
In short—average transaction size is trending downward, but transaction frequency is rising. NFTs are becoming a key onboarding path for new users.
Exchanges face their reckoning moment
Decentralized exchanges (DEXs) are having a breakthrough moment—their on-chain trading volume now matches that of centralized exchanges (CEXs). At peak, DEX-related volume was about 2.5x that of CEXs, though this may have been heavily driven by liquidity incentives. Without such incentives, users might return to CEXs for speed and cost efficiency.
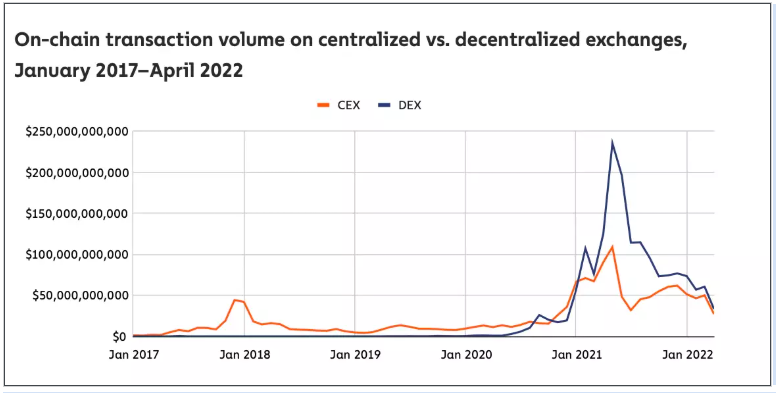
More on-chain volume flows to decentralized exchanges than to centralized ones. Currently, about 55% of trading volume goes to DEXs. I believe this share will keep rising as Layer-2-centric DEXs mature within DeFi. Several factors contribute:
DeFi is whale-dominated—thus, the average DEX trade is much larger than typical retail trades on CEXs
Once funds are deposited, CEXs do not record trades on-chain, so they contribute nothing to on-chain trading volume
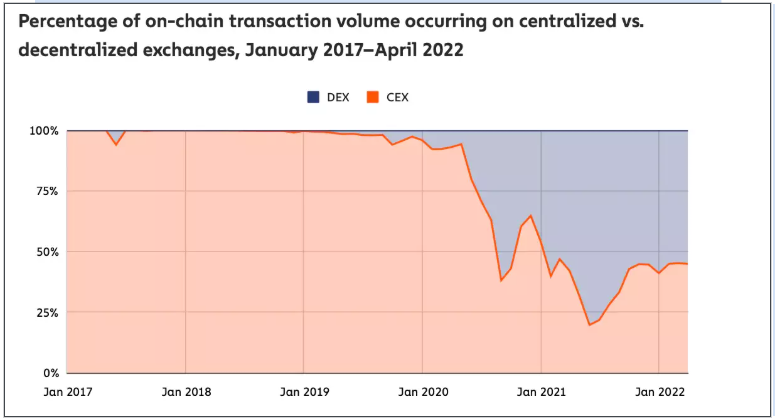
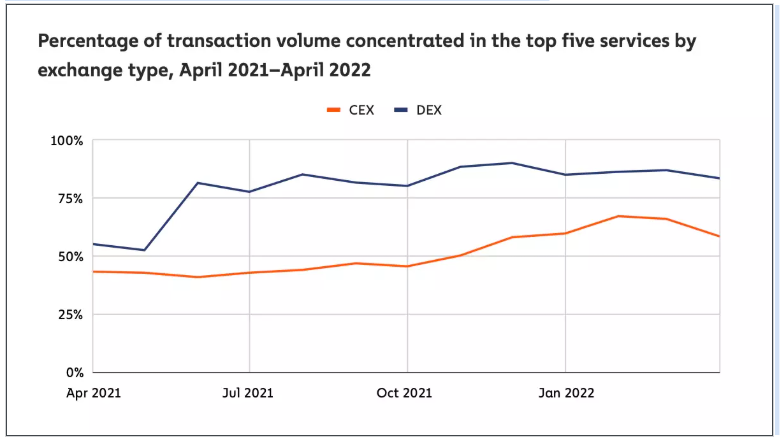
Interestingly, Chainalysis’ data also reveals harsh realities in DeFi. For example, the top 5 DEXs account for about 85% of trading volume. Among CEXs, the concentration is even higher—around 95%. So if you're not in the top 5 DEXs, you're competing for just ~15% of volume.
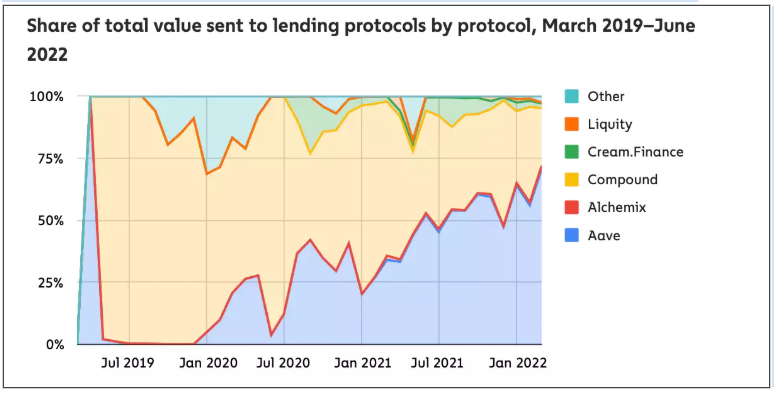
What about lending platforms? Aave and Compound currently control about 90% of lending volume. The remaining 10% is what all other lending protocols must compete for.
One could look at this data and say, “DeFi lending is highly centralized,” but markets often follow venture capital patterns. Given volatility and liquidation events over the past months, these platforms have performed remarkably well. I highlight these datasets to illustrate how intense competition is among secondary DeFi protocols. Being a DeFi founder isn’t easy.
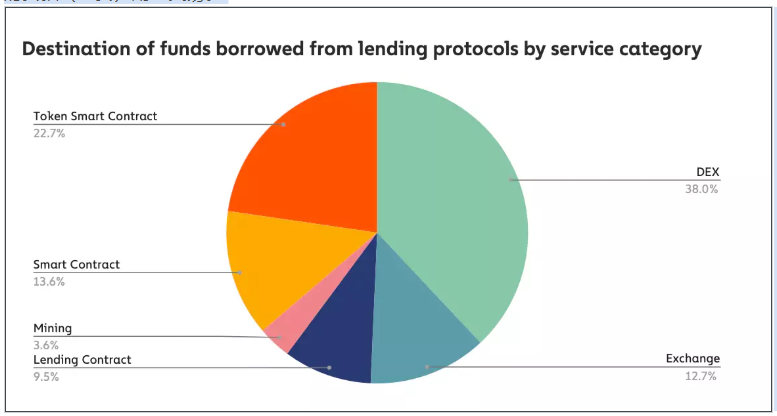
The data shows what most people use DeFi loans for: about 38% send loaned funds to DEXs—typically swapping them for another asset expected to appreciate faster than the loan’s interest rate. Essentially, this is leveraged trading. Around 13% of volume flows to exchanges—hard to determine exact usage. Overall, half of all DeFi loans eventually flow back into exchanges.
I found it interesting that only 3.6% of loaned funds go to miner-related wallets. I suspect miners obtain leverage from more centralized sources like Nexo or banks. Therefore, it's safe to say that DeFi-linked loans are primarily used for trading.
DeFi dominates DAOs
Today, nearly everything has a DAO. Their effectiveness and relevance remain debated, but clearly, DeFi-related DAOs will dominate in the foreseeable future. DeFi-related VCs hold about 83% of total DAO capital. On average, each DeFi-related DAO manages around $100 million. Cash flows and operational costs for DeFi VCs are fully on-chain. Once a DAO interacts with the off-chain world, transparency drops sharply (e.g., 3AC).
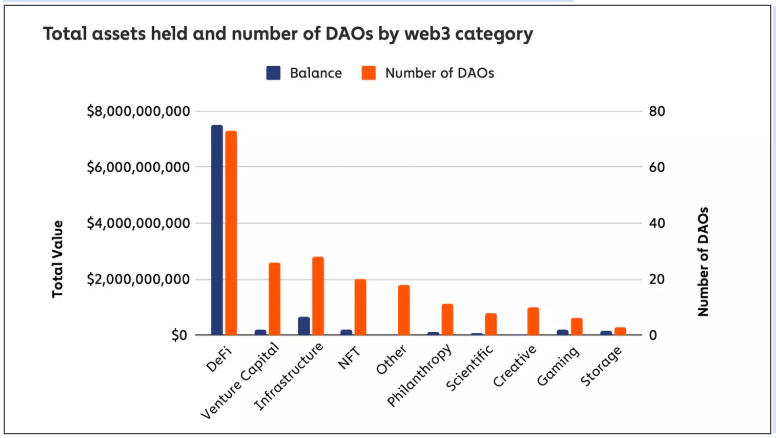
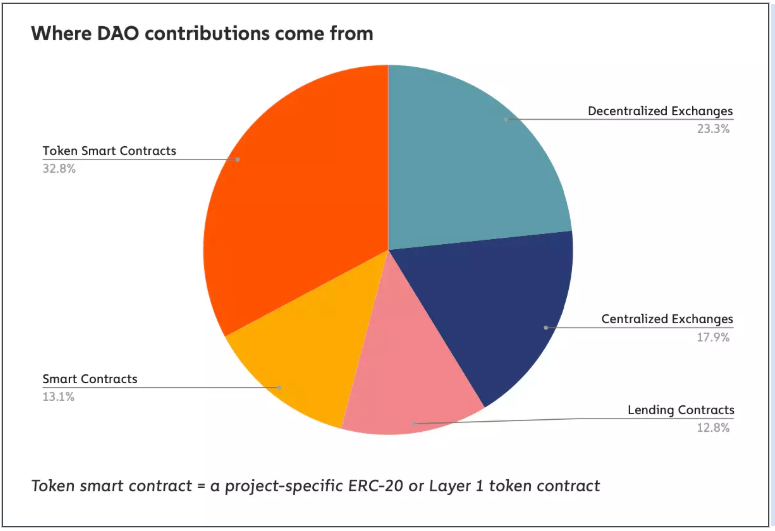
However, one caveat: among DAOs reviewed by Chainalysis, about 85% store all their funds in a single asset. This is typically the project’s native token. Only about 23% of tracked DAOs use stablecoins. Among them, roughly 130 DAOs hold less than 10% of their AUM in stablecoins, while only about 40 DAOs have stablecoins comprising over 75% of their AUM. The data is somewhat limited—it only examines the number of DAOs and capital allocation percentages. Dollar values would provide clearer insights.
NFTs are the new DeFi
Think the bear market killed NFTs? No. About $37 billion has already flowed into NFTs in 2022—compared to $40 billion for all of 2021.
At the time of the report, approximately 750,000 NFT buyers and sellers were active on-chain. This peaked in Q1, reaching nearly 1 million users. This represents the total scale of the NFT market to date. Notably, this number is about 20 times higher than in Q1 2021. By any measure, 2022 hasn’t been a bad year for NFTs.

Institutional NFT transactions are rare. In terms of transaction frequency, over 90% of trades involve assets valued below $10,000. Does this mean institutions are irrelevant? No. Institutions handling $10k–$100k assets (and traders with over $100k in transaction volume) account for about 90% of total transaction value.

At this point, we can see the market splitting into two segments:
Affordable NFTs, likely traded on L2s or low-cost chains like Solana. Lower fees improve user experience rather than incentivize speculation.
High-value NFTs comparable to art, music tokenization, or Bored Apes. These buyers care only about end results and won’t mind paying hundreds in gas fees.
Founders must choose which segment to serve. For most NFTFi founders, focusing on the latter may be crucial for scalability. Metastreet.xyz is a great example. The chart below explains why.

The number of NFT-related transactions exceeding $100,000 is currently peaking. As of April 2022, there were over 4,000 such monthly transactions. For projects, capturing even a small fraction of this volume—even charging just 0.2%—can yield substantial revenue. The report also dives into virtual real estate (VRE) holding behavior.
“In 10 out of 11 projects studied, users held VRE NFTs for less than 25% of the time since launch. In 6 out of 11, holding duration was under 15%. In other words, most VRE purchases in these projects ended in flips.”
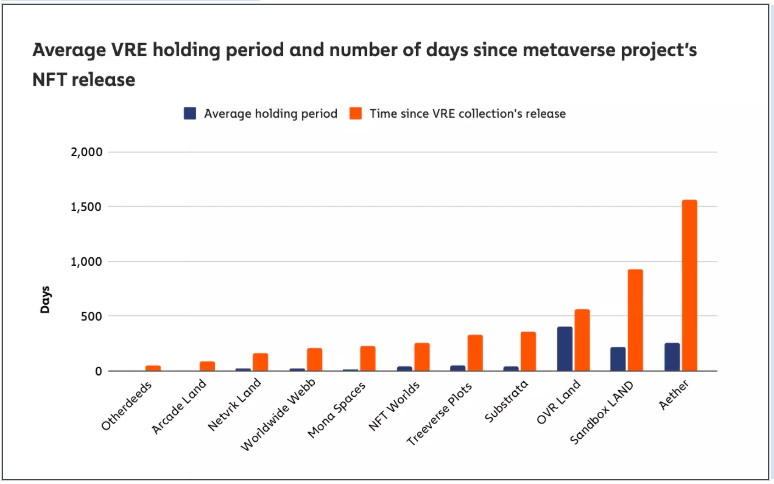
This shows VRE behaves more like tradable tokens—people buy with the intent to resell at a higher price. One thing I’d love to see is the average number of days after launch when each metaverse property hits its all-time high (ATH), and how long it holds that value. I suspect ATHs occur within days of launch and do not retain value over time.
The rest of the report covers UST depegging. I’ll skip that for now, but I’ll summarize notable money laundering activities observed. The report mentions a “platform” rewarding users with tokens based on trading volume—I suspect this refers to LooksRare.
Money laundering often involves fake trades between parties to create artificial volume. In crypto, someone can deploy thousands of wallets to farm airdrops. These airdrop farmers are impressive in their audacity. They traded roughly 650,000 ETH, buying and selling just three NFTs among themselves.
They never interacted with any external buyer or seller. These wallets collectively spent $114 million in gas fees and received airdrops worth about $185.5 million.

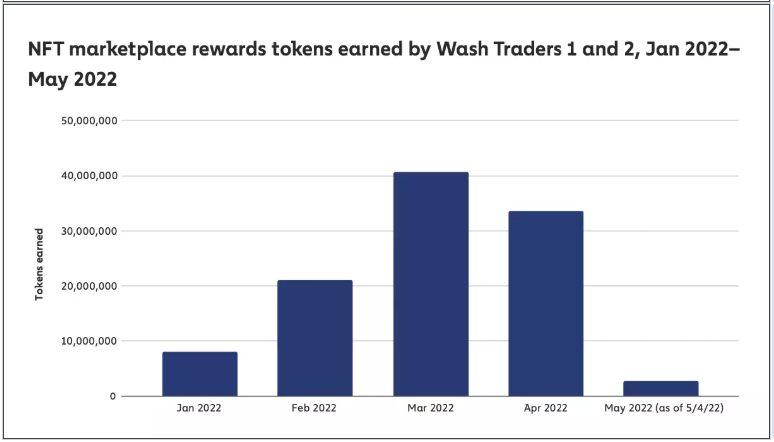
What baffles me is why projects didn’t revoke airdrops from these addresses, given how easily detectable these transactions are on-chain. If you’re one of these airdrop farmers, please reach out—I’d love to interview you.
TL;DR
DEX trading volume has surpassed $1 trillion
About 55% of assets flow to exchanges
NFTs are a critical entry point for new users. Wallets interacting with NFTs have an average lifespan of 10 days, versus 300 days for DeFi
NFTs are the fastest-growing on-chain spending category. On Ethereum, their share rose from 5% a year ago to ~25% today
DEXs follow a brutal power law—the top 5 DEXs account for ~85% of trading volume
Lending platforms show similar concentration—Aave and Compound control ~90% of funds routed through lending protocols
50% of assets taken from lending platforms flow to exchanges
The average AUM for DeFi-related DAOs is ~$100 million (60 DAOs managing $6 billion total)
85% of DAOs tracked by Chainalysis hold all funds in a single asset. Among those using stablecoins, USDC is more popular than DAI
Transactions under $10,000 account for over ~90% of NFT trade frequency. In the last quarter, there were about 750,000 active NFT buyers and sellers
Join TechFlow official community to stay tuned
Telegram:https://t.me/TechFlowDaily
X (Twitter):https://x.com/TechFlowPost
X (Twitter) EN:https://x.com/BlockFlow_News
 Chainalysis