Buying Bitcoin Is Not as Good as Buying the Nasdaq Index—This Statement Has an Expiration Date
TechFlow Selected TechFlow Selected
Buying Bitcoin Is Not as Good as Buying the Nasdaq Index—This Statement Has an Expiration Date
It’s easy to make retrospective judgments, but difficult to place bets in advance.
Author: Kuli, TechFlow
U.S. equity traders have had an exceptionally comfortable six months.
The S&P 500 and Nasdaq 100 have repeatedly hit all-time highs; the AI capital expenditure narrative has grown ever more compelling; and account net asset values have risen accordingly. Bitcoin, by contrast, has retreated from its October 2025 peak of $126,000 to around $80,000—a decline of 37%. For holders, the prevailing sentiment can be summed up in just two words:
Agony.
This emotional disparity is now fermenting on social media into a new narrative: Buying U.S. tech stocks is simply better than buying Bitcoin—and it’s been true most of the time.
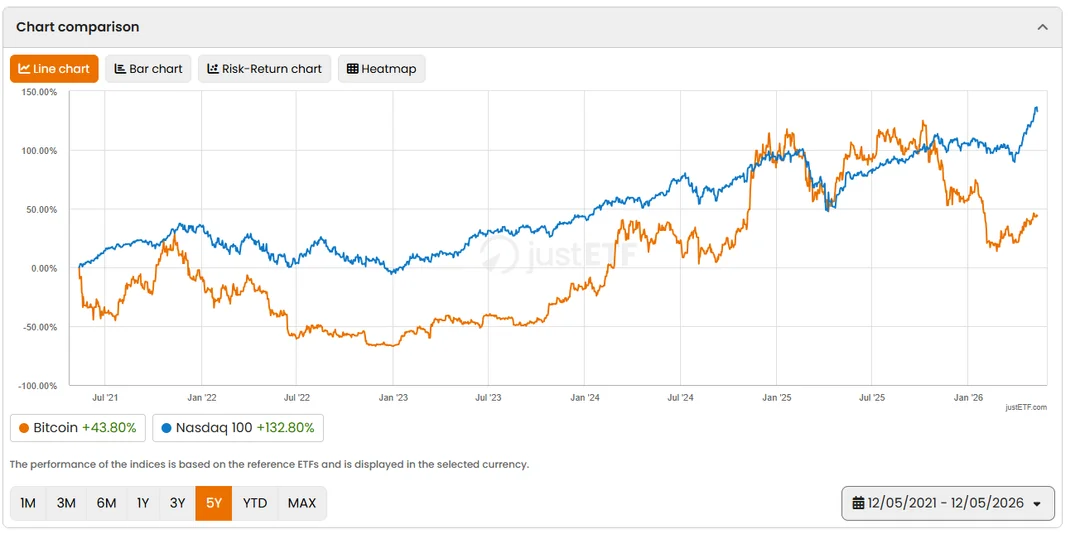
On Reddit’s cryptocurrency board today, one post even crystallized this sentiment. A user shared a comparison chart, showing that over the past five years, the Nasdaq 100 rose 132.8%, while Bitcoin rose only 43.8%.
Note that this chart uses the European DD/MM/YYYY date format; the actual window runs from May 12, 2021, to May 12, 2026, and benchmarks euro-denominated ETFs.
Since 2021, the U.S. dollar has appreciated approximately 18% against the euro, further amplifying the apparent gains of dollar-denominated assets from a euro perspective. Converting to nominal USD prices, the Nasdaq 100’s gain over the same period stands at roughly 121%, versus Bitcoin’s ~43%—a still-substantial gap.
The poster’s own summary cuts even deeper: “What’s going on here? I suspect the answer is AI—it changed everything.”
Bloomberg ran a similar report in February this year, with an even blunter headline: “Bitcoin’s Five-Year Return Trails the S&P 500, Nasdaq 100, and Gold.”
Investments Have Expiration Dates
The five-year window in the chart above begins in December 2021.
At that time, Bitcoin had just pulled back from its cycle high of $69,000 to around $48,000, while the Nasdaq 100 stood near 16,300 points—and the AI narrative had yet to ignite. This means Bitcoin’s starting point was set at the elevated plateau near the end of a bull market, whereas the Nasdaq’s starting point coincided with the eve of the AI super-cycle.
Emotionally, promoting U.S. equities over BTC is understandable—but does the data hold up if we zoom out further? If we shift the starting point forward or backward by several months—or even years—the outcome flips dramatically.
We conducted a simple analysis across five distinct time windows. All windows share the same endpoint: May 2026 (BTC ~$80,000; Nasdaq 100 ~29,000 points). Each window’s start date aligns with a key milestone in crypto or macro markets:
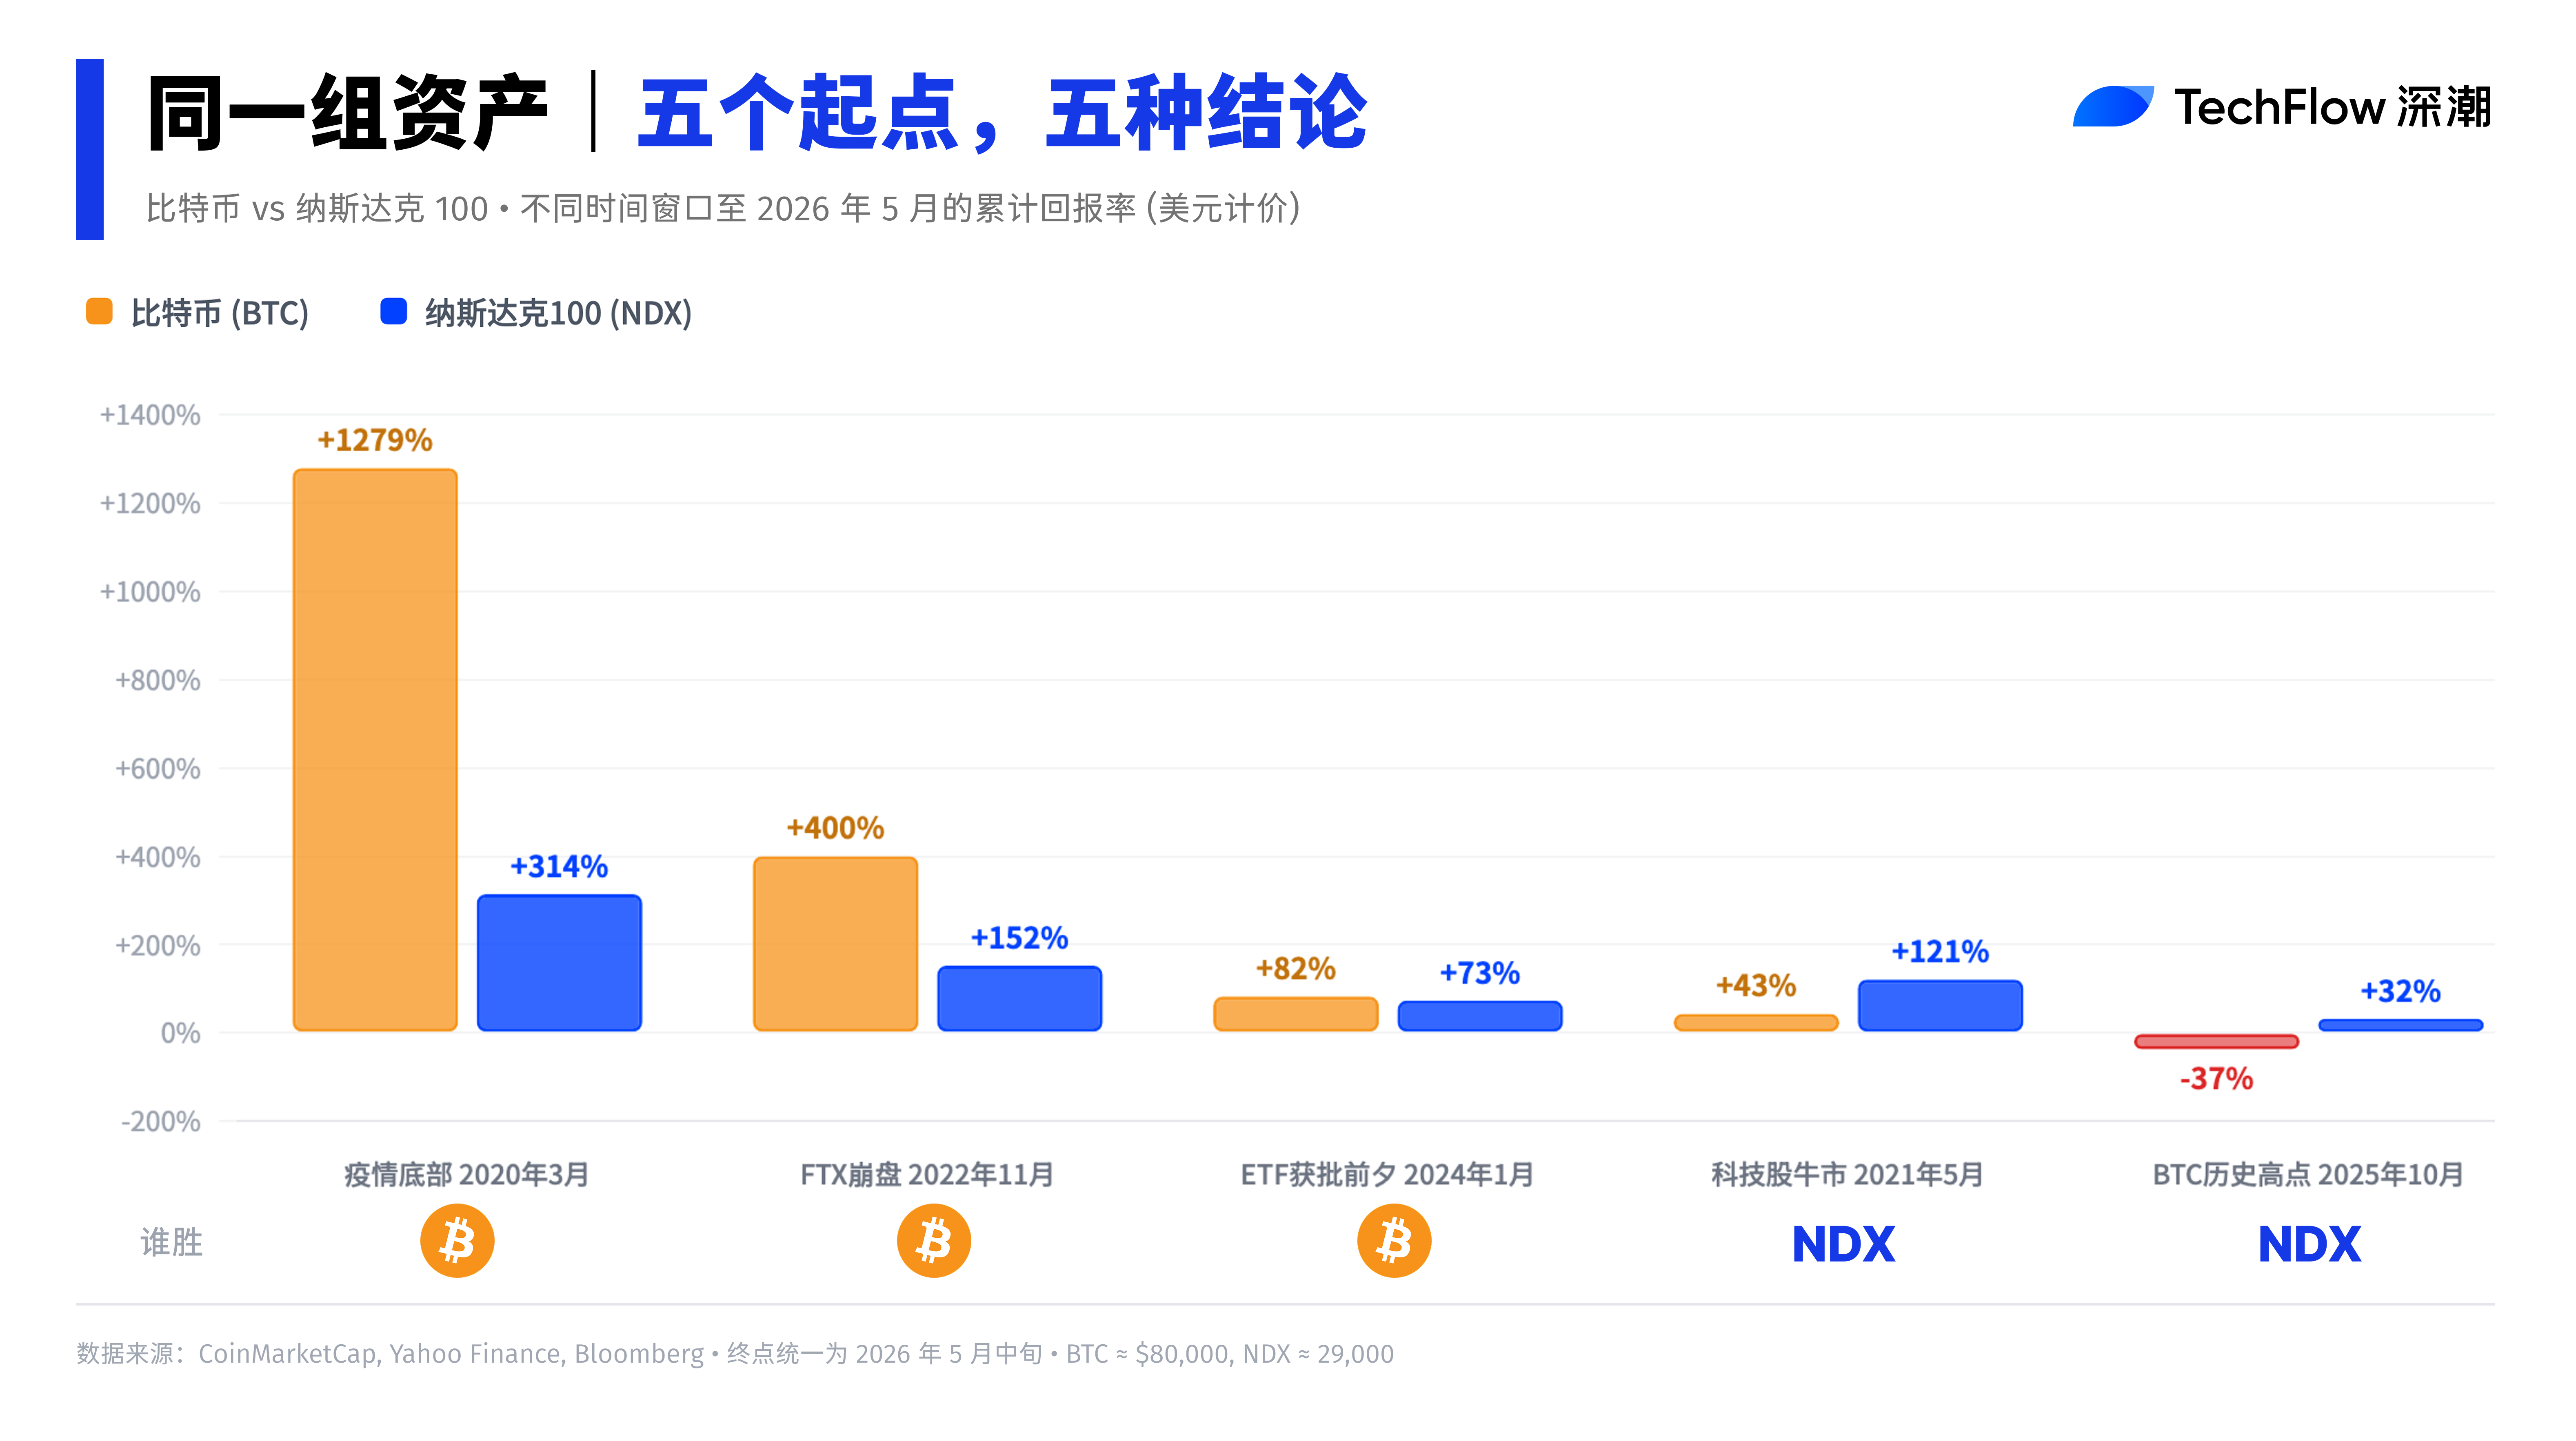
Pandemic Bottom (March 2020) → Now:
Bitcoin rose from ~$5,800 to $80,000—an increase of ~1,279%. The Nasdaq 100 rose from ~7,000 to 29,000 points—an increase of ~314%. Bitcoin’s return was over four times that of the Nasdaq 100.
FTX Collapse Bottom (November 2022) → Now:
Bitcoin rose from ~$16,000 to $80,000—an increase of ~400%. The Nasdaq 100 rose from ~11,500 to 29,000 points—an increase of ~152%. Bitcoin’s return remained 2.6 times that of the Nasdaq 100.
Pre-Bitcoin ETF Approval (January 2024) → Now:
Bitcoin rose from ~$44,000 to $80,000—an increase of ~82%. The Nasdaq 100 rose from ~16,800 to 29,000 points—an increase of ~73%. Returns were nearly identical, with Bitcoin edging slightly ahead.
This Tech Stock Cycle (May 2021) → Now:
Bitcoin rose from ~$48,000 to $80,000—an increase of ~67%. The Nasdaq 100 rose from ~16,300 to 29,000 points—an increase of ~78%. The Nasdaq 100 led.
Bitcoin All-Time High (October 2025) → Now:
Bitcoin fell from ~$126,000 to $80,000—a decline of ~37%. The Nasdaq 100 rose from ~22,000 to 29,000 points—an increase of ~32%. The Nasdaq 100 led decisively—and moved in the opposite direction.
The conclusion? Of the five windows, Bitcoin outperformed in three; the Nasdaq 100 outperformed in two. The Reddit post happened to select one of the windows where the Nasdaq 100’s odds of winning were highest.
Cyclical Assets vs. Trending Assets
The stark difference in sensitivity to starting points between Bitcoin and the Nasdaq 100 stems from their fundamentally distinct volatility structures.
The Nasdaq 100 comprises 100 large non-financial companies, backed by cash flows and earnings, exhibiting a long-term upward trending behavior. Even after its 33% correction in 2022, recovery was relatively steady.
Selecting any non-extreme starting point yields long-term returns within a relatively stable range.
Bitcoin, by contrast, is a quintessential cyclical asset. Historically, every bull-bear cycle has seen drawdowns from peak to trough ranging between 75% and 85% (as observed in 2014, 2018, and 2022); the drawdown from October 2025 to early 2026 also reached ~50%.
This extreme volatility means the phase of the cycle in which you begin measuring almost entirely determines your final return figure.
An analysis on Nasdaq.com put it even more bluntly: Bitcoin is essentially a leveraged version of the S&P 500.
In 2024, the S&P 500 rose 24%—Bitcoin rose 135%; in 2023, the S&P 500 rose 26%—Bitcoin rose 147%; in 2022, the S&P 500 fell 19%—Bitcoin fell 65%. Directionally aligned, but magnified 3–5× in magnitude.
This implies that choosing a starting point precisely at Bitcoin’s cycle top to compare performance inevitably yields the conclusion that “equities decisively beat Bitcoin”—a statistically near-inevitability. The reverse holds true as well.
Bitcoin Today May Be in a “Cyclical Undervaluation Zone”
Setting aside the “starting-point game,” the current market structure itself merits attention.
After peaking in October 2025, Bitcoin underwent a classic cyclical correction. In February 2026, it briefly dipped to ~$65,000 before rebounding to ~$80,000—still ~37% below its peak. Meanwhile, the Nasdaq 100, propelled by continued expansion in AI-related capital expenditures, kept hitting new all-time highs.
Such divergence is not unprecedented. In 2019, as Bitcoin surged from $3,000 to $12,000, its correlation with the S&P 500 nearly vanished. In 2022, both plunged in tandem, with correlation spiking to 0.92. Correlation between crypto markets and U.S. equities is dynamic and cyclical—not a fixed positive relationship.
Alex Thorn, Head of Research at Galaxy Digital, offered an intriguing perspective in December 2025:
If measured using the 2020 dollar’s purchasing power, Bitcoin’s nominal all-time high of $126,000 has never actually breached $100,000. Cumulative inflation from 2020 to 2025 totaled ~24%, introducing a systemic bias into year-over-year nominal price comparisons.
At a moment when Bitcoin sits 37% below its all-time high while U.S. equity indices simultaneously reach record highs, the narrative “stocks are beating Bitcoin” naturally dominates social media.
Yet history shows that each time this narrative peaks in volume, it often coincides with Bitcoin’s cyclical bottom zone. After the FTX collapse in late 2022, similarly loud declarations of “Bitcoin is dead” proliferated—only for Bitcoin to surge from $16,000 to $126,000 over the following 18 months.
Hindsight is easy; timely positioning is hard. Debating which asset delivers higher returns lacks micro-level utility. Any claim that “A is permanently superior to B,” drawn from a single time window, fails under even modest shifts in the starting point.
Each generation has its champions—but timing entry and exit remains eternally difficult.
Join TechFlow official community to stay tuned
Telegram:https://t.me/TechFlowDaily
X (Twitter):https://x.com/TechFlowPost
X (Twitter) EN:https://x.com/BlockFlow_News