

Analysis: Institutions Accelerate BTC Accumulation—Daily Purchases Reach 6x Mining Output, Target Price $96,000
TechFlow Selected TechFlow Selected
Analysis: Institutions Accelerate BTC Accumulation—Daily Purchases Reach 6x Mining Output, Target Price $96,000
It’s hard not to be bullish in the face of this series of data.
Author: Charles Edwards
Compiled by: TechFlow
TechFlow Intro: Institutional demand for Bitcoin has reached unprecedented levels—purchases are now at 577% of daily mining output. Historically, every time this threshold has been crossed, Bitcoin’s price has surged double digits within the following weeks. Meanwhile, on-chain data, technical indicators, and derivatives markets all signal strong bullish momentum—this may not be a localized frenzy, but rather the beginning of a broader rally.
Reasons to Be Bullish on Bitcoin and Equities
Since our last issue, institutions have aggressively bought Bitcoin—currently acquiring it at 577% of daily mining output. That figure is staggering. Bitcoin has already risen 12%.
Have we reached a local top? Or is this merely the start of a much larger move?
In this edition, we dive deep into Bitcoin and equities.
Bitcoin shows bullish signals across both on-chain and technical data. We reiterate what we wrote last time: “It’s hard not to be bullish in the face of this confluence of data.”
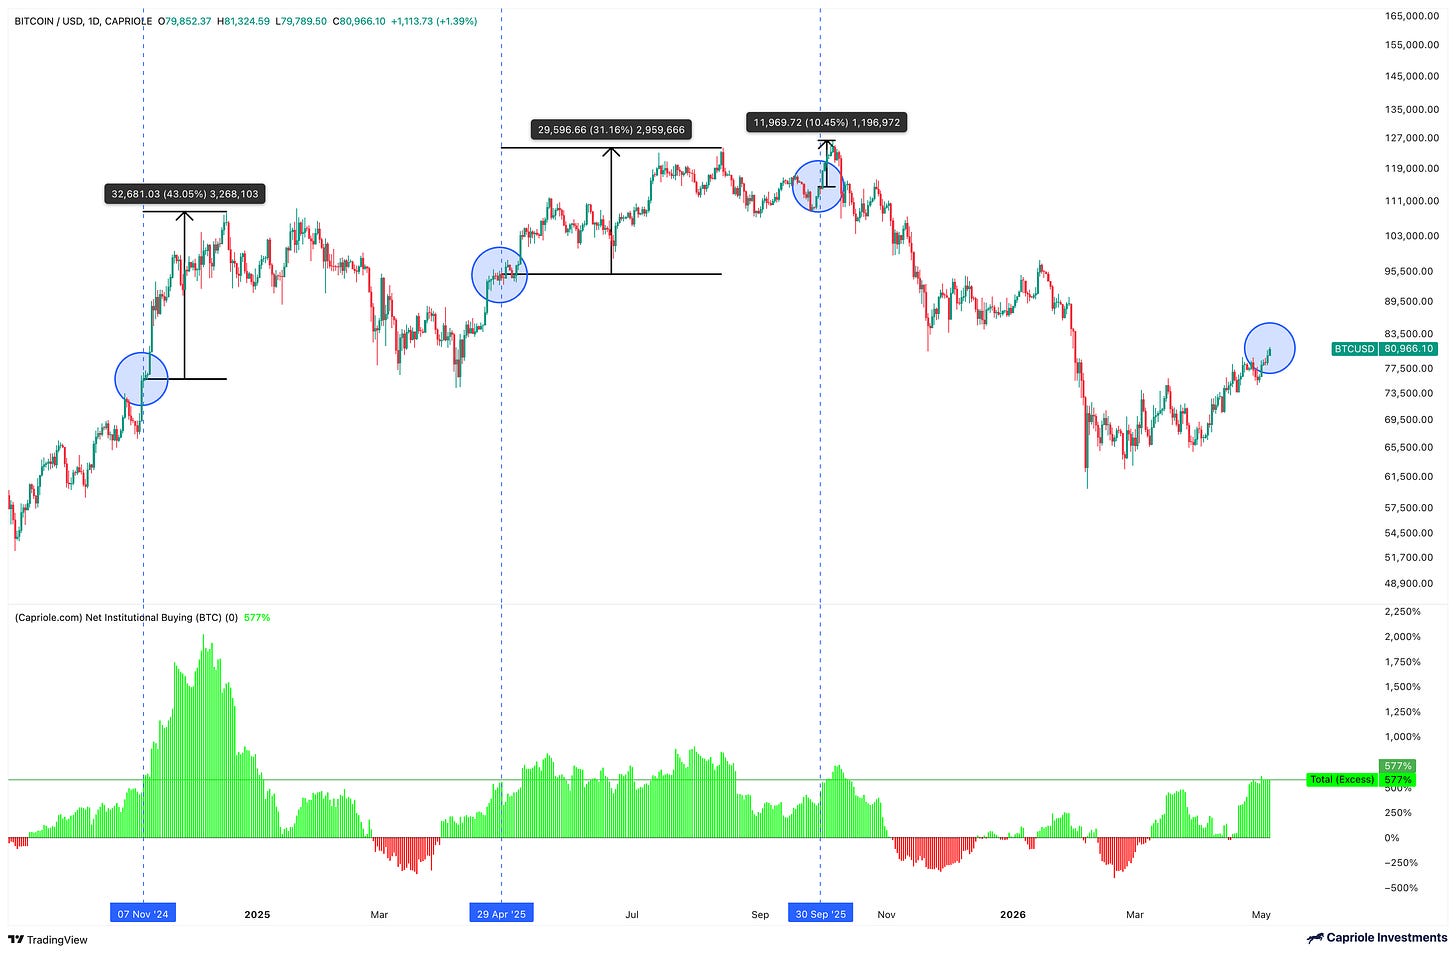
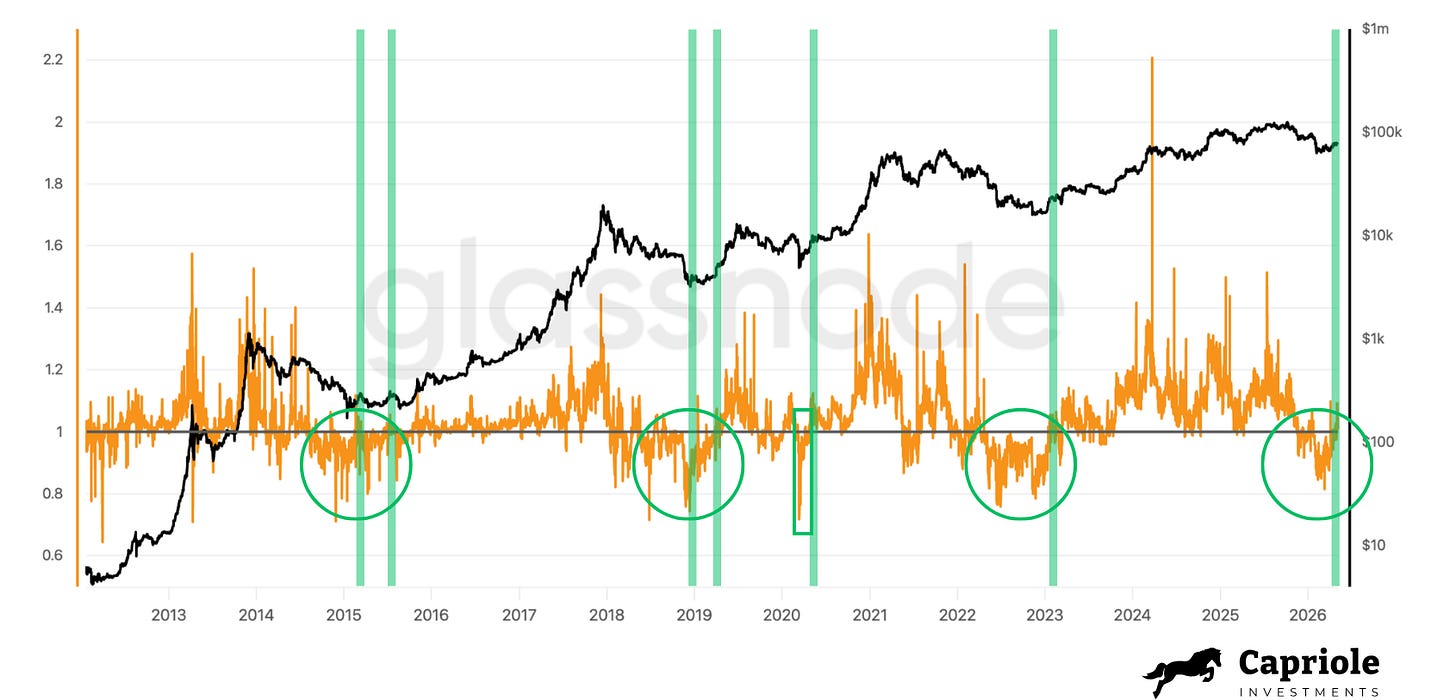
Institutions are buying Bitcoin at 600% of daily mining output.
Capriole’s longest-running on-chain and technical model is long Bitcoin at $71,000.
The March/April derivatives market saw full capitulation.
SOPR (Spent Output Profit Ratio) exhibited capitulation followed by a bullish breakout.
Institutional Demand for Bitcoin
Institutions are purchasing Bitcoin at over 600% of daily mining output. Every prior instance of such elevated demand was followed by sharp price surges within the subsequent week. As illustrated, in all previous cases, double-digit returns typically materialized within several weeks—potentially pushing price toward ~$96,000.
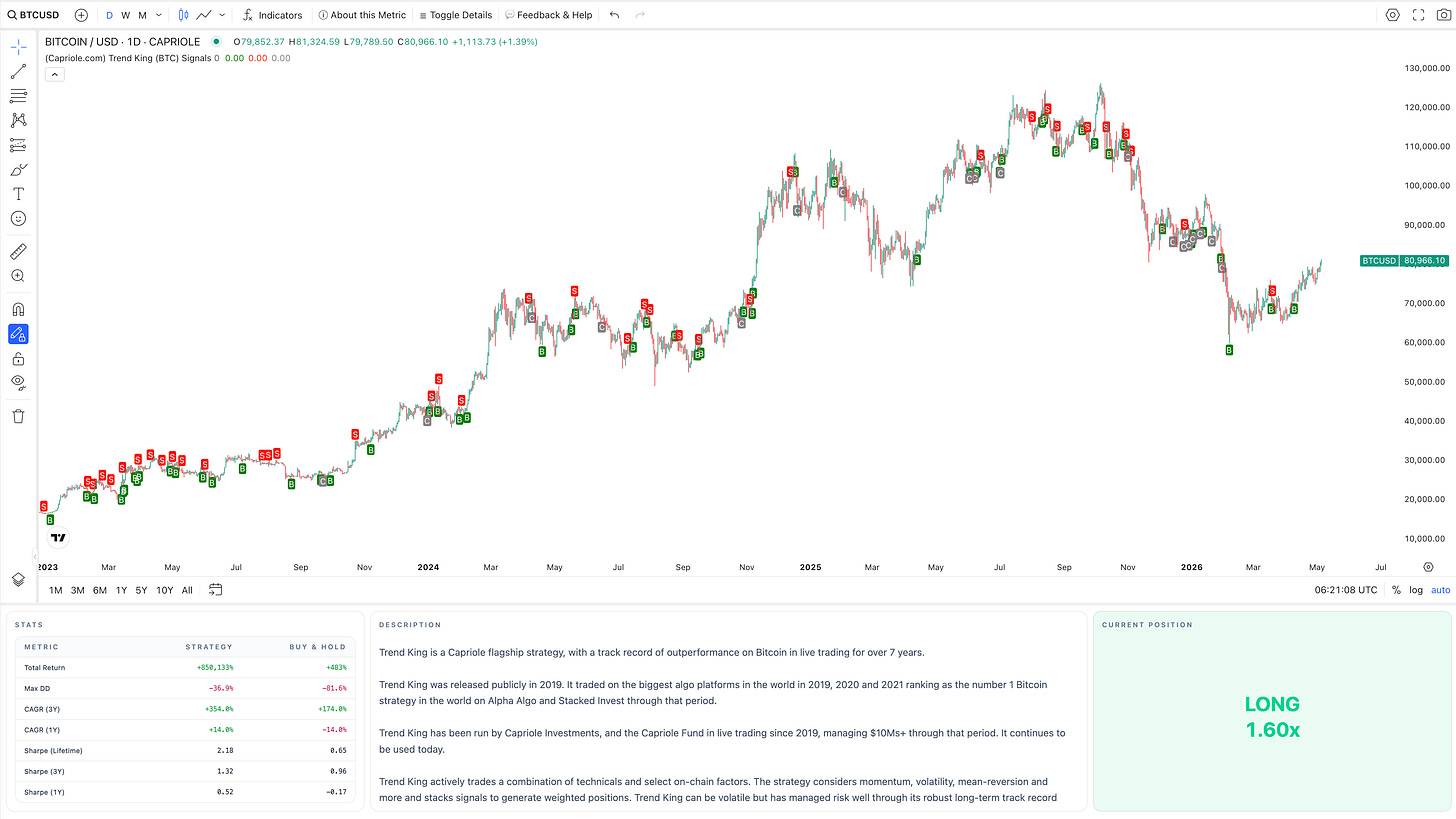
Trend King: Leveraged Long Bitcoin
Trend King is our longest-running live trading strategy—publicly launched in 2019 and actively managing capital ever since. It was ranked the world’s #1 Bitcoin strategy in 2019, 2020, and 2021. This marks its first public reappearance since 2021. Trend King is primarily a technical strategy, though it also incorporates select on-chain factors. Trend King is currently leveraged long Bitcoin.
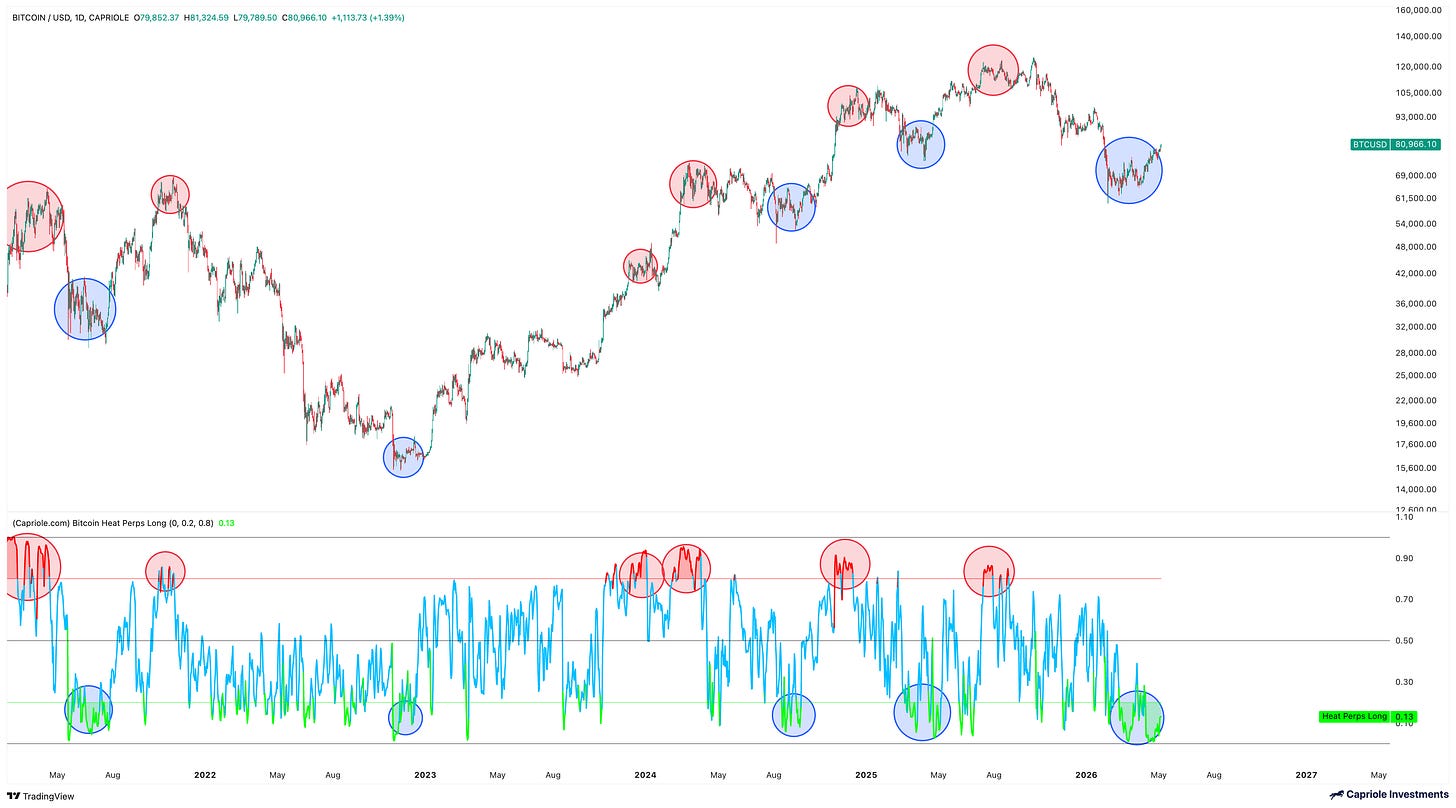
Bitcoin Perps Heat tracks the long-term relative extremity of Bitcoin’s second-largest derivatives market—the Bitcoin perpetual futures market—by observing funding rates and open interest, normalized over a four-year period. When readings are relatively high, many participants are long Bitcoin; when low, many are short. Crucially, one must identify extended periods at long-term highs or lows. We have just received an extremely bullish long-term signal following excessive shorting.
Last issue, we noted that SOPR persistently below 1 represented “past great Bitcoin opportunities.” This issue brings bullish confirmation: SOPR has decisively reclaimed levels above 1—a strong positive signal for both price action and on-chain momentum.
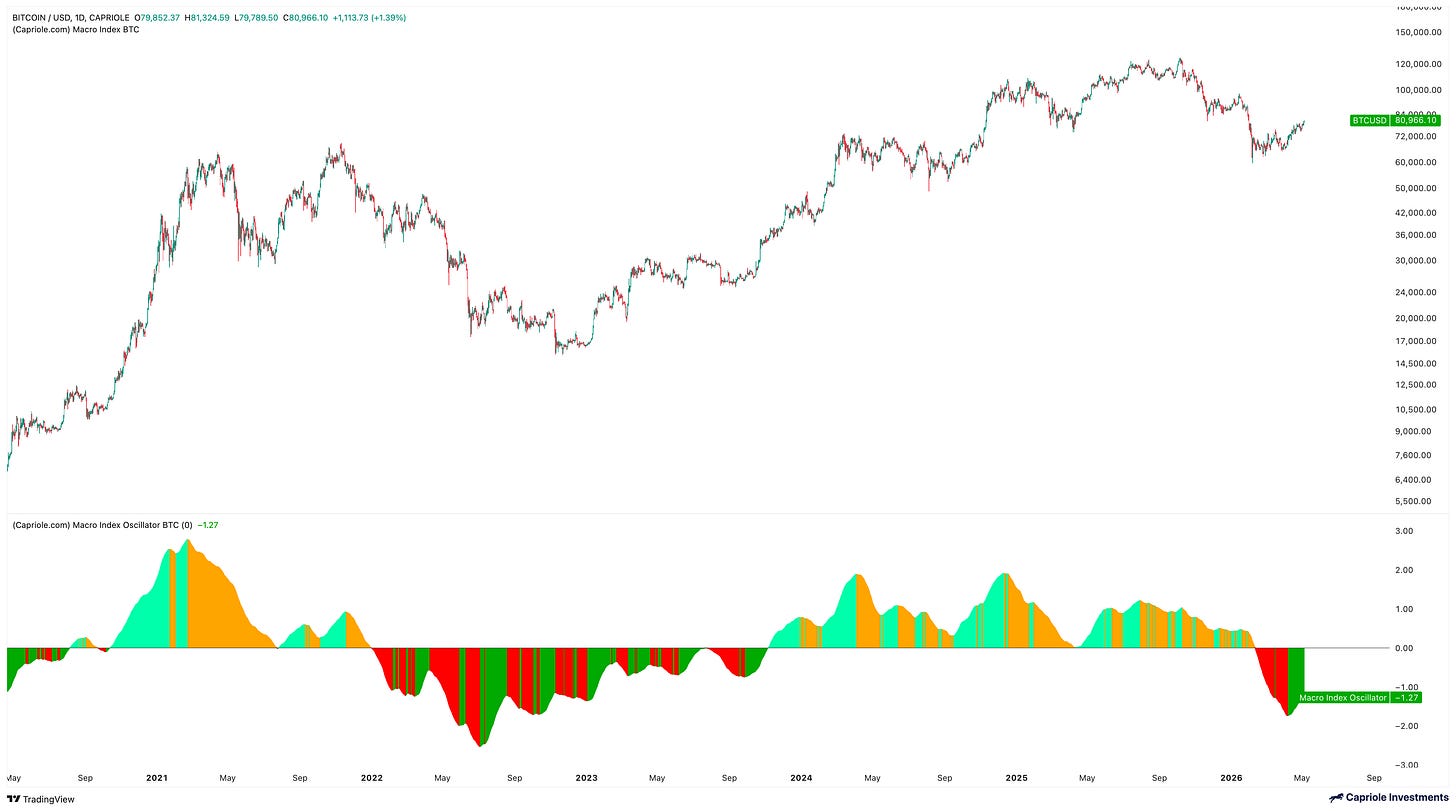
The Macro Index is our fundamentals-only Bitcoin model, tracking over 200 on-chain and macro market data points to deliver our preferred aggregated view of Bitcoin’s fundamental health. The Macro Index turned bullish around $71,000 several weeks ago—and is now in “recovery” mode. Its trends tend to exhibit stickiness.
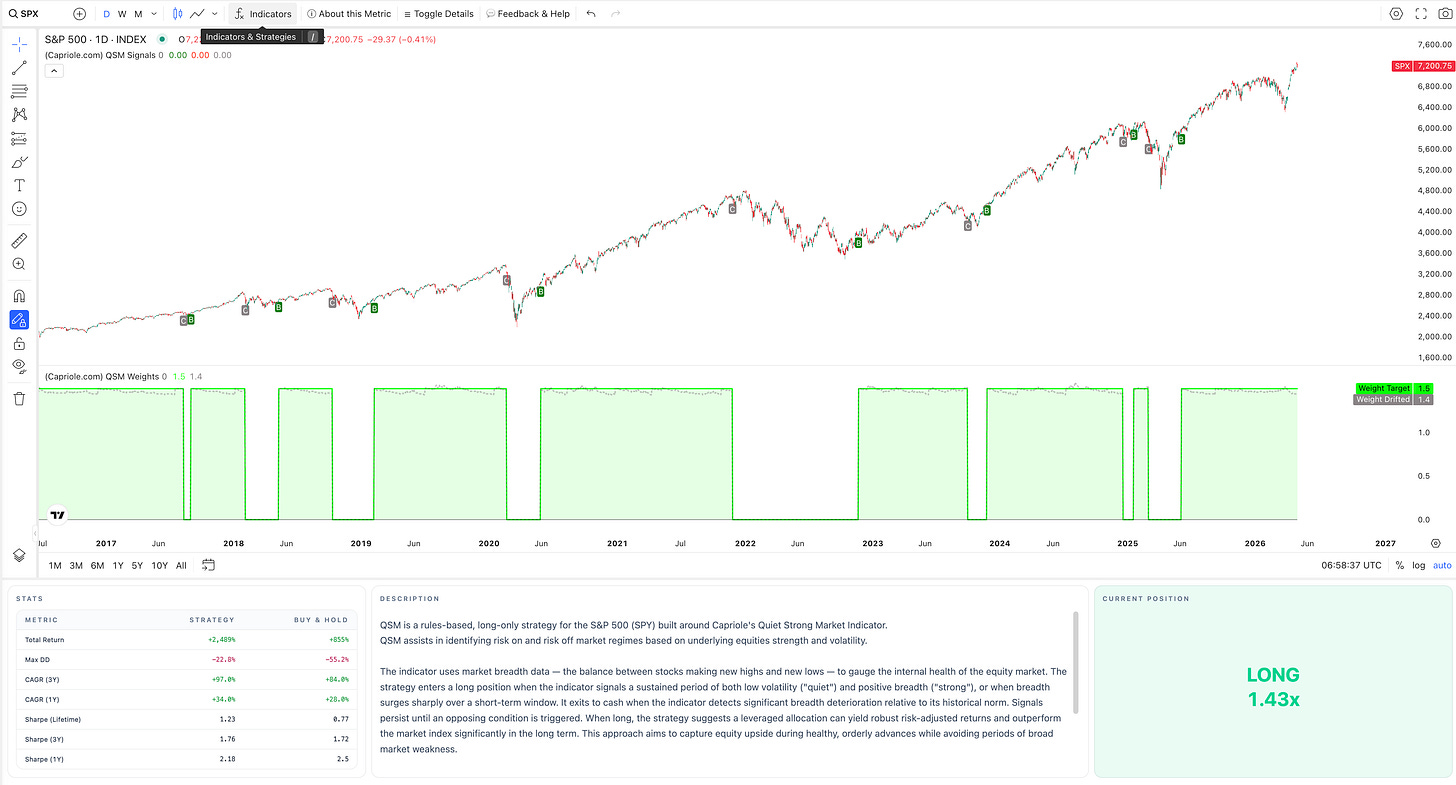
A classic, relatively robust market strategy is risk-on and long exposure.
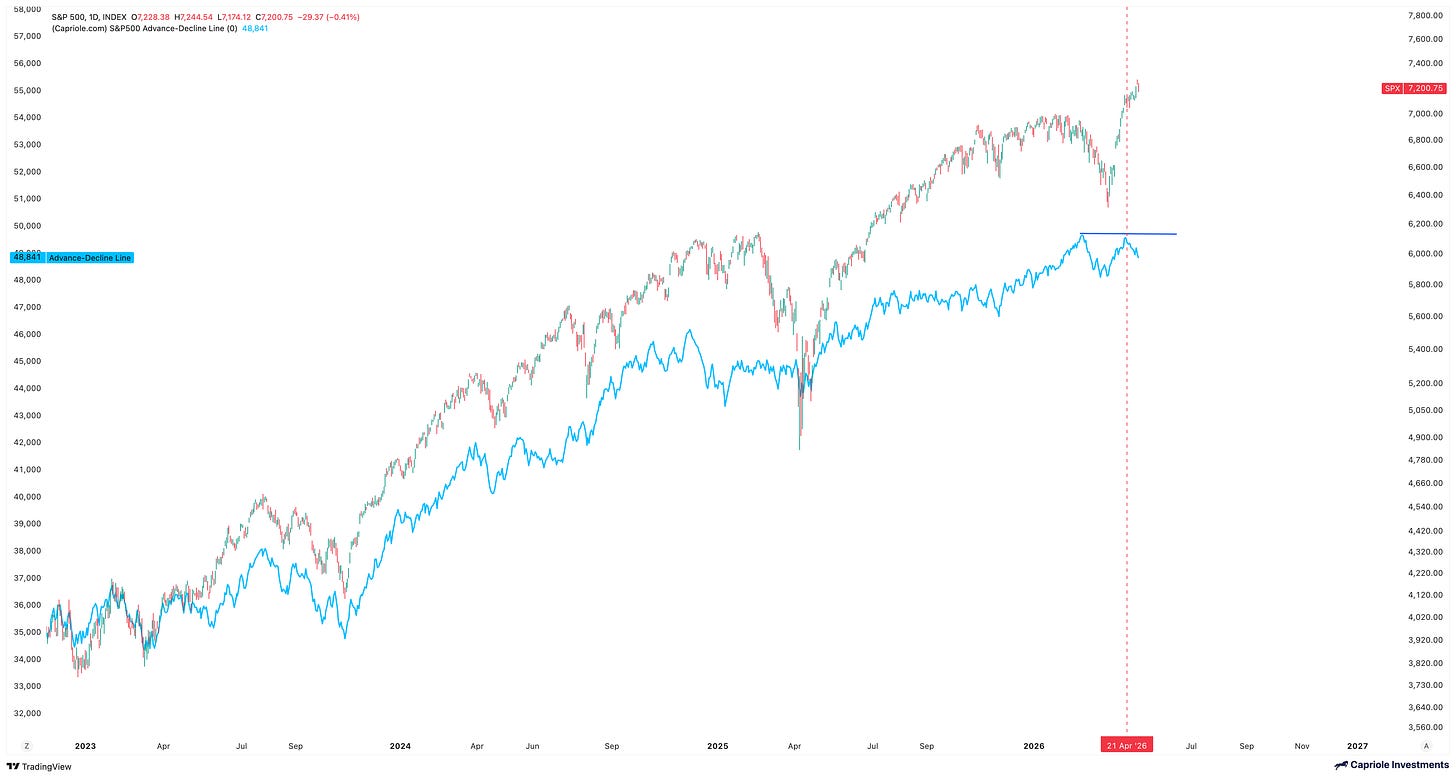
The advance-decline line shows weakness at recent highs.
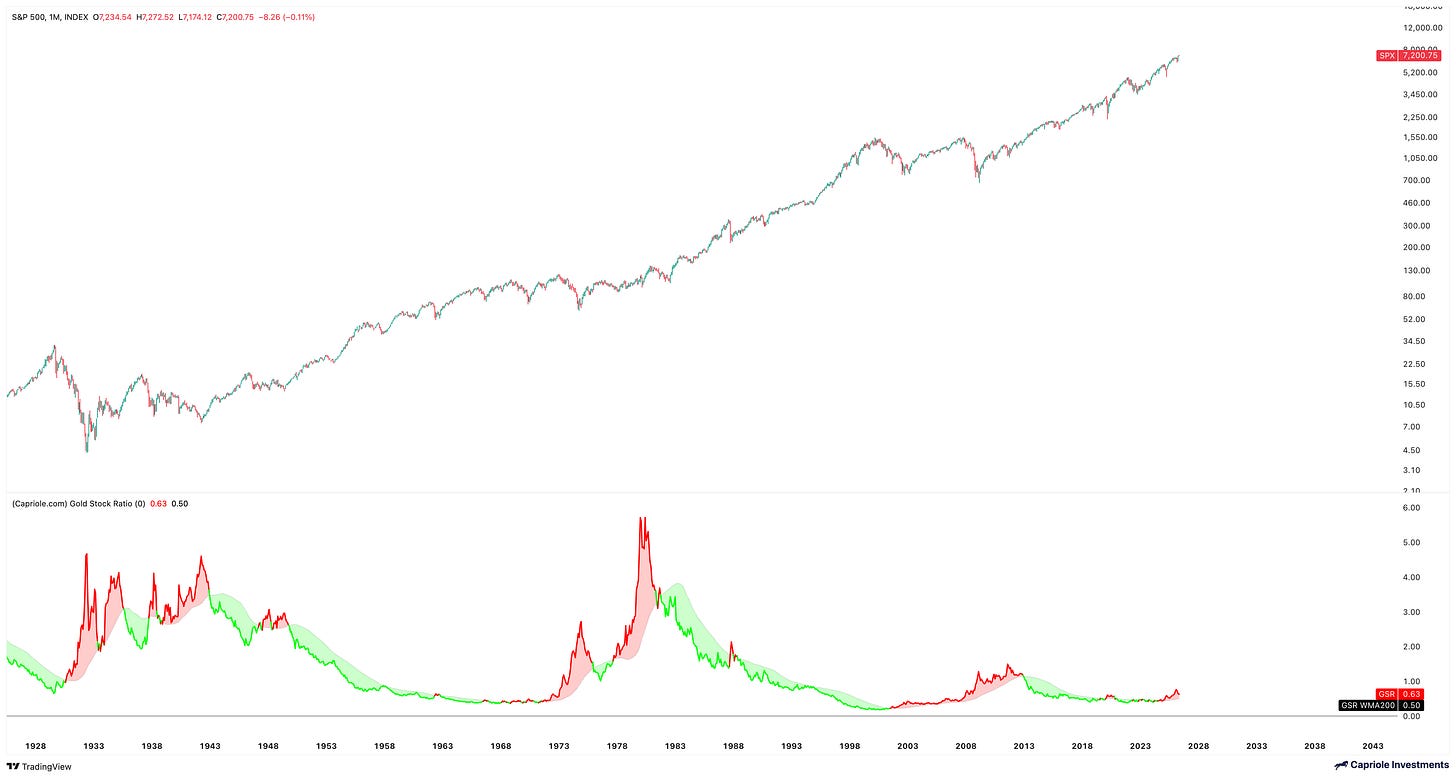
The gold-equity ratio is bearish for equities, signaling some longer-term risk.
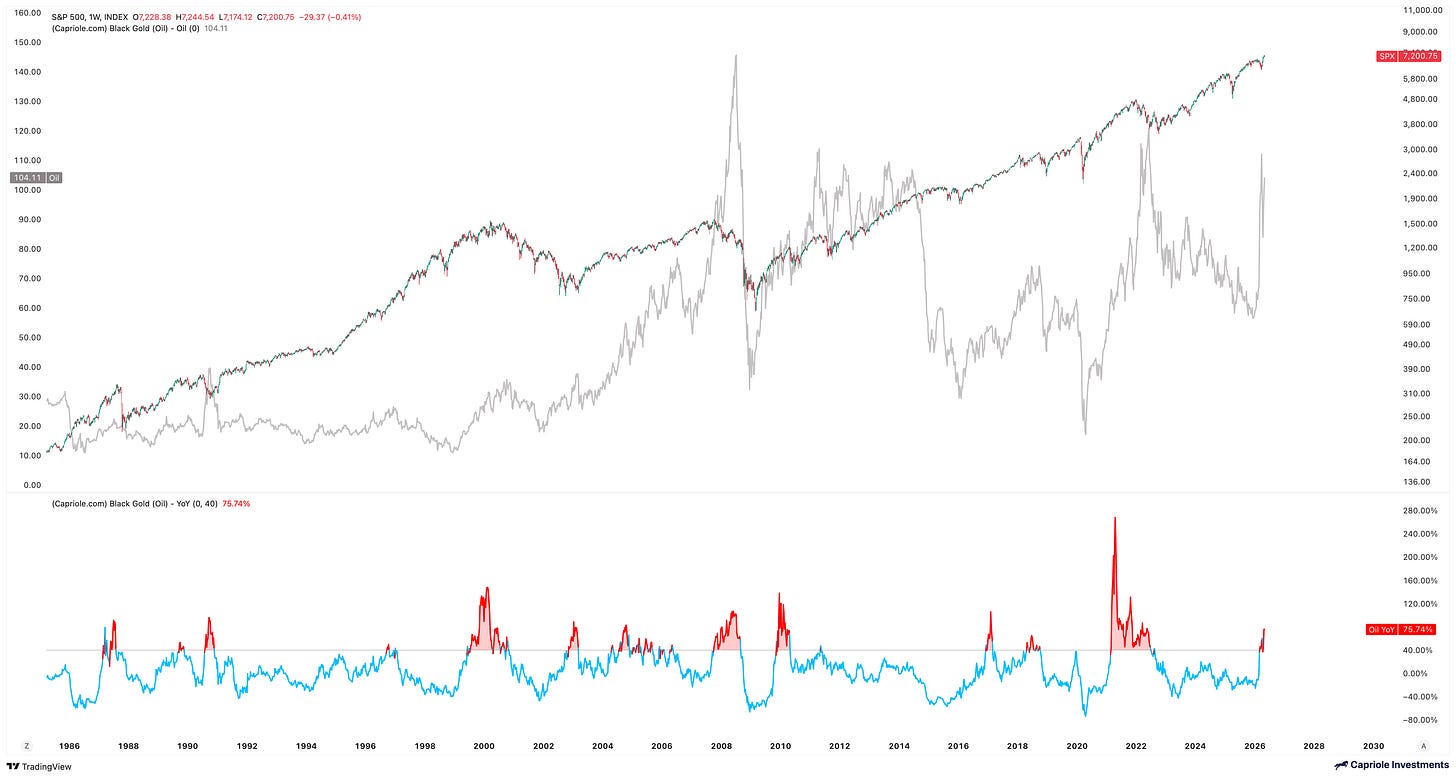
Last week, MAG7 AI earnings exceeded expectations. AI remains the growth narrative—and tech stocks (for now) remain unfazed by high oil prices.
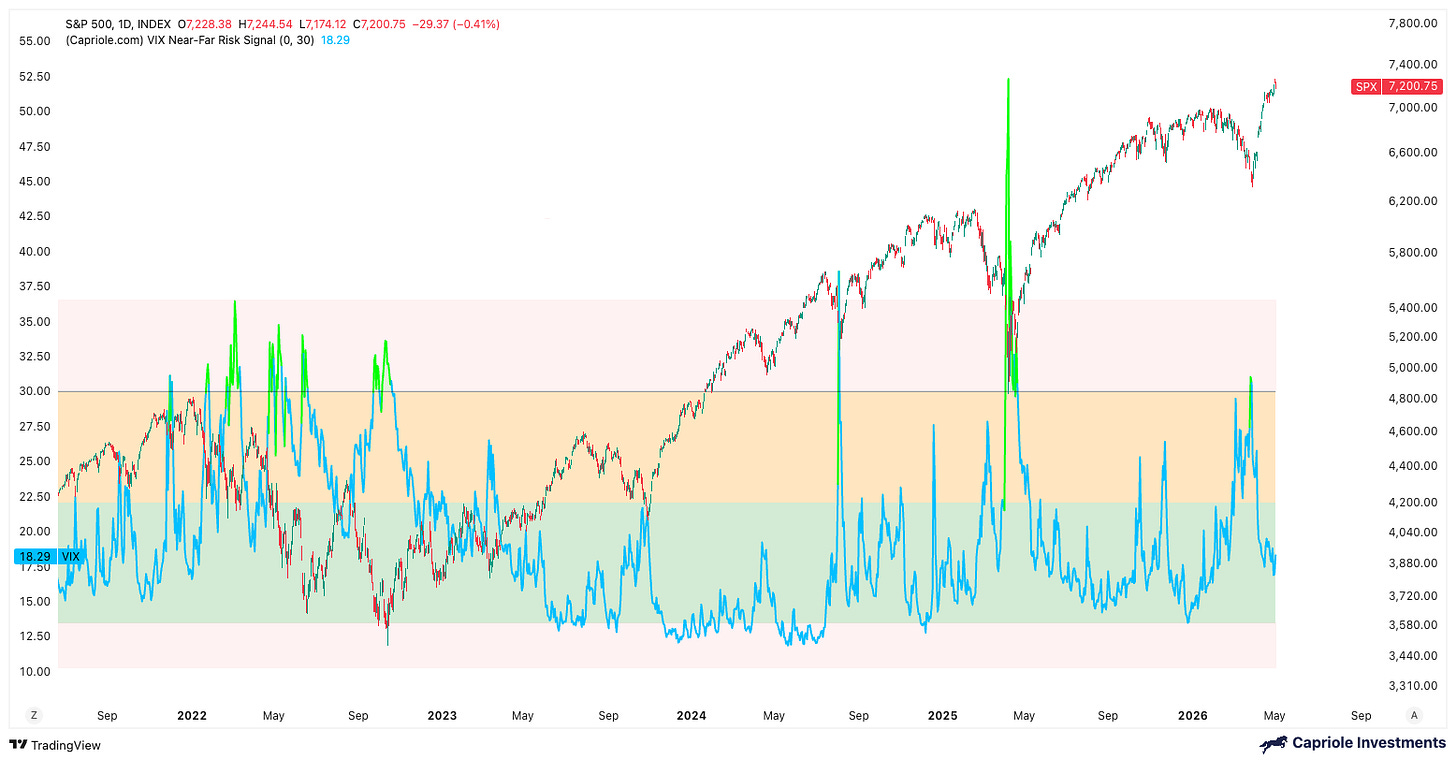
Credit spreads and volatility have collapsed—supporting a rebound in risk appetite.
Market sentiment and positioning have turned neutral; now it’s time to see whether the breakout trend can hold.
The Quiet Strong Market strategy balances volatility and market breadth to identify robust trends and navigate risk environments. It’s a slow-moving strategy—not designed to guard against lower volatility—but highly effective at navigating major trends. Today, it remains positioned for equity risk-on.
The advance-decline line collapsed during the recent breakout and failed to sustain higher levels. This could reflect short-term noise—but if the advance-decline line continues stagnating here, it signals broader issues for the S&P 500, perhaps indicating that high oil prices are beginning to squeeze marginal assets. This is absolutely a risk factor requiring attention. Ideally, we’d like to see the advance-decline line break out and rise over the coming weeks.
With the Iran war ongoing, elevated oil prices remain a key risk to monitor. Sometimes it’s a false signal—but more often, it effectively captures major risk-aversion events. The critical factor with high oil prices is duration: the longer prices stay elevated, the greater the accumulated risk. A return to highs this month is suboptimal—but one or two months of high oil prices (as we’ve experienced) isn’t yet dangerous. The real risk accrues only if oil stays elevated for years.
A century-old warning sign for equities is a breakout in the gold-equity ratio—its hit rate is exceptionally high. Yet gold has struggled over the past few months. Still, as long as this relative strength in gold persists (as it does today), we must remain vigilant about equity risk.
The VIX sits today at an ideal level—and is further supported by the collapse in credit spreads. Broadly speaking, VIX can be divided into the following zones: VIX above 30 signals fear and panic; a move back below 30 from such levels is bullish. We observed exactly that one month ago.
The orange zone—especially during VIX expansion—is a warning sign for future price volatility. Relatively low VIX readings (like today’s) represent strong risk-on territory—typically forming the backdrop of major equity bull markets. That said, when VIX falls too low, it may signal complacency—a fresh warning sign—but we’re far from that point today.
In short, both VIX and credit spreads support the current breakout trend.
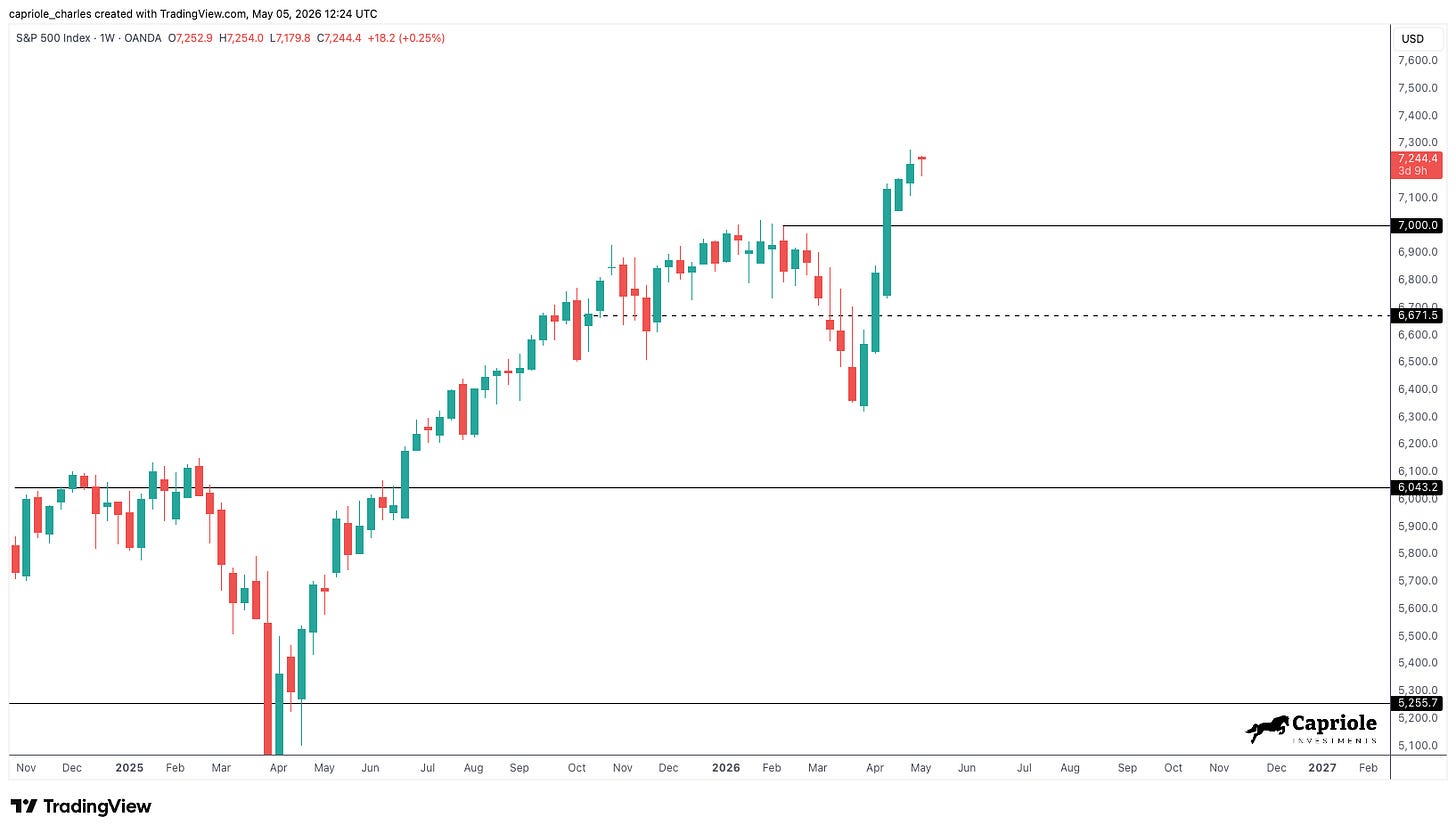
Technical analysis lends further support here—we’ve just seen a new all-time high breakout in the S&P 500. Context matters too: this new high emerged amid war, Strait of Hormuz tensions, blockades, soaring oil prices, and poor market sentiment. When price reacts strongly to bad news, it’s a powerful bullish signal (true for Bitcoin as well). Thus, the S&P 500 remains in risk-on mode—until the recent failure at the $7,000 weekly resistance level. A weekly close below $7,000 would significantly deteriorate the technical picture; until then, riding the trend makes sense.
Conclusion
Bitcoin looks exceptionally strong here—and is supported by relative strength versus all markets, having bottomed and outperformed the broad market since the onset of the Iran war. We see consistent bullishness across both Bitcoin’s technical and fundamental data today.
Equities are more nuanced: several warning signals are flashing—but these are largely longer-term warnings, requiring further near-term bearish confluence to gain true conviction. Moreover, we have a fresh, nearby technical defense at $7,000—providing a clear exit point should that level fail.
Until then, the trend is your friend.
We may just have returned.
Charles Edwards
Join TechFlow official community to stay tuned
Telegram:https://t.me/TechFlowDaily
X (Twitter):https://x.com/TechFlowPost
X (Twitter) EN:https://x.com/BlockFlow_News


