

Bitcoin’s “Bull-Bear Cycle Indicator” Turns Positive for the First Time in 7 Months—Is the Bear Market Over or Is This a False Breakout?
TechFlow Selected TechFlow Selected
Bitcoin’s “Bull-Bear Cycle Indicator” Turns Positive for the First Time in 7 Months—Is the Bear Market Over or Is This a False Breakout?
The most panicky phase may already be over, but it is still too early to declare the start of a new bull market.
Author: Claude, TechFlow
TechFlow Intro: CryptoQuant’s Bull-Bear Market Cycle Indicator has turned positive for the first time since October 2025. Meanwhile, another core metric—the Bull Score Index—rose into the neutral zone at 50 in late April. Bitcoin has posted three consecutive months of gains, rebounding over 35% from its February low near $60,000 to above $81,000. Yet the precedent of 2022 serves as a cautionary reminder: similar signals previously failed within a week, followed by further steep declines.
A long-awaited positive signal is emerging from Bitcoin on-chain data.
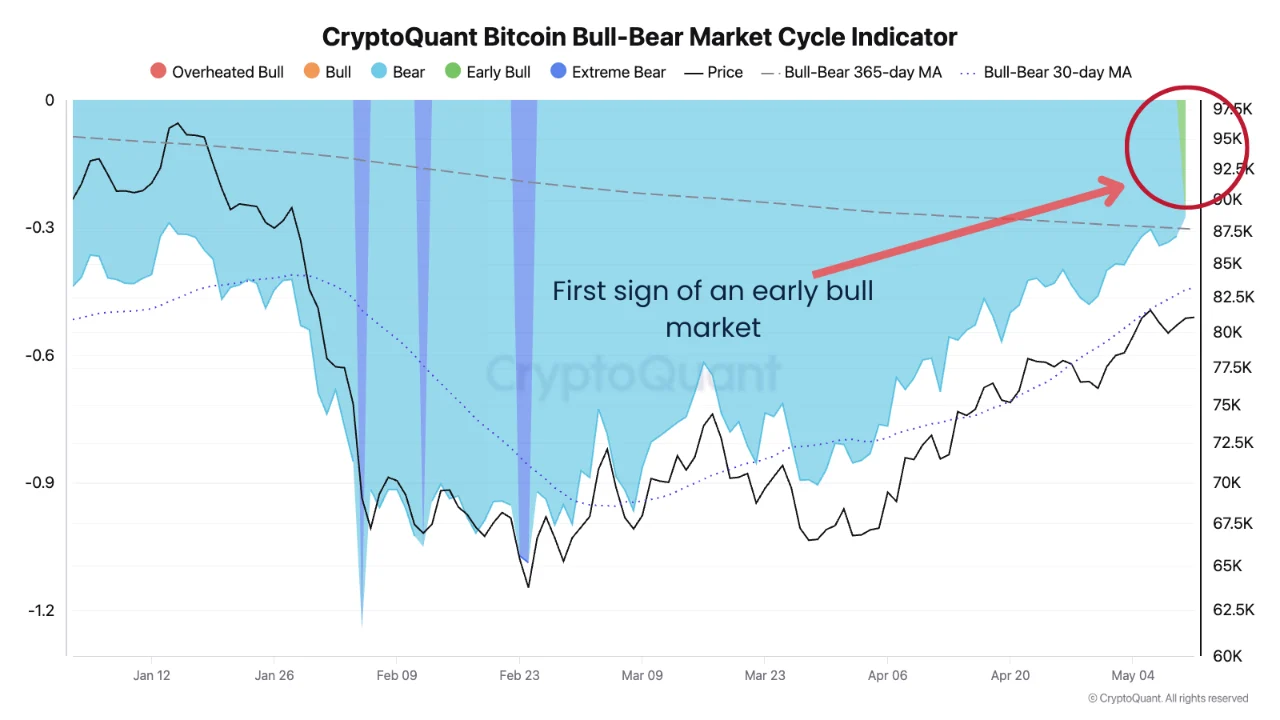
According to data from CryptoQuant, its Bull-Bear Market Cycle Indicator recently re-entered positive territory—the first time since the P&L Index fell below its 365-day moving average in October 2025.
This indicator gauges whether Bitcoin is currently in a bull or bear market cycle by measuring the distance between the P&L Index and its 365-day moving average. The P&L Index itself integrates three core on-chain metrics—MVRV ratio, NUPL, and SOPR for short- and long-term holders—and serves as CryptoQuant’s unified valuation tool for assessing whether Bitcoin’s price is over- or undervalued.
At press time, Bitcoin trades at approximately $81,000—up more than 35% from its cyclical low near $60,000 in early February.
Source: CryptoQuant, original analyst MorenoDV_
From Deep Bear to First Positive Reading: A Seven-Month On-Chain Recovery
Tracing this bear market’s on-chain trajectory: after Bitcoin plunged from its all-time high of $126,000 in October 2025, the Bull-Bear Cycle Indicator rapidly entered negative territory. As reported by Cryptonomist in February this year, the indicator hit roughly -1.2 in early February—comparable to the lows seen during the March 2020 pandemic crash. CryptBull similarly confirmed at the time that the reading had reached its lowest level since the FTX collapse bottom in 2022.
The recovery from the deep bear bottom in February to the recent return to positive territory took about three months. This pace is faster than the 2022 cycle—when the indicator remained negative for roughly 12 months—but given this cycle’s peak-to-trough decline of ~55% (from $126,000 down to under $60,000), questions remain over the sustainability of the rebound.
Bull Score Index Simultaneously Rises to Neutral: Multi-Indicator Confluence
The Bull-Bear Cycle Indicator’s turn to positive is not an isolated event.
As reported by CoinDesk on April 23, CryptoQuant’s other key metric—the Bull Score Index—also rose to a neutral reading of 50, marking the first time since Bitcoin began its descent from the $126,000 high.
The Bull Score Index aggregates ten on-chain metrics spanning blockchain activity, investor profitability, and liquidity.A reading below 40 typically signals a structural bear market, while above 60 indicates a robust, sustainable upward trend.
Julio Moreno, CryptoQuant’s Head of Research, commented that this marks the first time the Bull Score Index has entered the neutral zone during this bear market. He also noted the precedent from March 2022: the index briefly rose to 50 then, but held for only about one week before prices resumed a sharp decline.

Price-level improvement is equally evident: Bitcoin gained ~2% in March and ~12% in April; as of mid-May, it has risen ~6% month-to-date—marking three consecutive months of positive returns.
The 2022 “False Signal” Precedent: History May Not Repeat, But Markets Remember
The biggest market concern regarding these positive signals stems from the 2022 precedent.
In March 2022, the Bull Score Index briefly rose to the neutral 50 level—only for Bitcoin to fall from ~$47,000 to $16,000. Likewise, the Bull-Bear Cycle Indicator saw a brief positive turn in 2022, yet continued falling amid the Luna/UST and FTX collapses.
However, this cycle differs structurally from 2022. Since their January 2024 launch, spot Bitcoin ETFs have become a critical anchor for institutional demand. According to SpotedCrypto, net inflows into spot Bitcoin ETFs reached $2.44 billion in April—the strongest monthly figure since October 2025. Glassnode data shows that whale addresses holding more than 1,000 BTC increased by 142 over the past six months. Additionally, Glassnode’s RHODL Ratio currently stands at 4.5—the third-highest reading in Bitcoin’s history. The two prior instances of comparable highs occurred at the cycle bottoms of 2015 and 2022—both followed by sustained bull markets.
Matthew Weller, Global Head of Research at StoneX, offered a more cautious reference framework in his Q2 outlook.
Based on Bitcoin’s four-year halving cycle, the durable bottom of this cycle may not arrive until around Q4 2026. If historical patterns hold, the peak-to-bottom decline could reach ~60%, implying a bottom near $50,000.
For traders, the true implication of current signals may be this:
The most panicked phase may already be behind us—but declaring a new bull market remains premature. Bitcoin must break above and sustainably hold above the 200-day moving average resistance near $82,000 to deliver a technically convincing trend reversal confirmation.
Join TechFlow official community to stay tuned
Telegram:https://t.me/TechFlowDaily
X (Twitter):https://x.com/TechFlowPost
X (Twitter) EN:https://x.com/BlockFlow_News


