159 Crypto Protocols Tested: Except for Hyperliquid, All Tokens with Buyback Mechanisms Are Losing Money
TechFlow Selected TechFlow Selected
159 Crypto Protocols Tested: Except for Hyperliquid, All Tokens with Buyback Mechanisms Are Losing Money
Did buybacks and burns win? Remove Hyperliquid, and it immediately ranks last.
Author: Connor King
Translation & Compilation: TechFlow
TechFlow Intro: This article tests six token value accrual mechanisms across 159 protocols and finds that revenue scale matters more than mechanism design—protocols generating over $500,000 in daily revenue delivered an average return of +8%, while the lowest tier posted -81%. Crucially, many mechanisms that appear “winning” reverse entirely when just one or two top-performing projects are removed—a finding with direct implications for token selection by investors.
We mapped the six value accrual mechanisms across 159 tokens and tested which ones actually translated into returns for token holders.
The crypto industry’s narratives around token value accrual are largely incorrect.
Research Setup
Two weeks ago, we released our report, Investor Relations & Token Transparency 2026. One key finding: 38% of crypto protocols implement active value accrual, while 62% return no value to token holders.
This article is a companion analysis. We obtained a dataset of 159 protocols, classified each token by its accrual mechanism, and pulled one-year price performance data from Artemis. The question: Which mechanisms actually translate into returns?
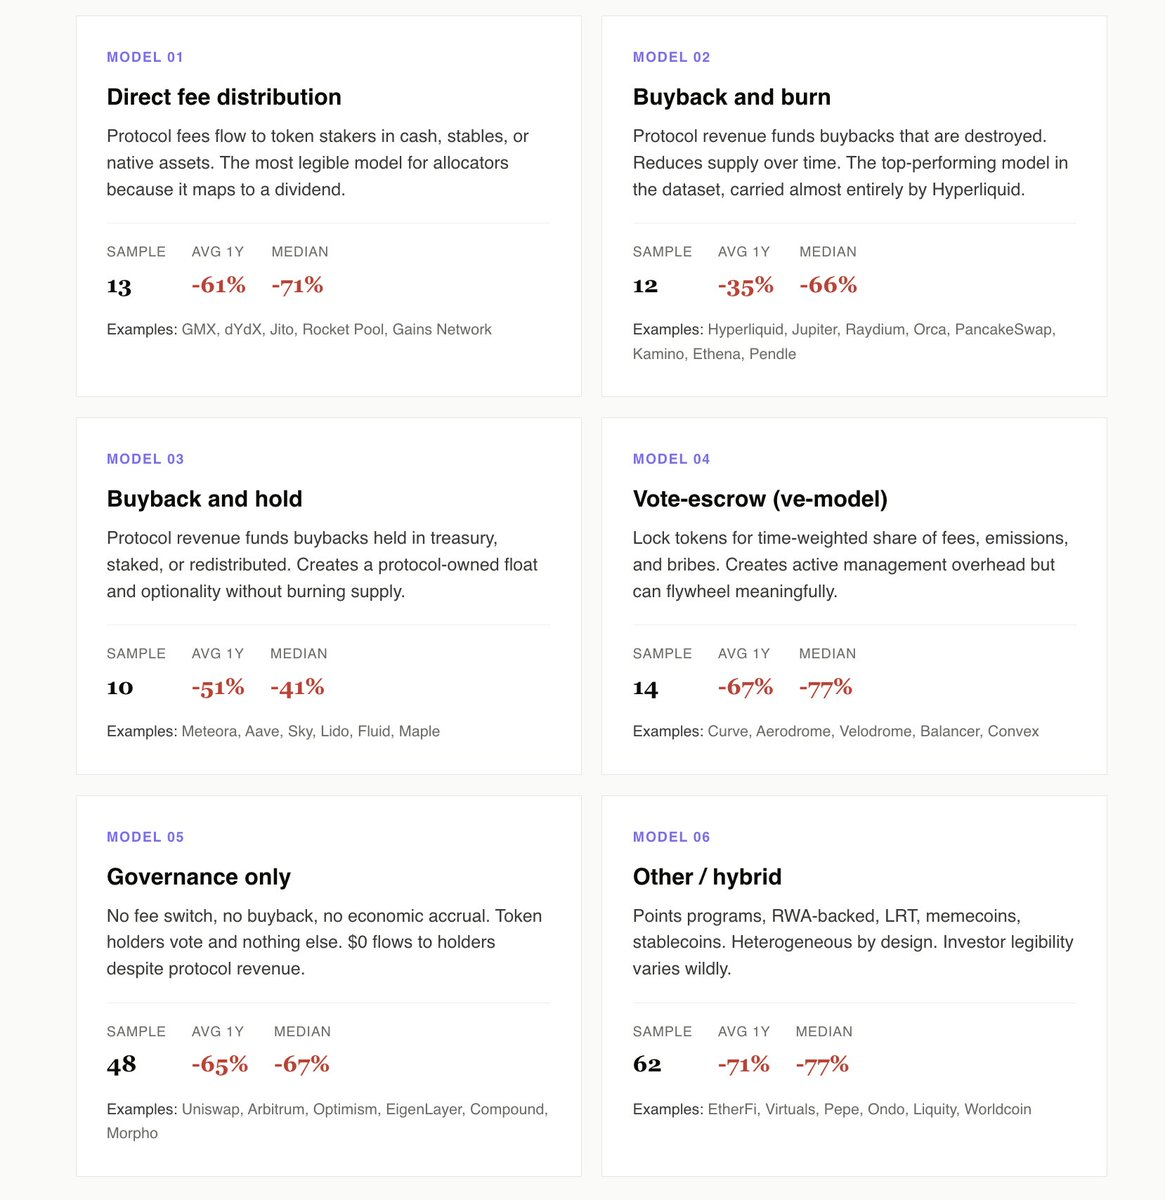
We identified six models: direct fee distribution, buyback-and-burn, buyback-and-hold, vote-escrow (ve model), pure governance, and other/mixed models.
Here are our findings:
Active Accrual Outperforms Pure Governance by 10 Percentage Points
The 49 protocols using direct fee distribution, buyback-and-burn, buyback-and-hold, or the ve model delivered an average return of -55% over the past year. The 48 pure governance protocols averaged -65%.
The gap widens further when focusing on revenue-generating pure governance tokens like Uniswap, Arbitrum, and Morpho. These protocols generate real revenue yet distribute zero proceeds to token holders. Opportunity cost is the most conspicuous element in our dataset.
Pure governance is equivalent to a public company’s investor relations strategy that includes neither dividends nor share buybacks. Ultimately, allocators stop pretending this reflects a going concern—and begin pricing it as an option on management’s eventual awakening.
Hyperliquid Represents the Buyback-and-Burn Category
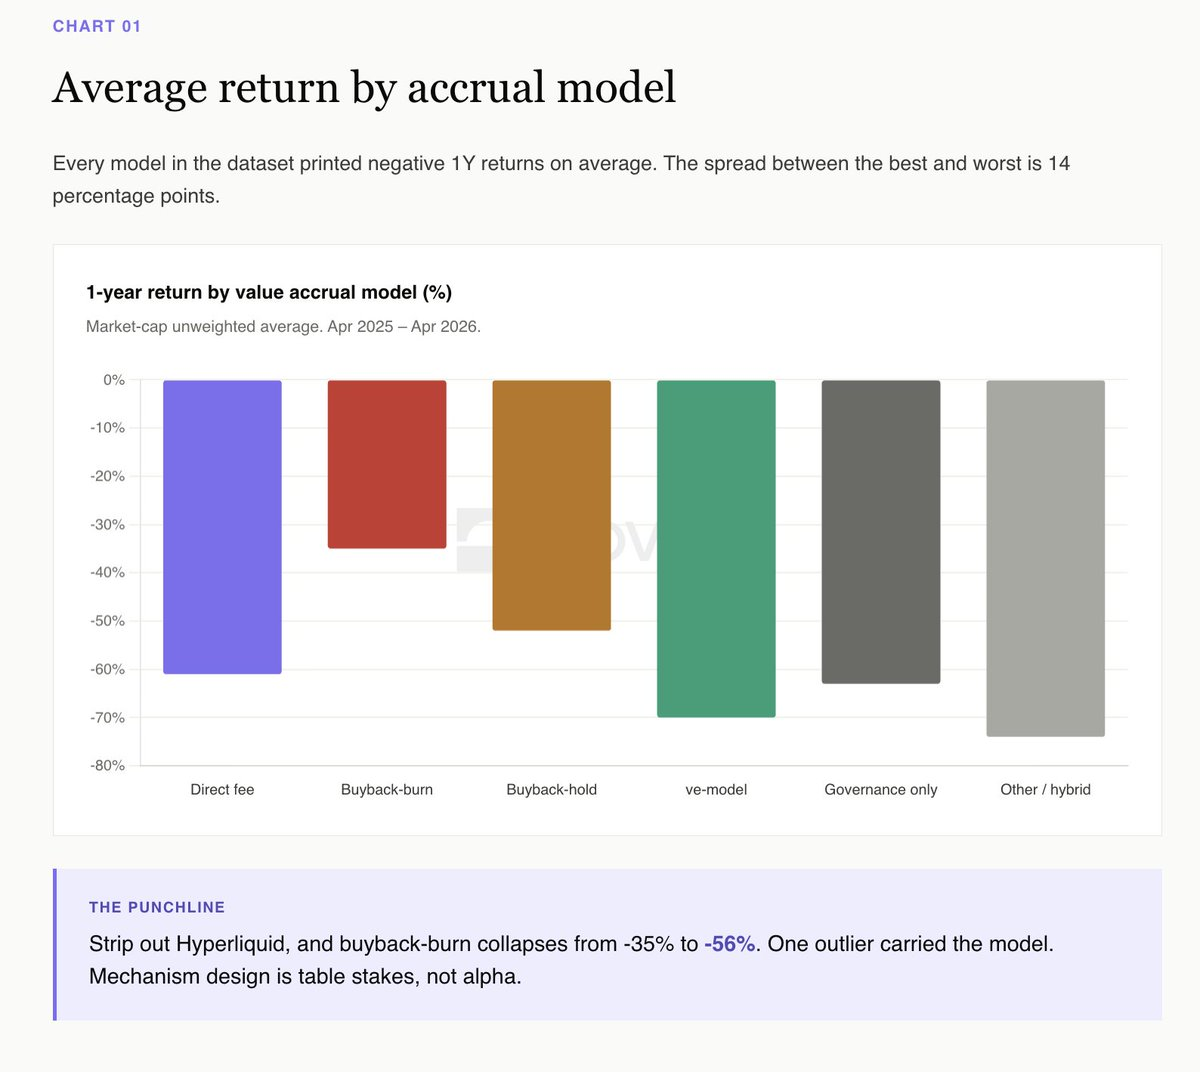
On surface-level data, buyback-and-burn “won” this year (average -35%), with buyback-and-hold second (-52%). This appears to be a decisive win for burning.
But the story reverses once Hyperliquid is excluded. Removing HYPE, buyback-and-burn drops to -56%, while buyback-and-hold stands at -52%. A single token defines the entire category.
Meteora is the cleanest buyback-and-hold case: a $10M buyback program, a Novora Investor Relations Score of 95/100, and transparent treasury accumulation. It fell ~40% this year—below the median for its cohort. Tokens holding repurchased supply in transparent treasuries retain optionality and create visible, auditable circulating supply. Burning destroys optionality—for a marketing headline.
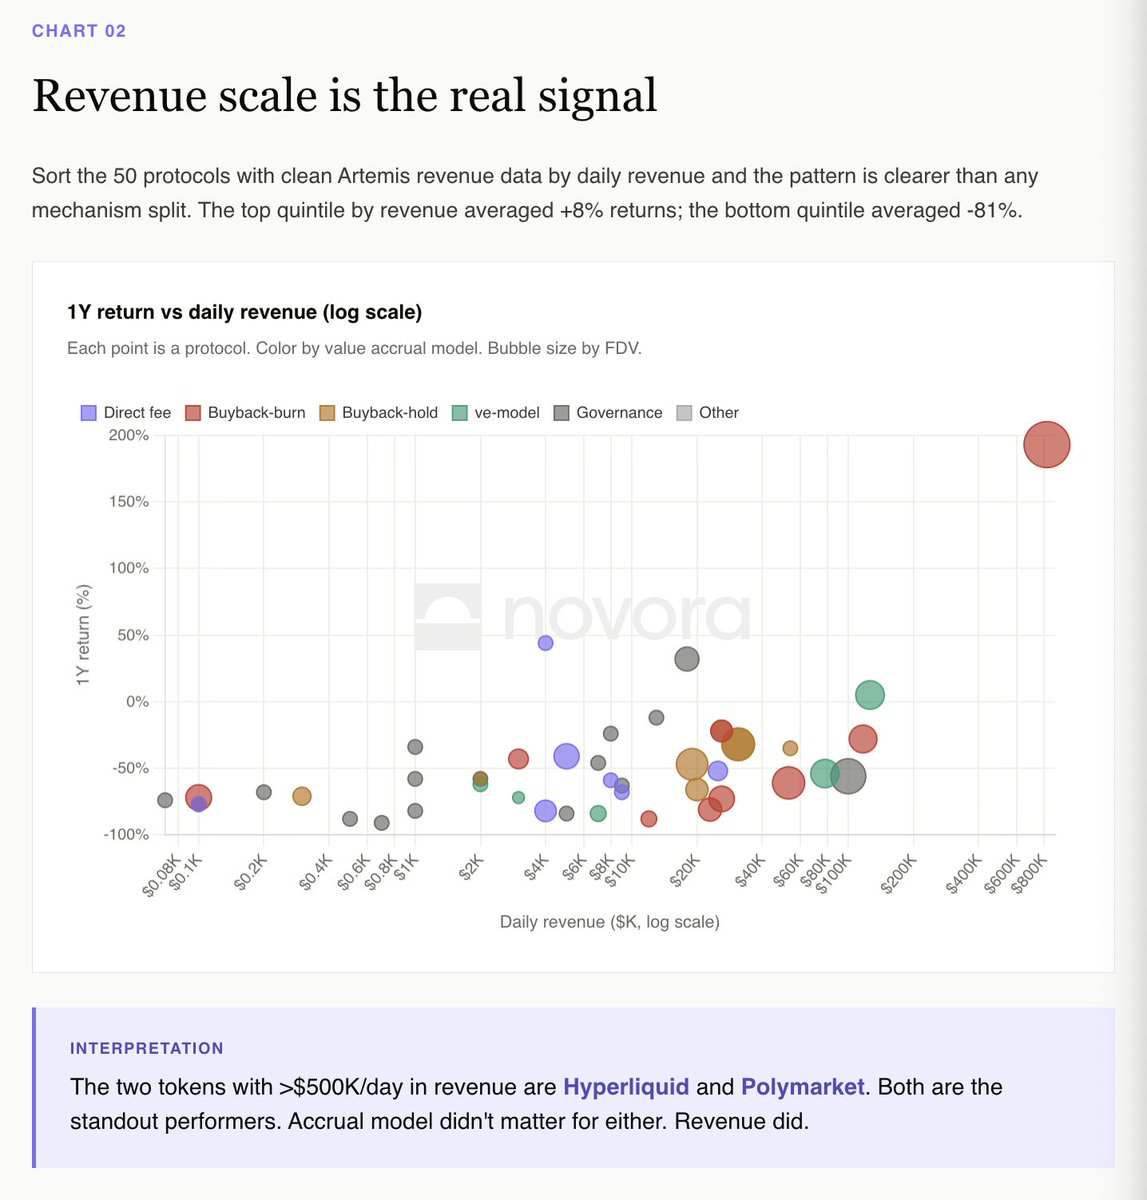
Revenue Scale Is the Real Signal
Ranking the 50 protocols with clear Artemis revenue data by daily revenue reveals a pattern far clearer than any mechanism-based classification.
The top quintile by revenue delivered an average return of +8%. The bottom quintile averaged -81%.
The two protocols with daily revenue exceeding $500,000 are Hyperliquid and Polymarket—both standout performers in our dataset. Their accrual models differ, but their revenue trajectories align.
The dYdX Paradox vs. the Hyperliquid Paradox
Direct fee distribution is the most legible model for institutional allocators, as it maps cleanly to dividends. dYdX runs the textbook version: 100% of trading fees to stakers, 75% of net revenue used for buybacks, and best-in-class investor relations infrastructure.
dYdX fell 82% over the past 12 months. Its mechanism operated exactly as promised—but its business did not.
Hyperliquid is the inverse: buyback-and-burn funded via an aid fund (99% of fees), zero traditional investor relations infrastructure—and an annual return of +193%.
If you’re an allocator, this is the clearest interpretation in the dataset: You’re buying a claim on protocol revenue. If revenue declines, the token falls. Mechanism is table stakes—the revenue trajectory is everything.
The ve Model Requires Permanent Bribery to Function
Aerodrome is the only ve-model token in our dataset with a positive one-year return (+5%). Its mechanism depends on sustained inflows into the Base ecosystem to maintain its bribery market.
Velodrome, Curve, Balancer, and every smaller ve fork fell between -54% and -84%. The ve flywheel works—but it requires continuous new capital. When capital inflows stall, the entire structure collapses.
This isn’t criticism of the model. It’s recognition that ve tokens are leveraged bets on ecosystem inflows—not necessarily on pure protocol fundamentals.
Mixed Category Averages -71%
Loyalty programs, RWAs, LRTs, memecoins, stablecoins. 62 protocols. The most heterogeneous category in the dataset. Average one-year return: -71%.
This is where most projects launched in 2024–2025 land: EtherFi, Renzo, Puffer, Usual, Virtuals, AI16Z, the entire LRT cohort, the memecoin cohort. These tokens trade on narrative and TGE airdrops—not cash flow mechanisms. Once airdrop unlocks complete, nothing remains to support the price.
Investor legibility is the fundamental problem. Allocators cannot underwrite a token whose accrual mechanism depends on future narratives.
Big Picture
Average one-year returns by accrual model:
Buyback-and-burn: -35% (lifted by Hyperliquid; -56% excluding HYPE)
Buyback-and-hold: -52%
Direct fee distribution: -55%
Pure governance: -65%
Vote-escrow (ve model): -67%
Other/mixed: -71%
Among the 135 protocols with empirical performance data, only five delivered positive returns over the past year. Median return: -66%.
What This Means
The market does not pay a premium for well-designed mechanisms—but it penalizes tokens with no mechanism at all.
The clearest empirical takeaway for 2025 is: Value accrual has not generated excess returns, but revenue has. Yet the dataset’s 48 pure governance protocols illustrate the cost of having no mechanism. When the market chooses between paying for your token and paying for nothing, it chooses the former.
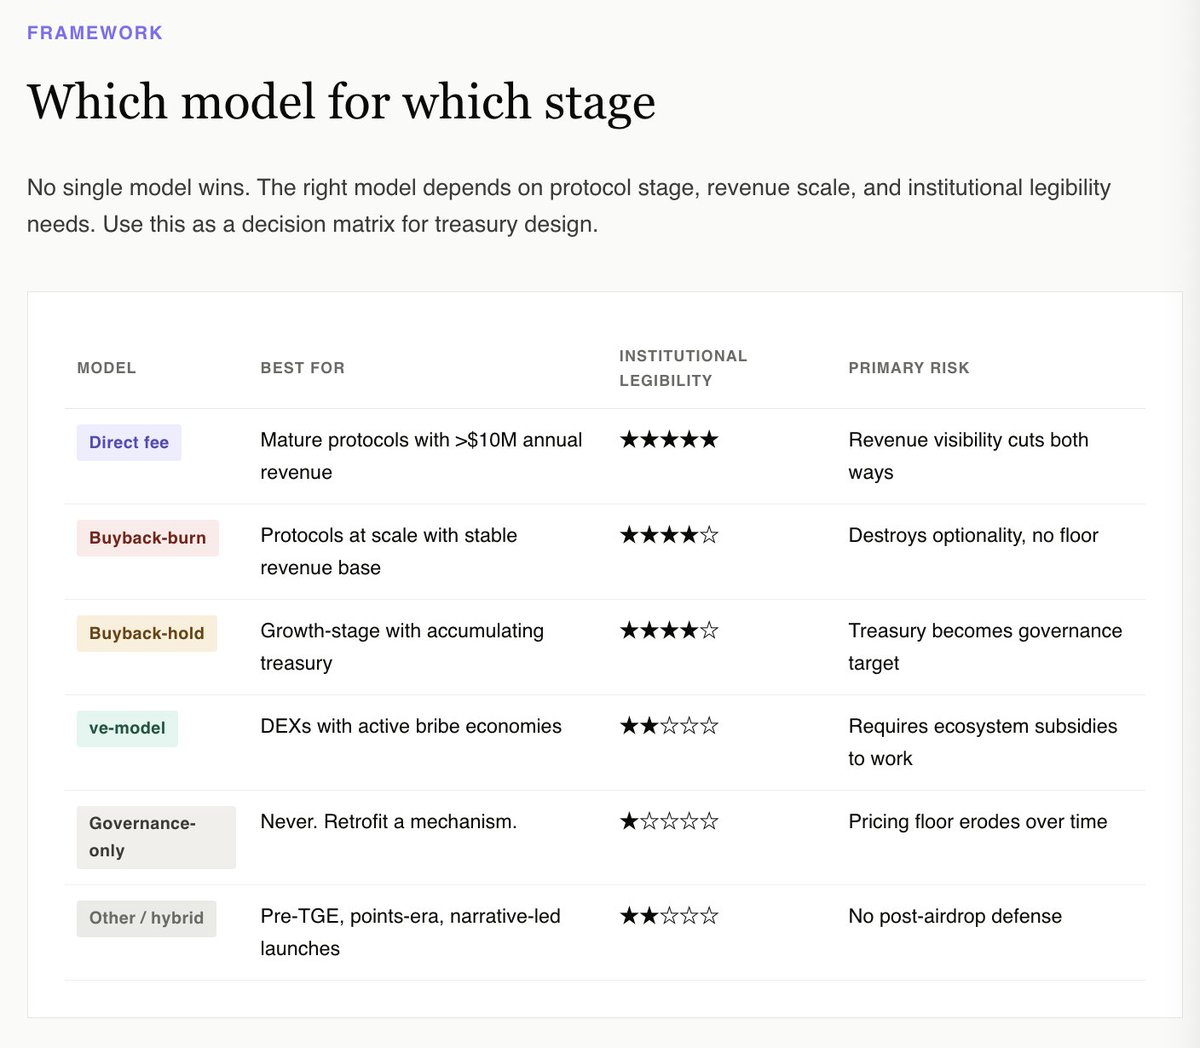
For treasuries, the right question is not which mechanism maximizes upside potential. Data shows none reliably do. The right question is: Which mechanism makes this token look investable from an institutional allocator’s fundamental perspective?
This perspective immediately excludes pure governance and mixed categories. It favors buyback-and-hold with transparent treasury disclosure, buyback-and-burn at scaled protocols (e.g., Hyperliquid), direct fee distribution at mature revenue-generating protocols, and—for narrow-scope DEX-native tokens—the ve model tied to an active, liquid bribery market.
For all other tokens—including most launched in the past 24 months—the honest answer is: Retrofit a mechanism before the next unlock. Do it while you still have optionality.
The full interactive report—including all 159 protocols and a filterable dataset—is now live:
https://www.novora.co/research/value-accrual-2026.html
This article is for informational purposes only and does not constitute financial, investment, or legal advice. All data has been verified against publicly available sources as of April 2026. Novora may have consulting relationships with protocols mentioned in this report. Always conduct your own research and consult a qualified financial advisor before making investment decisions.
Join TechFlow official community to stay tuned
Telegram:https://t.me/TechFlowDaily
X (Twitter):https://x.com/TechFlowPost
X (Twitter) EN:https://x.com/BlockFlow_News