
a16z Chart of the Week: Market Capitalizations of 10 Tech Companies Exceed the GDP of Six G7 Countries
TechFlow Selected TechFlow Selected
a16z Chart of the Week: Market Capitalizations of 10 Tech Companies Exceed the GDP of Six G7 Countries
AI may reshape organizational structures once again, much like railways did when they gave rise to modern corporate systems.
Author: a16z New Media
Translation & Editing: TechFlow
TechFlow Intro: In its latest Chart Week report, a16z dissects a core thesis with extensive data: the tech industry’s dominance over the global economy is accelerating. The combined market capitalization of the world’s top ten publicly traded companies now exceeds the total GDP of the G7 nations (excluding the U.S.). Meanwhile, AI may reshape organizational structures as profoundly as railroads once did in spawning modern corporate institutions. Additionally, stablecoins are shifting from mere transfer tools to real-world payment instruments—and trust in traditional media among U.S. young adults has plummeted to a historic low.
Software Is Eating the World
We admittedly have a bias—but the importance of technology to the global economy truly cannot be overstated.
You could even say software has literally eaten the world:
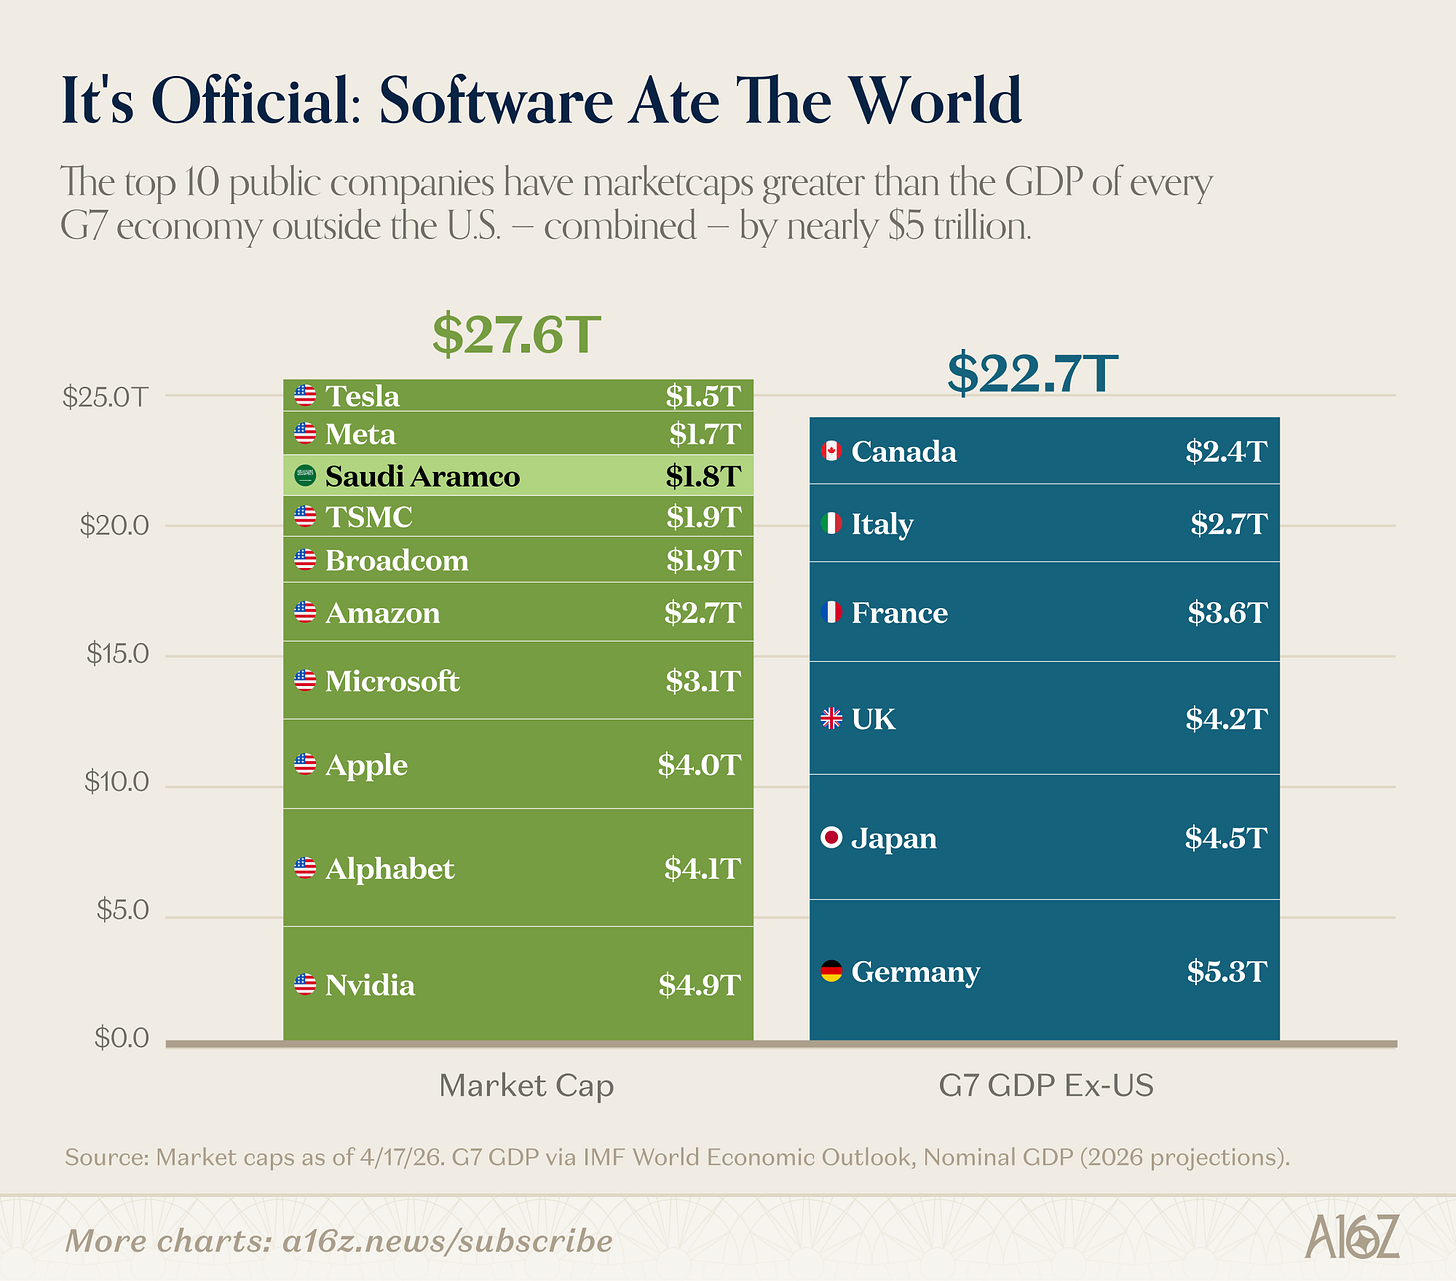
Caption: Market cap of the world’s top 10 public companies vs. GDP of the G7 (excluding the U.S.)
The combined market capitalization of the world’s top 10 publicly traded companies exceeds the total GDP of all G7 countries except the United States. This holds true even if you exclude Saudi Aramco—a company few would classify as “tech” (though it was indeed founded in San Francisco!).[1]
To be fair, the top 10 are better described as “tech + semiconductors (plus Tesla and Apple, which defy easy categorization),” rather than pure software firms. But the conclusion remains unchanged: technology isn’t just a big business—it is the biggest business.
And tech’s takeover of the global economy is happening at breakneck speed:
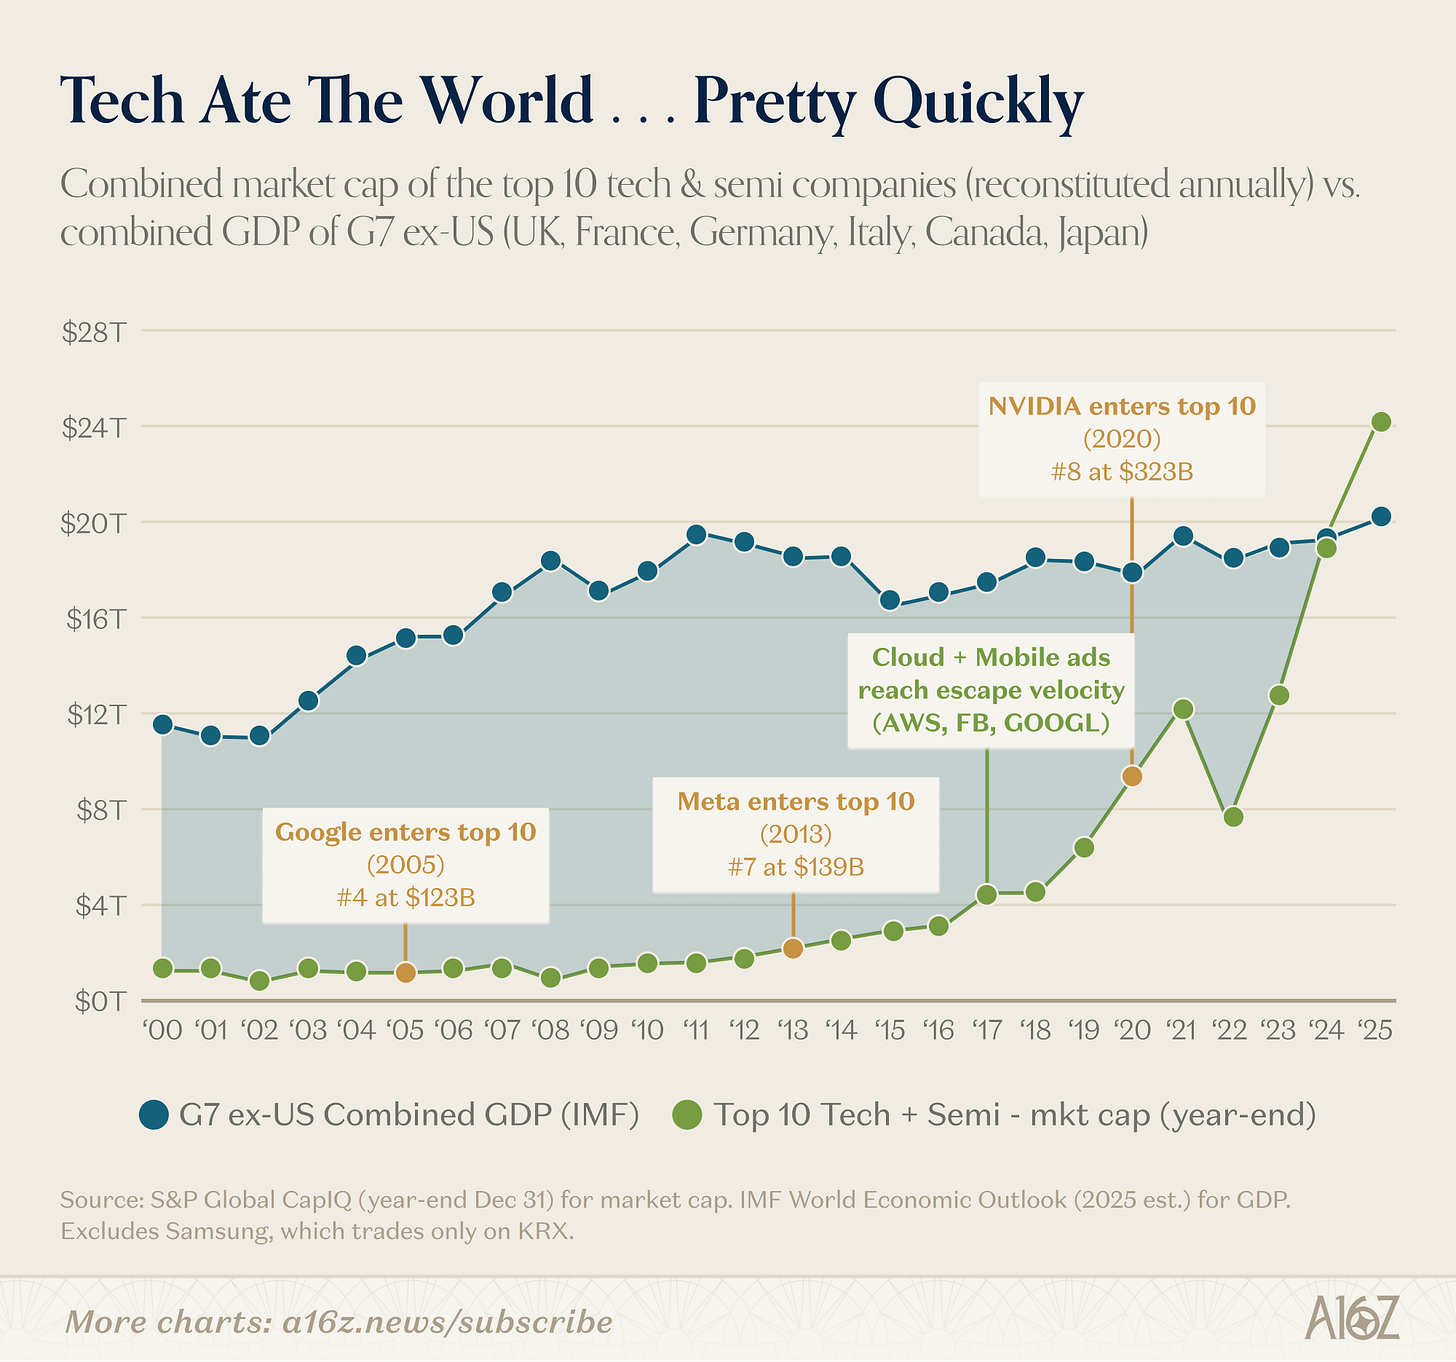
Caption: Market cap of the top 10 tech companies vs. GDP of the G7 (excluding the U.S.), time series
The combined market cap of the top 10 tech companies was once but a fraction of the G7’s (ex-U.S.) GDP—until cloud computing truly took off around 2016–2017. Since then, in less than a decade, their aggregate market cap has surpassed the GDP of the entire world (excluding China).
Tech’s rise isn’t merely about new winners replacing old ones.
The largest companies today are vastly bigger than they were a decade ago:
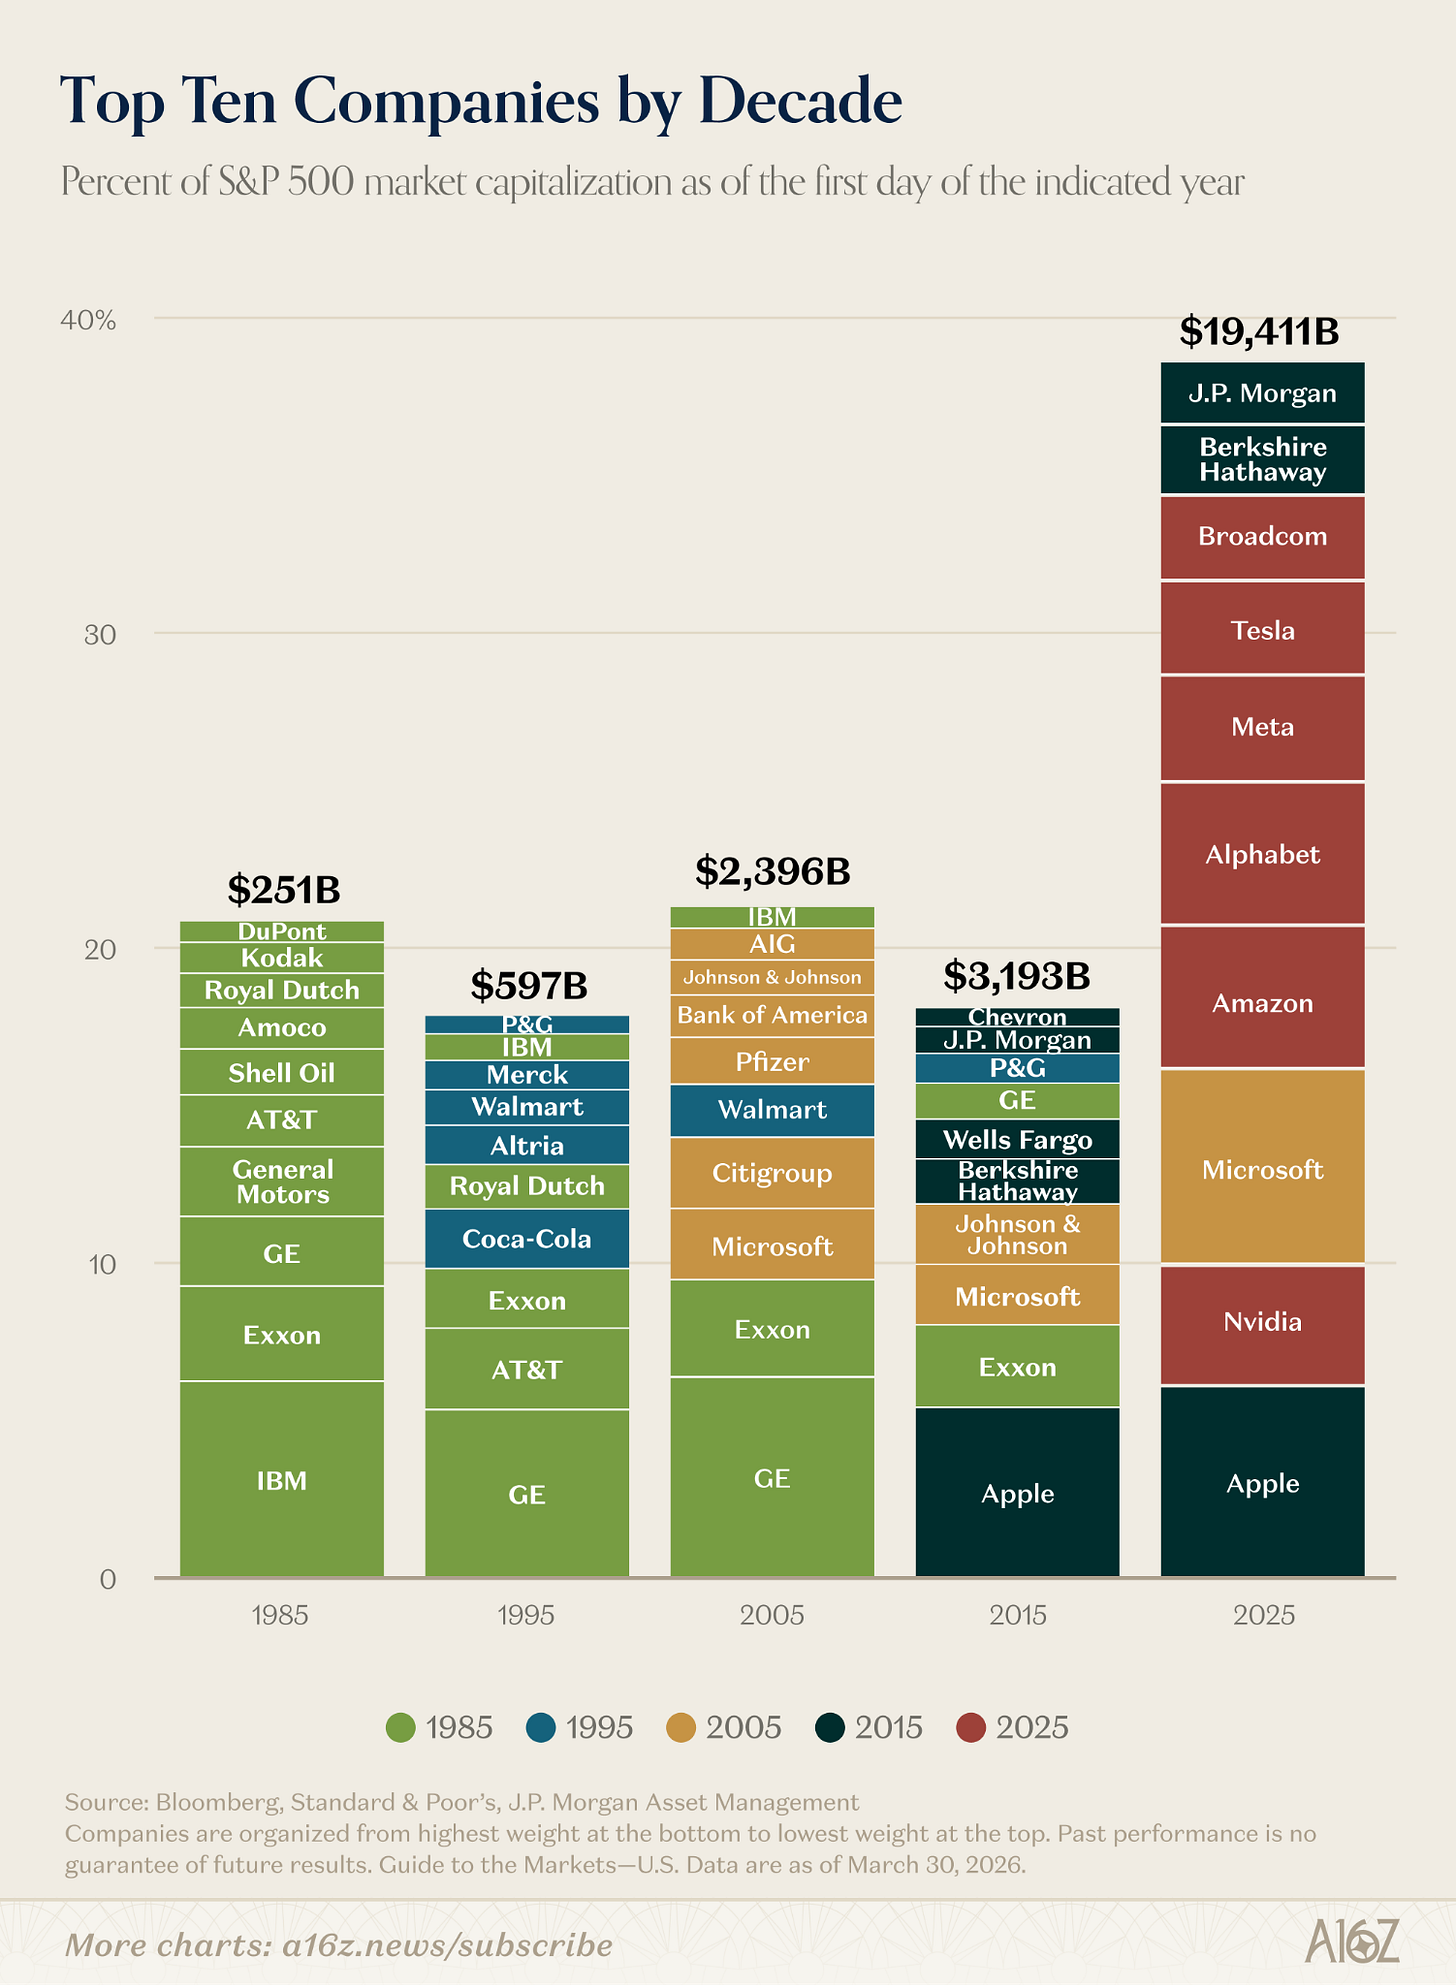
Caption: Market cap size and index weight of the S&P 500’s top 10 companies over time
The combined market cap of the S&P 500’s top 10 companies is now roughly six times what it was in 2015—and their share of the index’s total market cap has doubled.
There has been a turnover. The composition of the top 10 has shifted dramatically compared to previous decades. By 2025, only three names will carry over from the prior decade—and just one (Microsoft, a tech company) will remain from the decade before that.
If you’d tried in 2015 to model tech stocks using the largest companies in the index at that time, you’d have underestimated their upside by roughly sixfold. Technology has fundamentally “broken the models,” redefining the ceiling for how large a company can become.
And that ceiling appears to keep rising.
In fact, tech’s centrality to the global growth story has recently strengthened further. Last week we highlighted that the earnings growth forecast for the tech sector is about twice that of the rest of the market. Looking back further, you’ll find tech contributing a historically unprecedented share of overall market earnings growth:
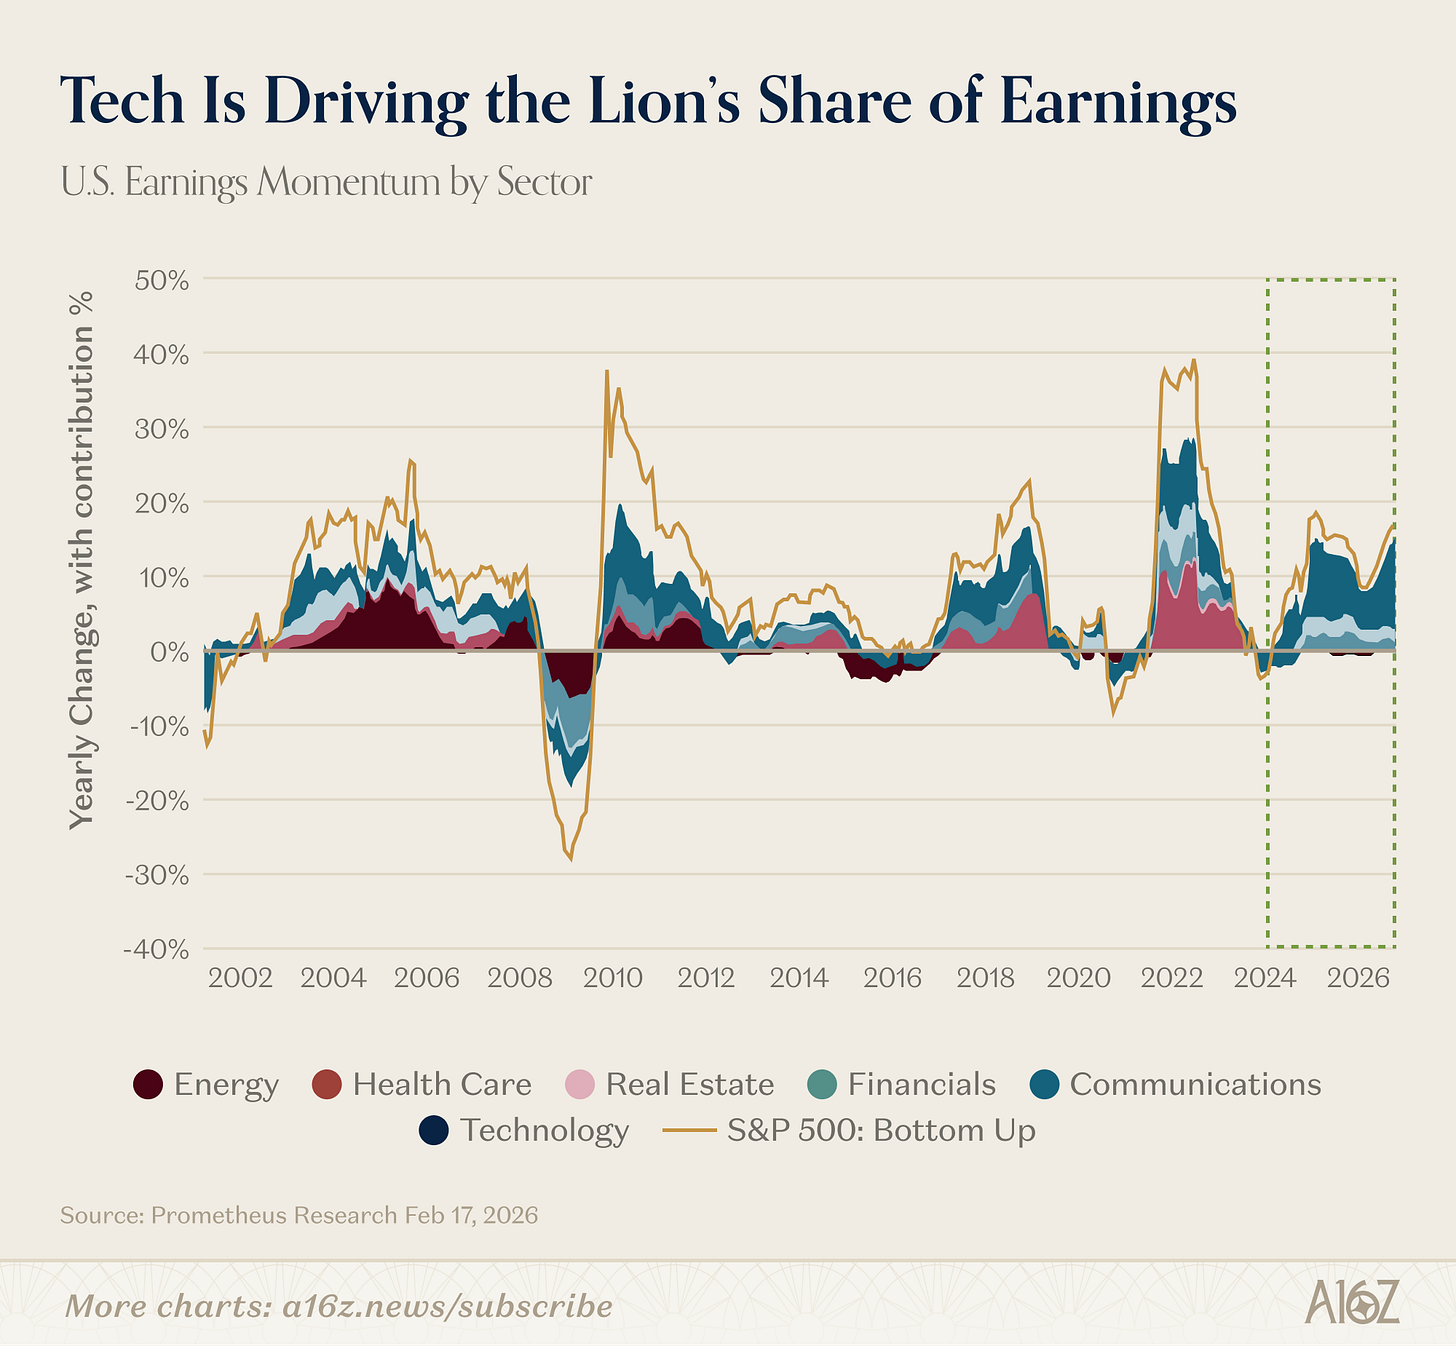
Caption: Sector contributions to overall market earnings growth
Since 2023, tech has accounted for over 60% of total market earnings growth.
No other sector—not even energy during its brief early-2000s heyday—has played such a dominant and sustained role in earnings growth.
Today, it’s fair to say tech isn’t just one cycle among many—it is the cycle.
Railroad GPT
We just called tech an unprecedented phenomenon—but that’s not quite right.
In the industrial era, no sector wielded greater dominance than railroads:
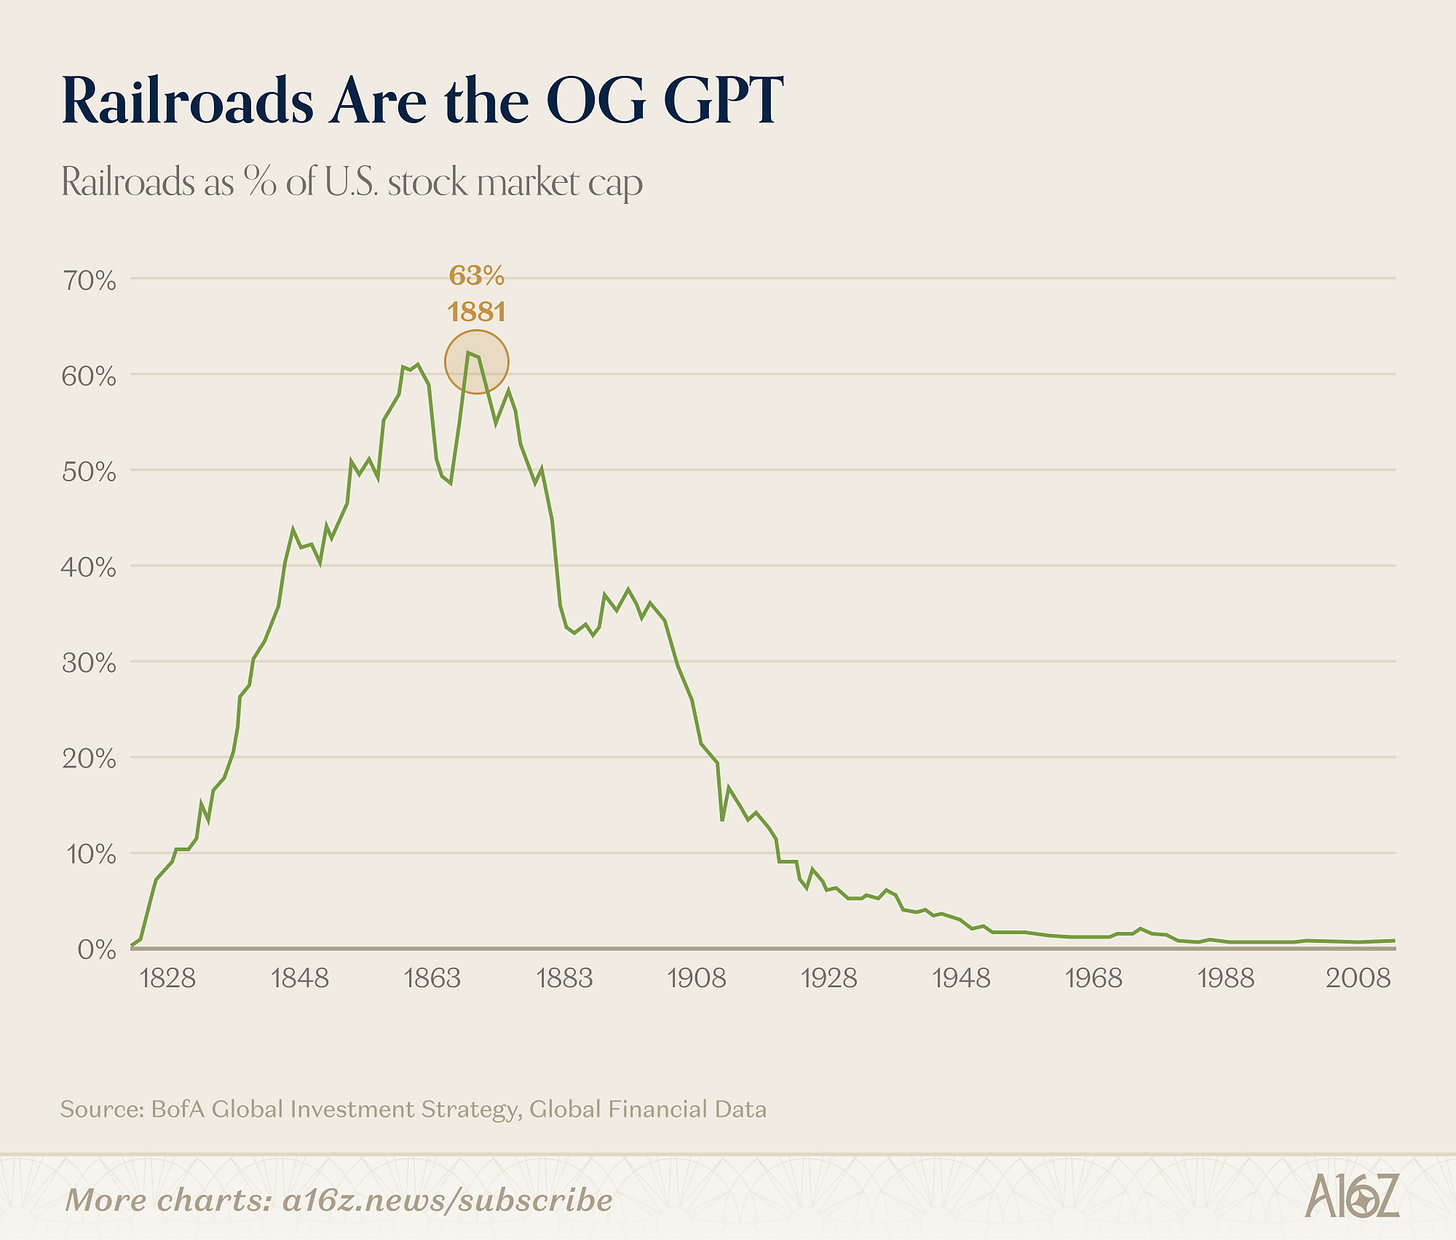
Caption: Railroads’ share of total U.S. market cap (peak ~63%)
At their peak, railroads accounted for roughly 63% of the U.S. stock market’s total market cap—Bank of America dubbed them “the most dominant innovation sector of all time.”
Bearish commentators love this railroad chart: “Look—railroads once made up 63% of the market, then the bubble burst, and today they’re nearly irrelevant.”
But reality is more nuanced. Railroads remain important. What actually happened was that railroads catalyzed an entirely new—and previously unimaginable—economic system, one far larger than railroads themselves.
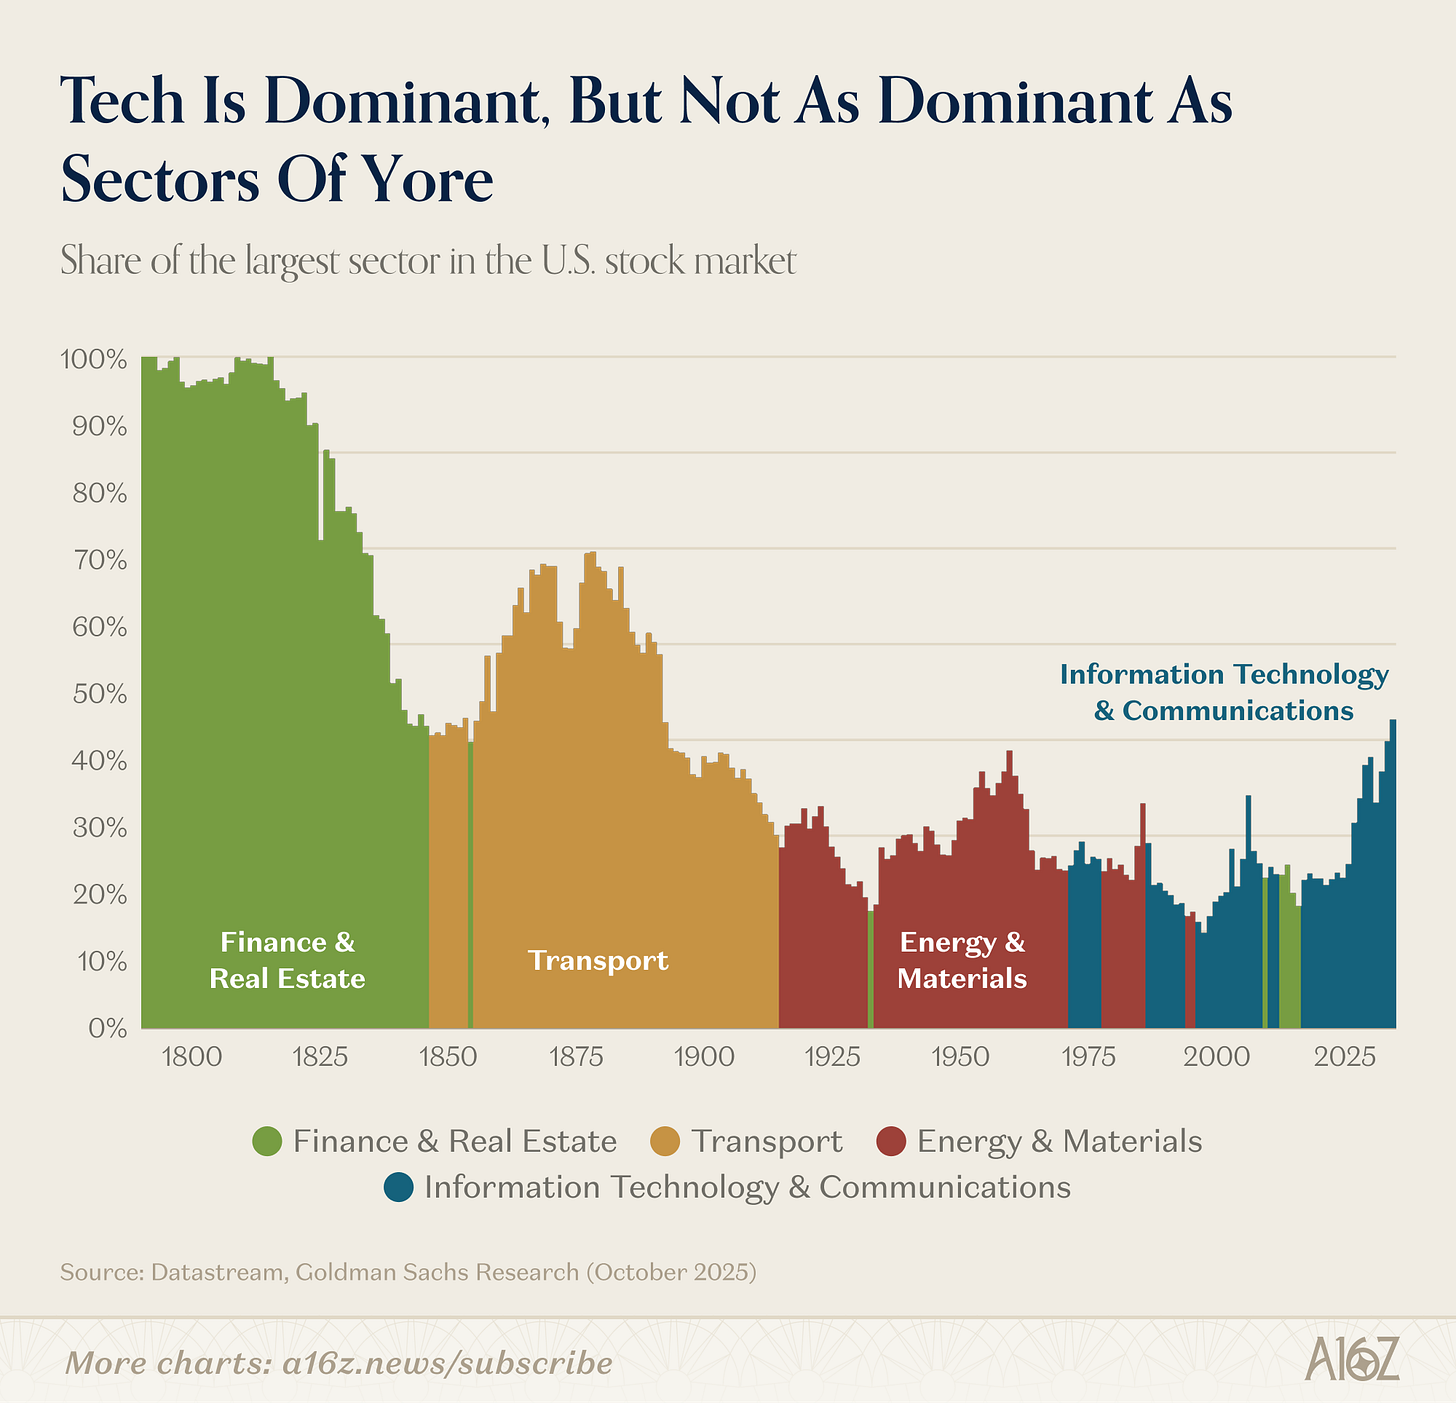
Caption: Evolution of U.S. equity market sector weights (19th century to present)
Railroads yielded dominance to industry, which in turn gave way to tech (with finance and real estate briefly ascending pre-global financial crisis).
Tech is massive today—but relatively speaking, it’s nowhere near as dominant as transportation (or real estate and finance) were at their peaks in the 19th century.
The economy has grown larger and more complex. Roughly 70% of today’s market sectors either barely existed or were negligible in 1900.
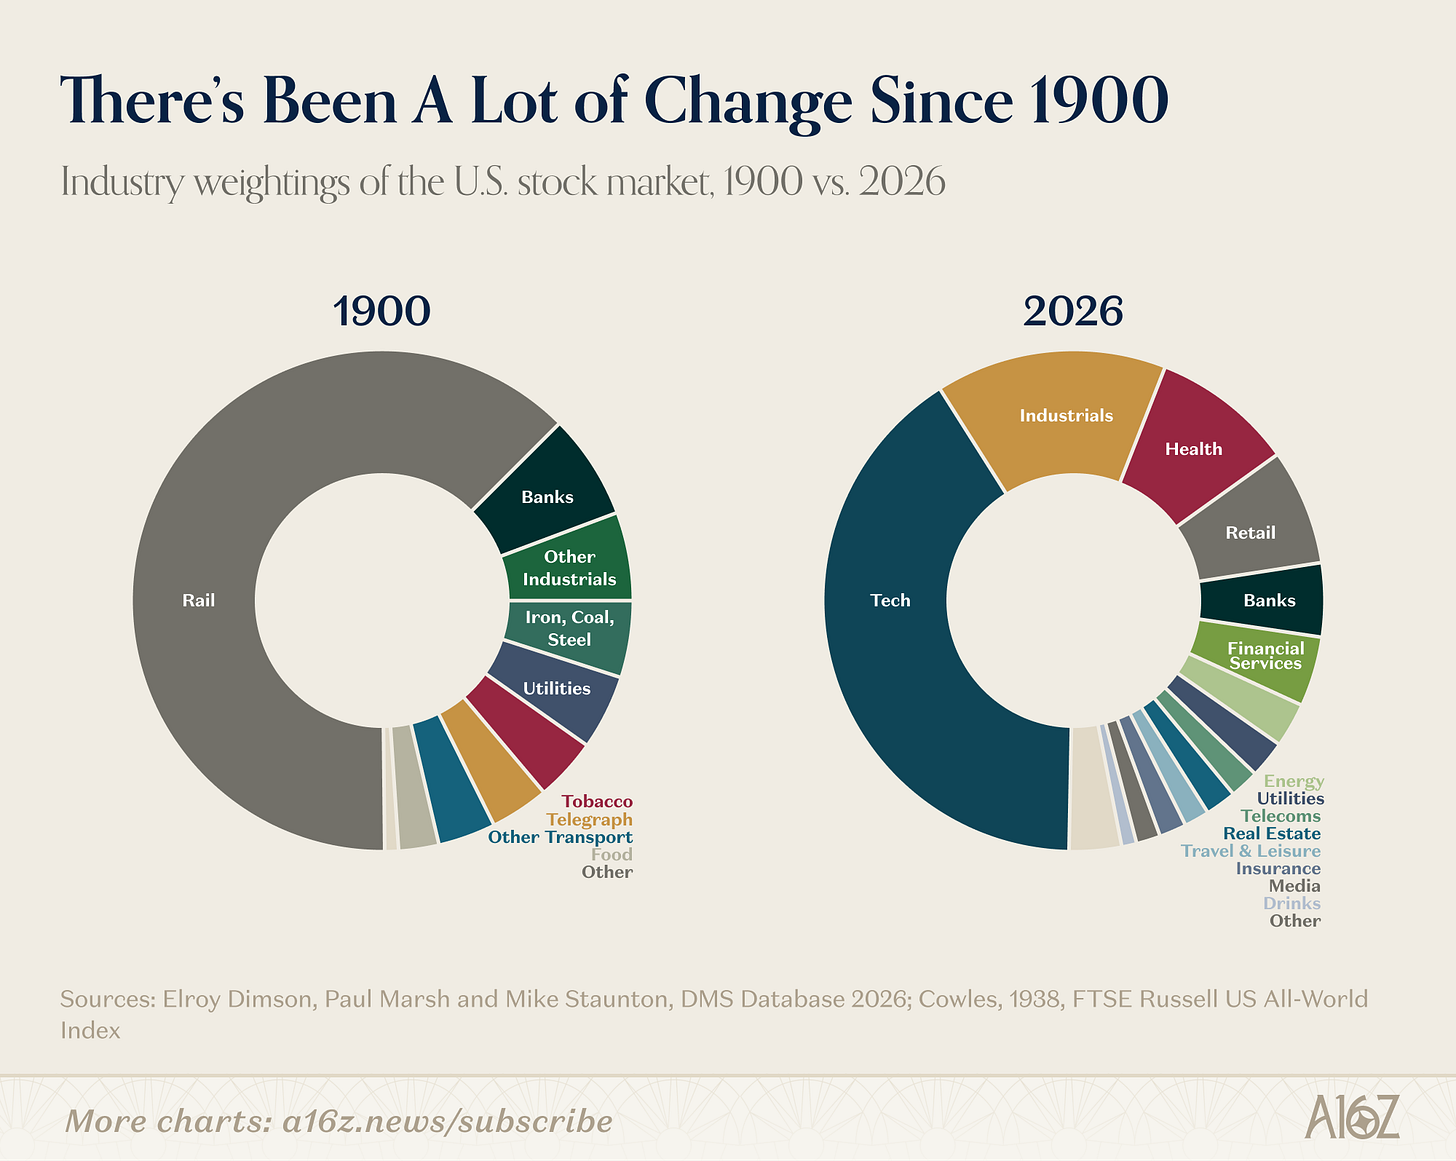
Caption: U.S. equity market sector composition in 1900 vs. today
The U.S. economy in 1900 revolved around textiles, steel, coal, tobacco—and the railroads that transported them and the banks that financed them. Today, those industries collectively represent only a tiny fraction of the market.
So the more interesting question isn’t whether a given platform transition is a bubble—but what new economic possibilities this technological leap will unlock.
Railroads were an extraordinary general-purpose technology. One dramatic (yet unexpected) outcome was the birth of the modern corporation. Before railroads, businesses were typically small enough to fit entirely in one person’s head. Railroads, however, involved too many train crews, stations, and simultaneous decisions.
In 1855, directors of the New York and Erie Railroad drew what’s considered the first modern organizational chart: a hierarchical tree diagram mapping reporting relationships, designed to solve increasingly complex scheduling challenges. In many ways, middle management, multi-divisional structures, professional managers, and even the MBA degree all trace their origins to the organizational problems created by railroads.
Railroads didn’t just change what America produced—they changed what a “corporation” itself was. The emergence of middle management was, in Alfred Chandler’s words, the “visible hand.”
The intriguing thing about AI is that, like railroads a century ago, it may rewrite the very organizational template railroads established.
Last month, Jack Dorsey and Block’s leadership published an essay making precisely this argument: AI’s value in enterprises isn’t just giving everyone a copilot—it’s replacing middle-management functions. Tasks like absorbing and routing information, maintaining alignment, and precomputing decisions—the coordination work traditionally handled by managers—can be delegated to technology in an AI-native company, freeing people to focus judgment on customer interactions and human relationships.
By his account, a 170-year-old corporate management model is being handed over to technology—giving rise to entirely new organizational forms. That’s no small matter.
Whether Dorsey is right—and what kind of new enterprises ultimately emerge—remains an open question. But these implications dwarf questions like “Will tech stocks pull back from recent highs this quarter?”
Stablecoin Transaction Volume Is Shifting from Transfers to Payments
Stripping out mechanical operations like trading, treasury management, and exchange-related activity—which dominate stablecoin transaction volume—estimates suggest genuine peer-to-peer payments totaled $350–$550 billion last year.

Caption: Stablecoin payments broken down by type (B2B, B2C, C2B)
B2B transactions dominate stablecoin payments (unsurprising given scale), but B2C and C2B volumes are also growing.
In short, stablecoins are increasingly embedded in everyday commerce—a broader trend explored in depth in this piece by a16z crypto.
The Next Decade of Journalism
Trust in mass media among Americans has recently hit a new all-time low—one of the most striking slow-motion collapses in modern polling history.
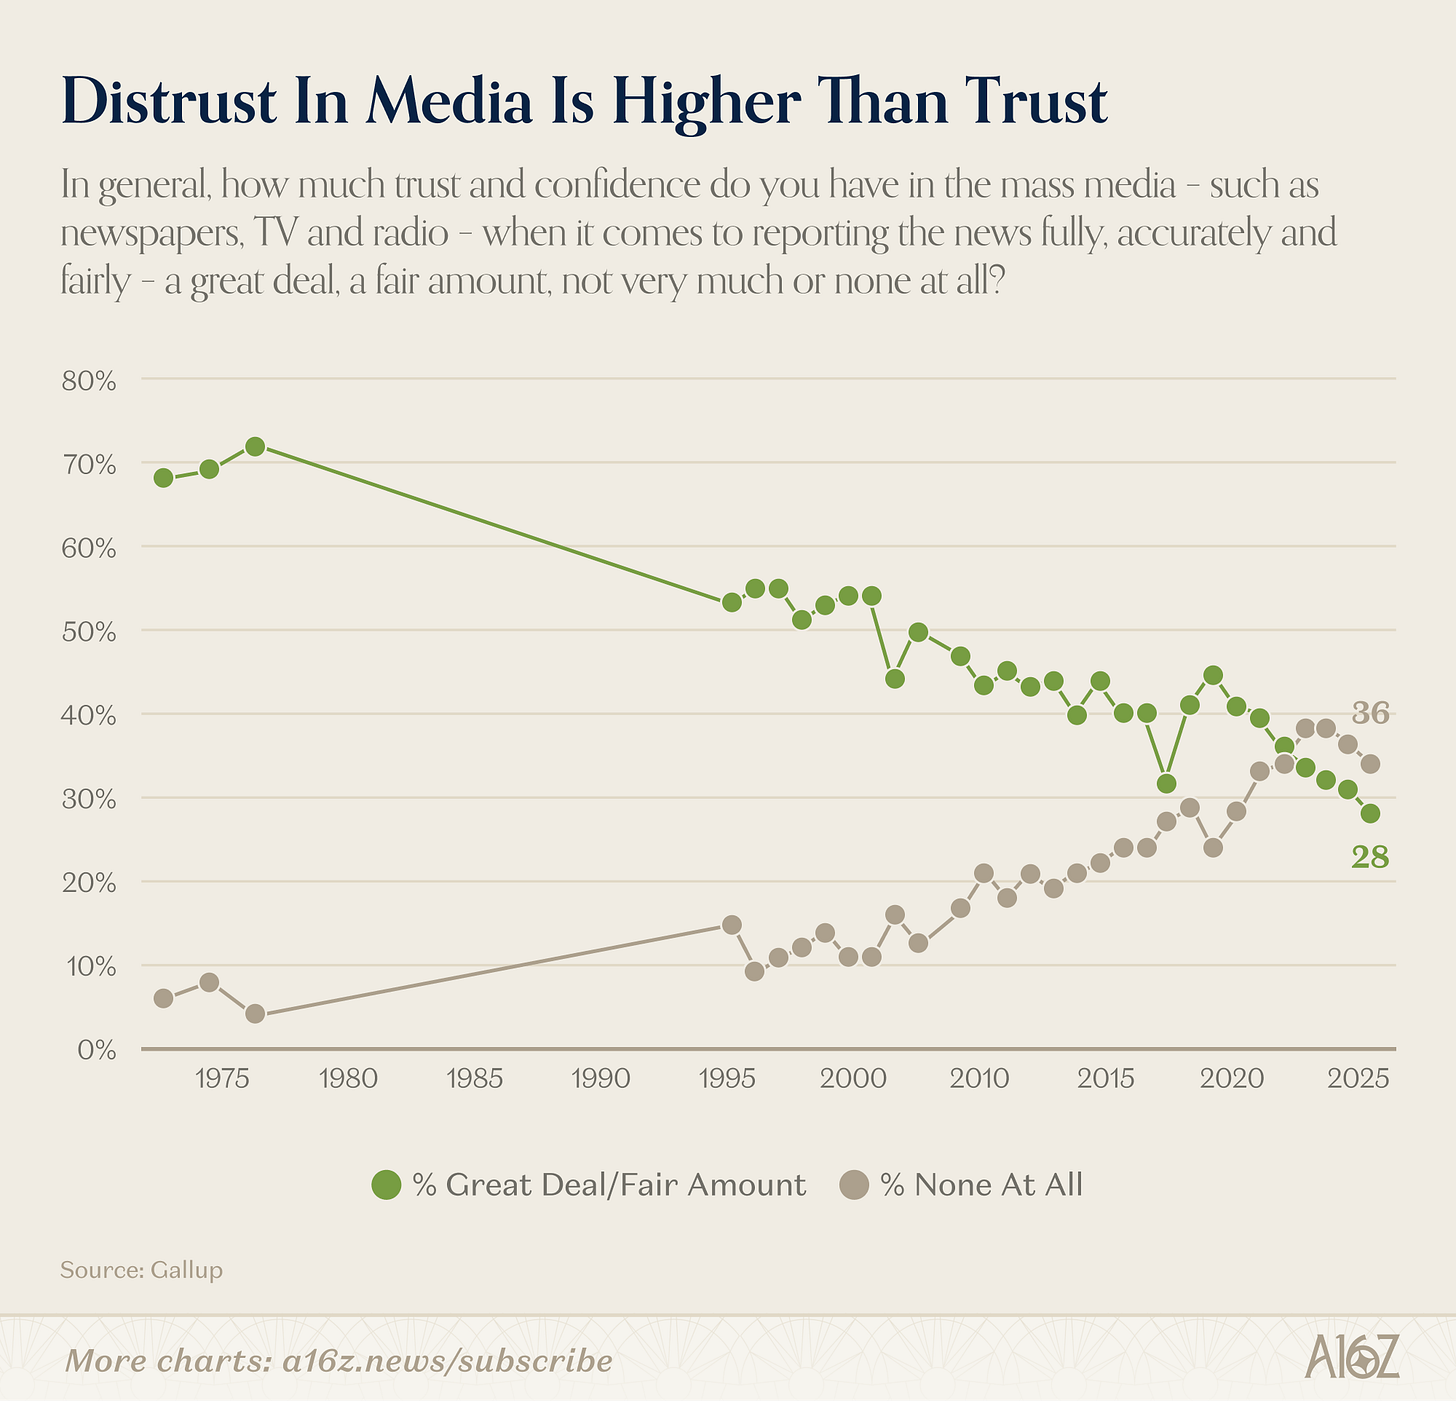
Caption: American trust in mass media (1975–2025)
In 2025, only 28% of Americans reported having “a great deal” or “quite a lot” of trust in mass media (newspapers, TV, radio)—down from 72% in 1975.
Yet overall trust figures don’t tell the full story.
The real story lies in a stark generational divide—with a massive rift:
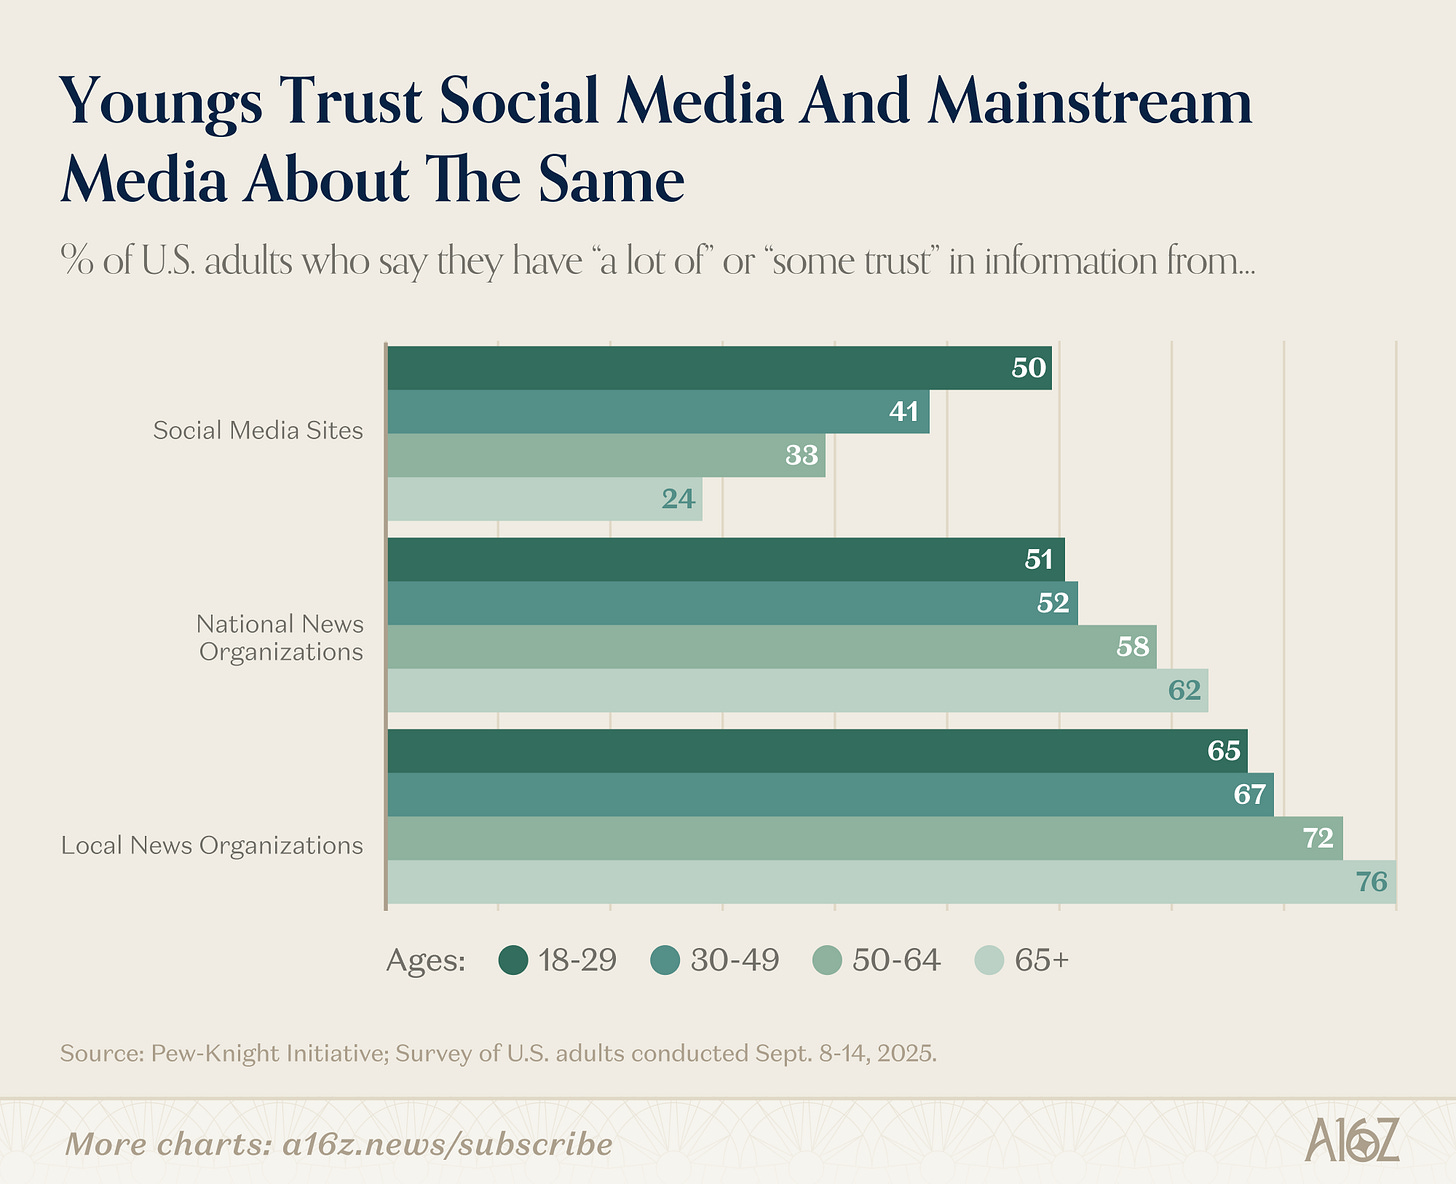
Caption: Trust in traditional media vs. social media across age groups
The younger the cohort, the lower the trust in traditional media—and the higher the trust in social media. The reverse holds true: older cohorts trust traditional media more and social media less.
Beyond trust lies a consumption gap:
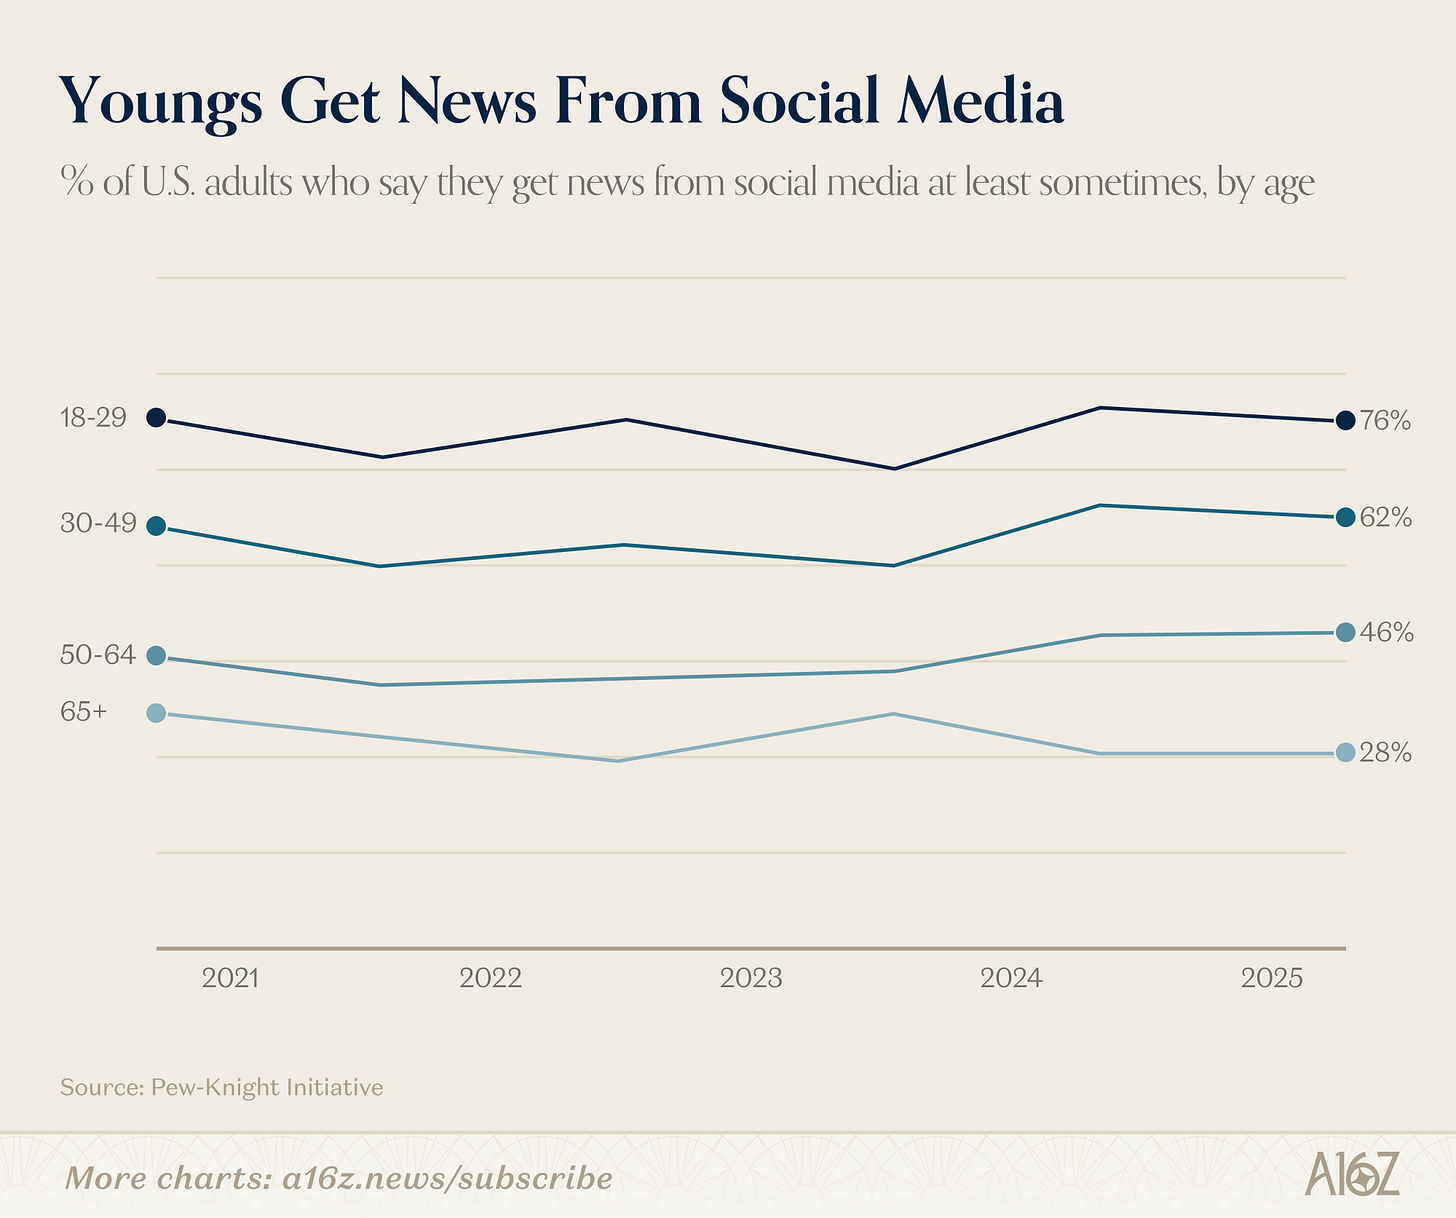
Caption: Share of adults who get news from social media, by age group
Among adults under 30, 76% get news from social media at least occasionally. Among those aged 65 and older, only 28% do so—even slightly lower than five years ago.
Yes, trust in mass media has fallen sharply from its peak—but much of that decline reflects a generational shift in media habits. Younger generations trust mass media far less than their elders—and are heavy users of social media alternatives.
Returning to our starting point: the 72% trust level in 1975 is often nostalgically recalled as journalism’s golden age. Yet it’s equally true that the early 1970s featured only a handful of TV networks and newspapers dominating information supply—with virtually no competition.
So it’s fair to ask: How much of that “peak” trust stemmed from high-quality journalism—and how much from having no alternative? These aren’t mutually exclusive: the late 1960s and early 1970s may well have featured both excellent journalism and a captive audience. But it’s hard to ignore that the generation exhibiting the lowest trust in mass media is precisely the one raised amid the greatest abundance of choice.
This is exactly Martin Gurri’s thesis in The Revolt of the Public: the collapse of information monopolies across domains—media, government, professional authority—has exposed authority that was never truly earned. The public has seen behind the curtain—and trust has eroded accordingly.
Gurri also argues the public excels at tearing down old systems but struggles to build new ones. He may be right. But at least the capital barrier to building new media alternatives has never been lower. Whether they can rebuild trust in journalism will be the defining story of the next decade.
Goodbye, Productivity Boost
Zyn (nicotine pouch) sales have entered uncharted territory: year-over-year growth has turned negative for the first time.
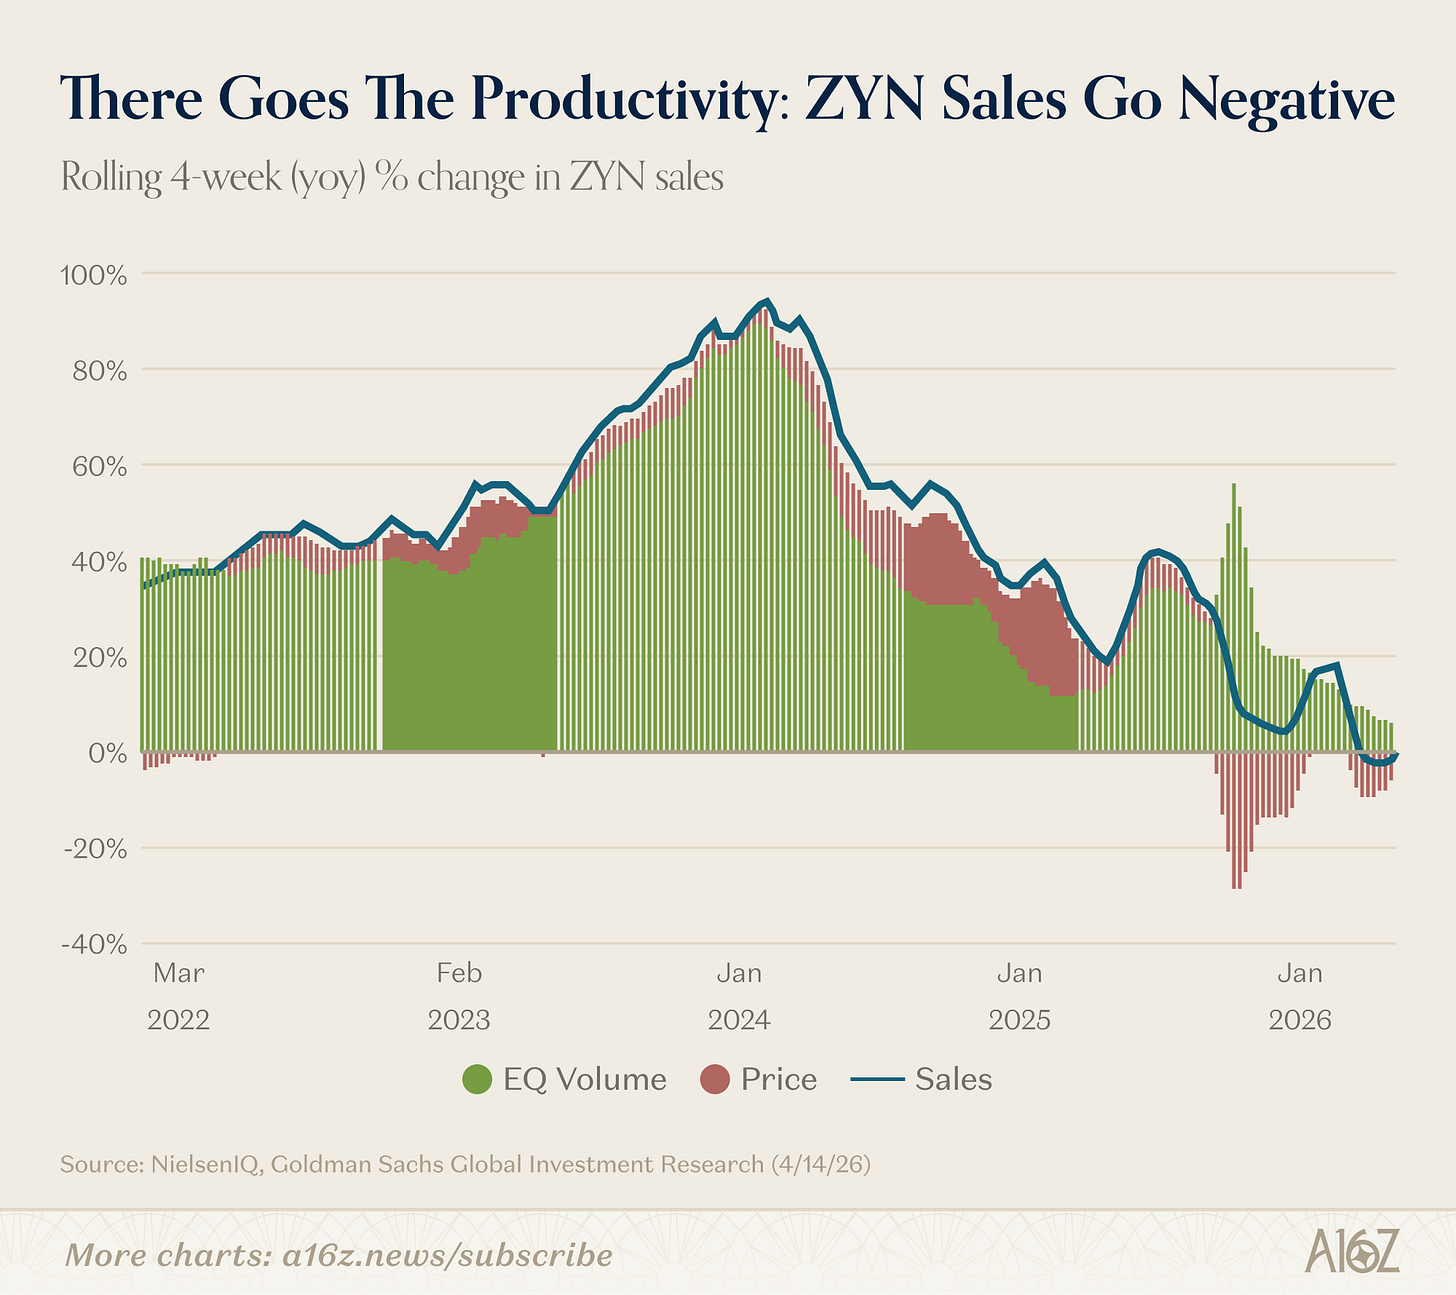
Caption: Zyn sales YoY growth rate (4-week rolling), turning negative for the first time
On a 4-week rolling basis, Zyn’s year-over-year sales growth has turned negative for the first time—albeit by a very small margin.
In fact, unit volume remains positive. The slight dip in total revenue stems from recent heavy promotional activity.
The productivity boost remains intact (smile).
One more intriguing detail: Zyn’s share of the nicotine pouch market has fallen below 50%:
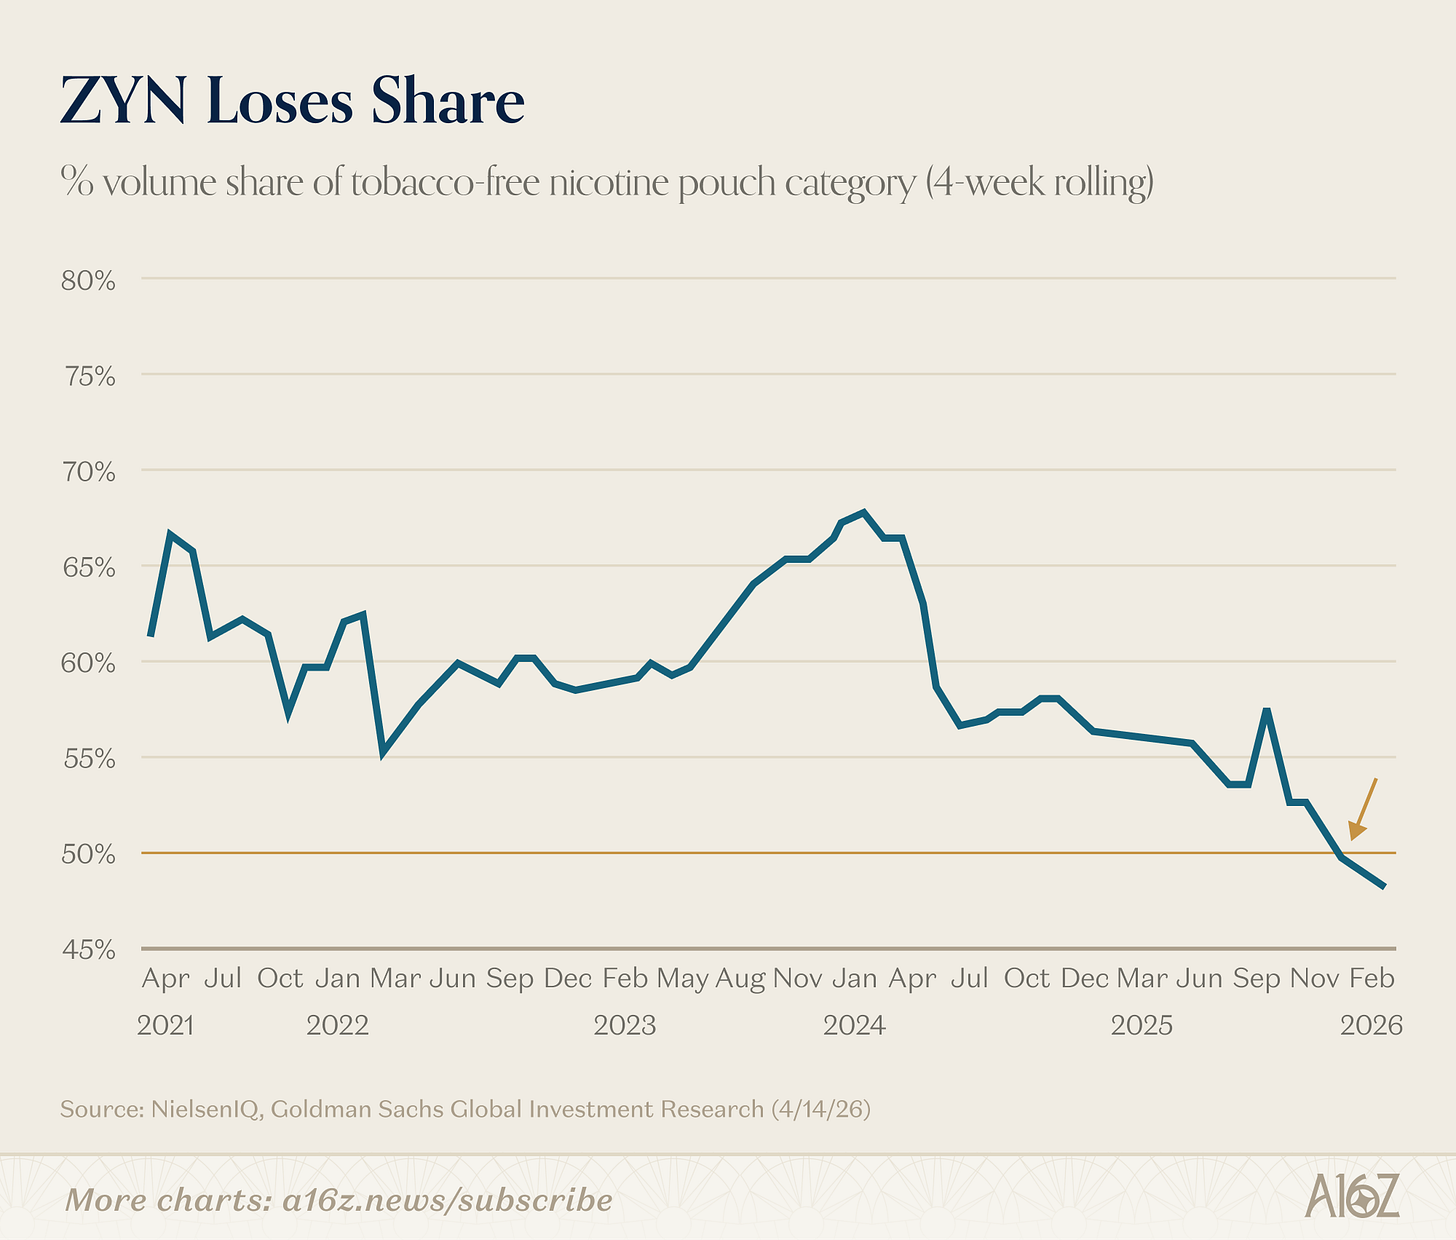
Caption: Zyn’s market share in the nicotine pouch category over time
Zyn’s market share dipped below 50% at the end of last year.
[^1]: Yes, we know market cap (a stock) and GDP (a flow) are apples-and-oranges. But the chart still looks pretty cool.
Join TechFlow official community to stay tuned
Telegram:https://t.me/TechFlowDaily
X (Twitter):https://x.com/TechFlowPost
X (Twitter) EN:https://x.com/BlockFlow_News