Unicorn Company Report: Within a One-Hour Drive of the U.S. Bay Area Lies 90% of Global AI Market Capitalization
TechFlow Selected TechFlow Selected
Unicorn Company Report: Within a One-Hour Drive of the U.S. Bay Area Lies 90% of Global AI Market Capitalization
The center of gravity of the global startup ecosystem is rapidly shifting toward the United States—and specifically, the Bay Area.
Author: Elad Gil (Data Analysis: Shreyan Jain)
Translation: TechFlow
TechFlow Introduction: For six consecutive years, Elad Gil’s team has tracked the global distribution of unicorn market capitalization. The 2025 data points to a clear conclusion: the San Francisco Bay Area is emerging as the supercluster for generative AI—91% of global AI unicorn market cap is now concentrated within a one-hour driving radius. Meanwhile, the pace of new unicorn creation has slowed, yet the average valuation of existing unicorns has reached a six-year high. This report uses hard data to reveal how the center of gravity in the global startup ecosystem is accelerating its shift toward the U.S.—and specifically, the Bay Area.
All data is as of December 31 of the respective year; “2025” in the text below refers to market cap as of December 31, 2025 / January 1, 2026.
Over the past two years, we have witnessed market corrections in the post-zero-interest-rate era, the explosive rise of frontier AI labs such as OpenAI and Anthropic, and ongoing debates about an “AI bubble.” The data shows that the San Francisco Bay Area has evolved into an AI supercluster, with 91% of global private AI market cap concentrated within a one-hour driving radius.
Past analyses are available here: 2019, 2020, 2021, 2023.
Key Findings
- Generative AI has turned the Bay Area into a supercluster. The Bay Area currently accounts for approximately 39% of global unicorn market cap—more than four times that of the second-largest city. Just one year ago, this figure stood at only 29%. Among generative AI unicorns alone, the Bay Area’s share reaches 91%.
- The U.S. holds absolute dominance among unicorns. Over the past year, the U.S. added nearly $1.2 trillion in unicorn market cap, capturing roughly 65% globally. Europe’s market cap share has now surpassed China’s—but remains only around 10%.
- New unicorns are increasingly concentrated in the U.S. and the Bay Area. Among unicorns founded in 2023 and later, the U.S. accounts for 83% of total market cap—up from just 60% among those founded in 2022 and earlier. The Bay Area’s concentration is even more striking: 63% for the newer cohort versus only 33% for the older cohort.
- The pace of new unicorn creation is slowing. Only ~300 new unicorns emerged between 2022 and 2025—compared to over 900 in the prior three years.
- Yet existing unicorns are more valuable than ever before. The total number of unicorns grew only 6% year-on-year, but total market cap surged 33%. The average market cap per unicorn reached its highest level in six years.
- Valuation growth is driven primarily by AI companies. In 2025, generative AI unicorns saw average valuations rise by ~$2.2 billion year-on-year, versus just ~$400 million for non-AI unicorns. Generative AI’s share of total global unicorn market cap soared from 2% in 2024 to 22% in 2025. The Bay Area’s concentration will only continue to widen.
- Unicorn hubs cluster around specific industries. Six of the Bay Area’s top ten unicorns are AI companies; seven of New York’s top ten are fintech/crypto firms; three of Los Angeles’ top five are defense/aerospace companies (SpaceX, Anduril, Relativity—accounting for 83% of LA’s total unicorn market cap), and four of LA’s top ten are consumer companies.
Data Notes
All raw data comes from CB Insights and is available here. A few caveats:
Private funding rounds lag in publicly available datasets, so some unicorn valuations may not be up-to-date—for example, Anduril, Stripe, and SpaceX’s most recent funding rounds are not reflected in the data.
Unicorn market cap is, at best, a rough and lagging proxy for startup ecosystem vitality—and mapping companies to valuations, cities, and industries inevitably introduces error. Nevertheless, we believe the directional trends captured by the data are accurate.
Unicorn Concentration
Geographic concentration of global unicorn market cap has reached an all-time high. The U.S. accounts for 65% of all unicorn market cap—up from 58% a year ago and 44% in 2020. Its share is roughly four times that of China, the second-ranked country.

Caption: Global share of unicorn market cap by country (including three major outliers)
The Bay Area’s unicorn market cap is likewise more than four times that of the second-ranked city, rising from 29% in 2024 to 39% in 2025:
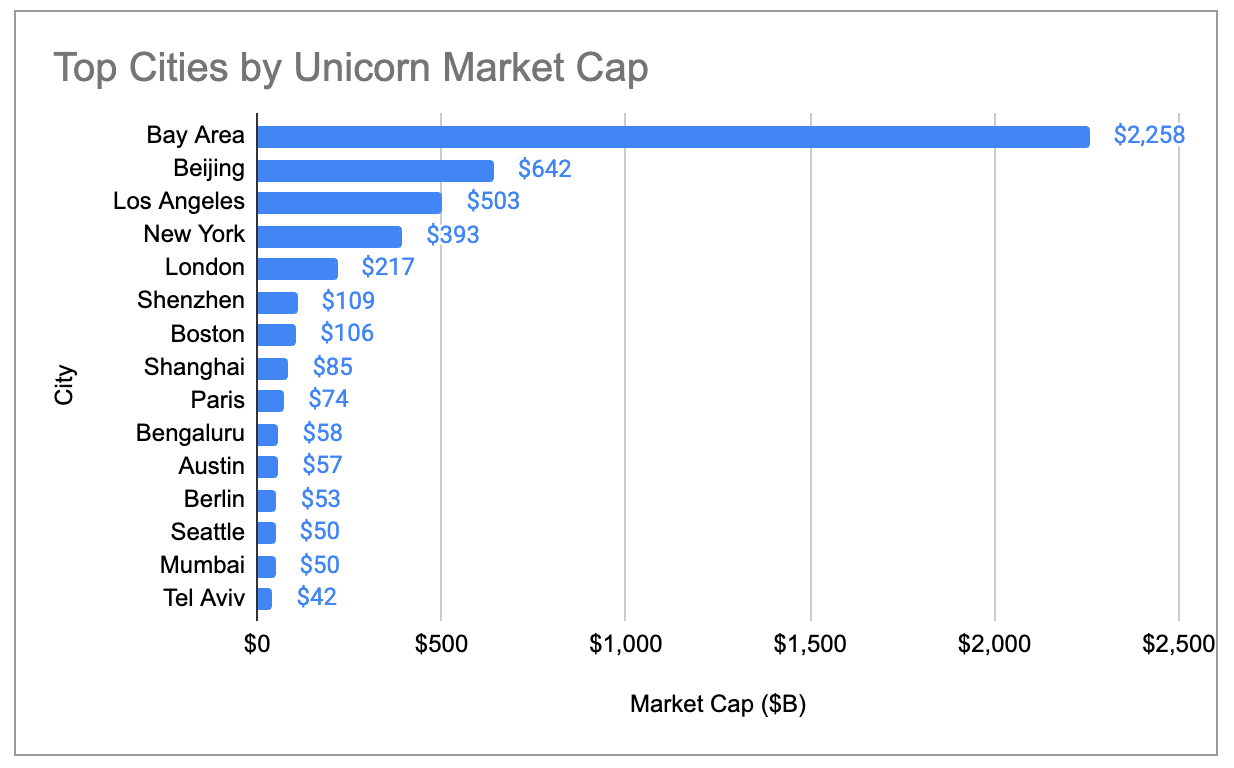
Caption: Global share of unicorn market cap by city (including three major outliers)
Even after excluding the three largest outliers—OpenAI ($500B), SpaceX ($400B), and ByteDance ($300B)—broader ecosystems have continued consolidating since 2019. The U.S. share has risen steadily, while China’s has declined steadily. Europe’s total unicorn market cap surpassed China’s in 2024, and both New York and London have overtaken Beijing.
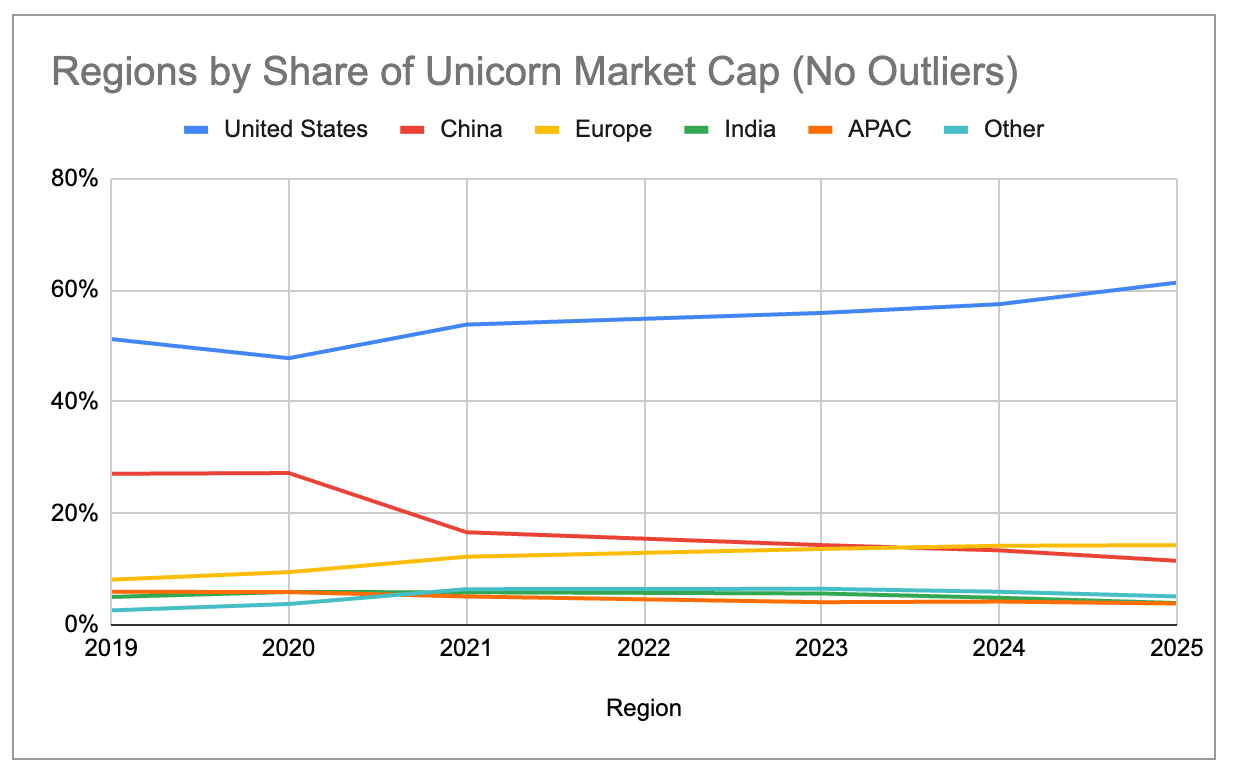
Caption: Global share of unicorn market cap by country (excluding three major outliers)
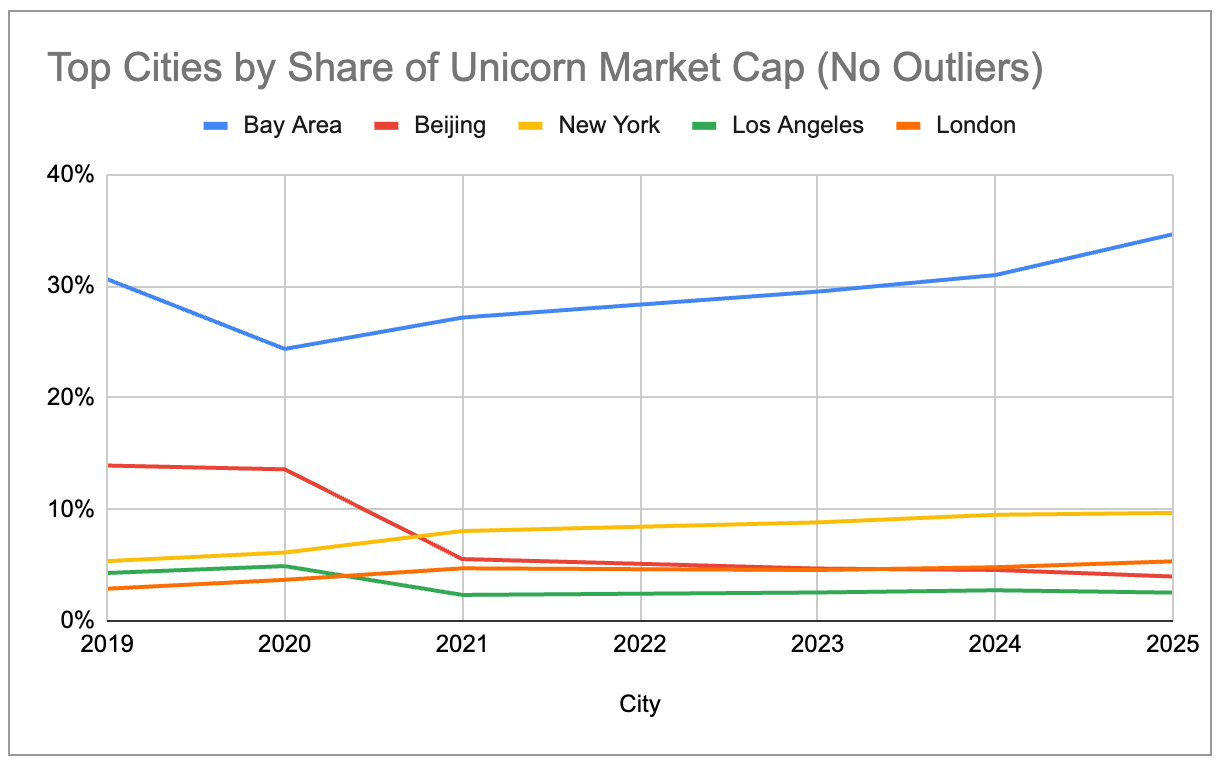
Caption: Global share of unicorn market cap by city (excluding three major outliers)
Super-Concentration of Generative AI
If we focus solely on the 97 unicorns whose core revenue stems directly from generative AI products or services, the Bay Area’s clustering effect becomes even more extreme: it accounts for 91% of global AI unicorn market cap—with no other city exceeding 2%.
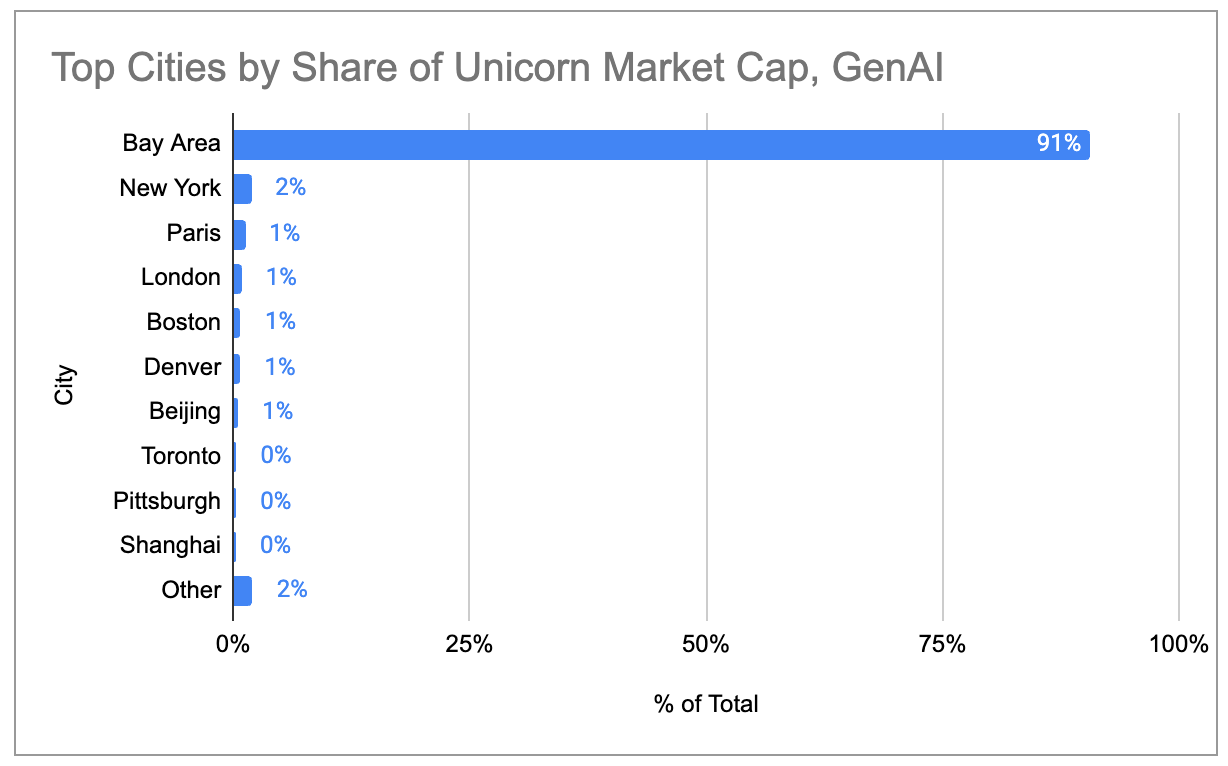
Caption: City-level distribution of generative AI unicorn market cap
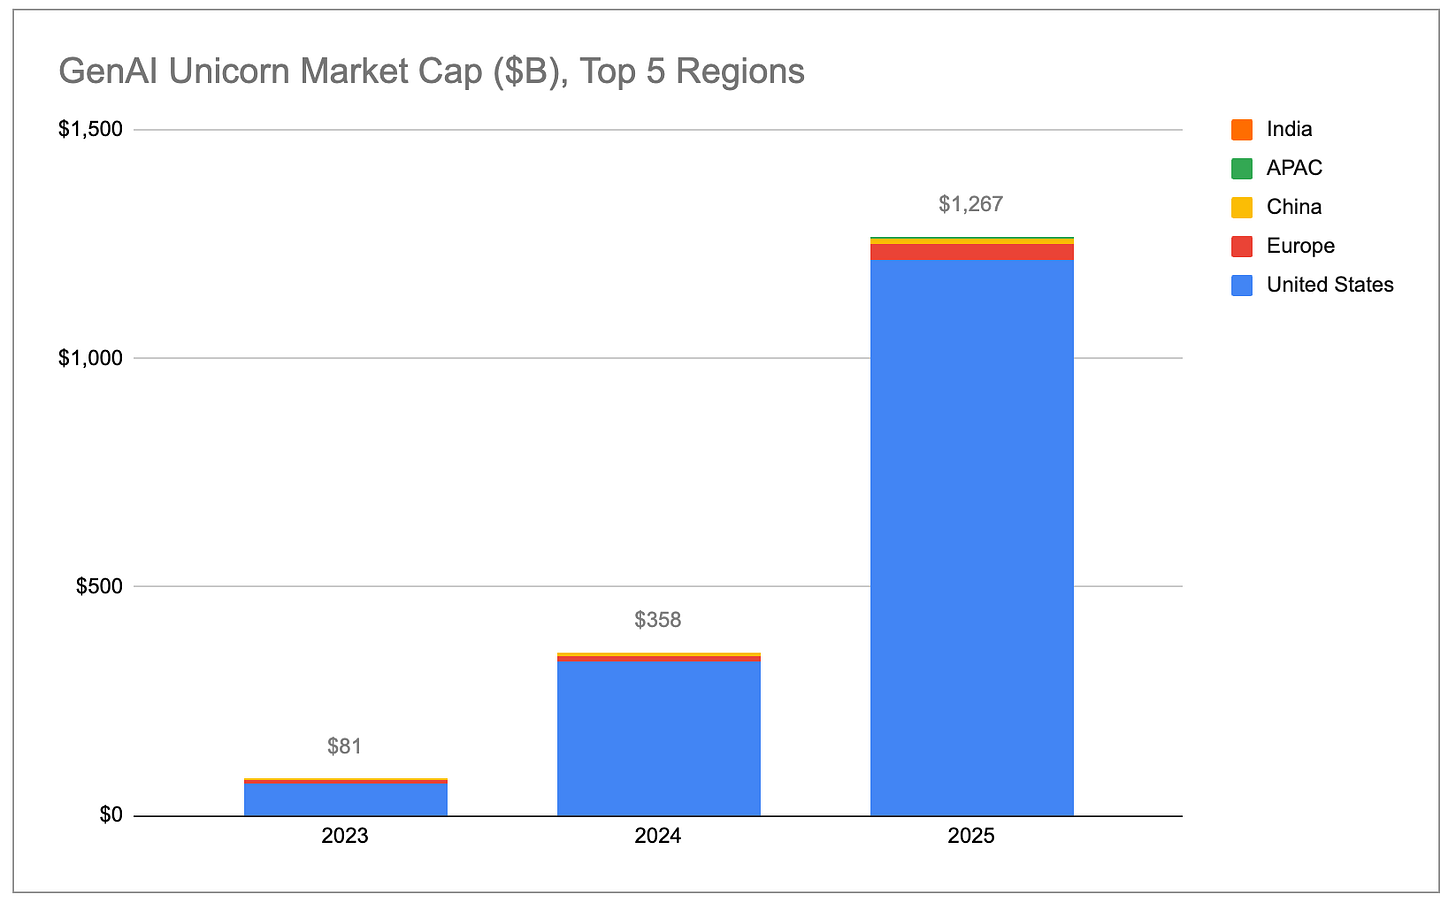
Total market cap of generative AI unicorns has grown exponentially—nearly all incremental growth coming from the U.S., and especially the Bay Area.
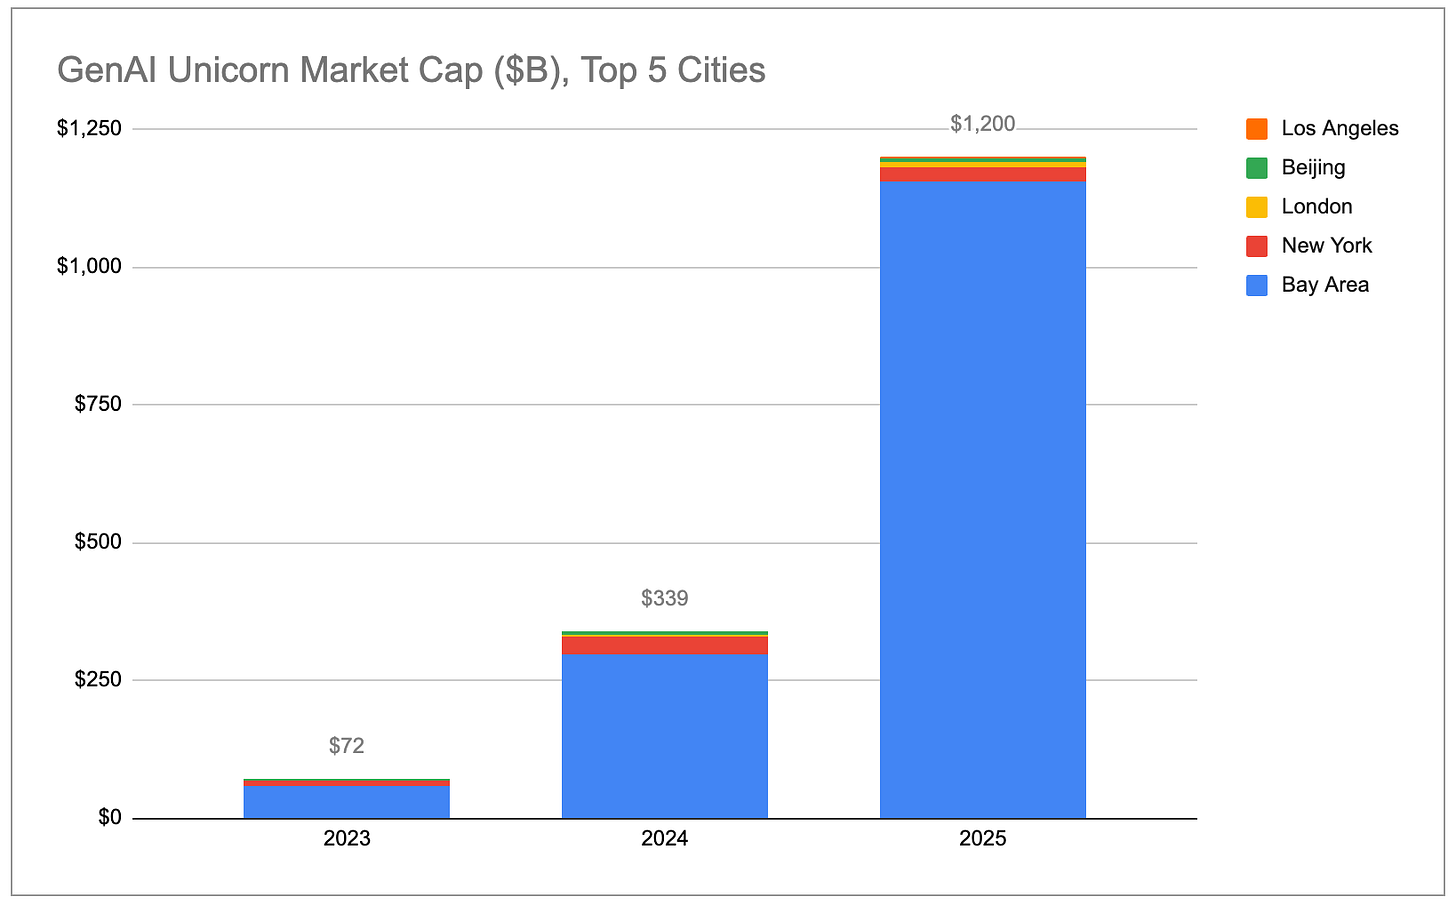
Caption: Total generative AI unicorn market cap by country
Caption: Total generative AI unicorn market cap by city
Valuation growth for AI unicorns far outpaces that of non-AI unicorns. The 48 AI companies that were unicorns for the full year of 2025 saw their combined market cap increase by $778 billion—exceeding the total market cap growth of the remaining 1,100+ non-AI unicorns. Even after excluding OpenAI (~$343B increase) and Anthropic (~$334B increase), generative AI unicorns still posted an average valuation increase of ~$2.2 billion—five times the ~$440 million average gain for non-AI unicorns.
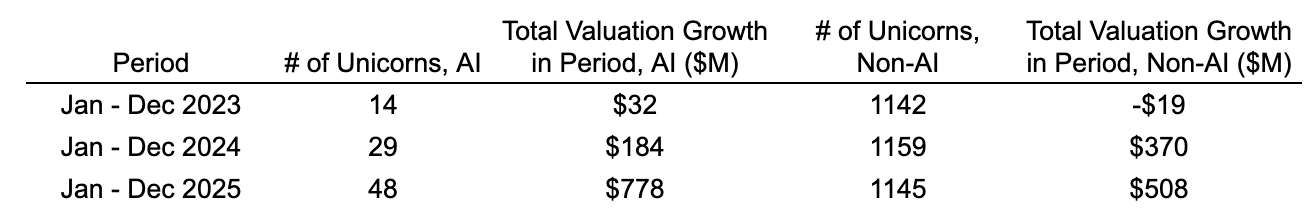
Caption: Market cap growth comparison—AI vs. non-AI unicorns
In relative terms, generative AI companies increased their share of total global unicorn market cap from 2% in 2023 to 22% in 2025. If this trend continues, the Bay Area—given its de facto monopoly on top-tier AI companies and talent—will further expand its share of global unicorn market cap.
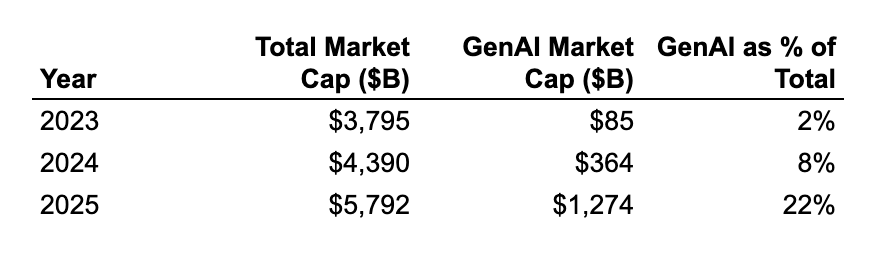
Caption: Evolution of generative AI’s share of total unicorn market cap
(Note: We classify only companies whose primary revenue derives directly from generative AI as “generative AI.” The full list is available here. We include chip/hardware firms like Cerebras and Tenstorrent, and infrastructure providers like CoreWeave and Crusoe—but exclude broader AI/ML infrastructure players such as Databricks, and robotics/defense firms like Anduril that apply AI/ML to autonomous systems.)
New Unicorns
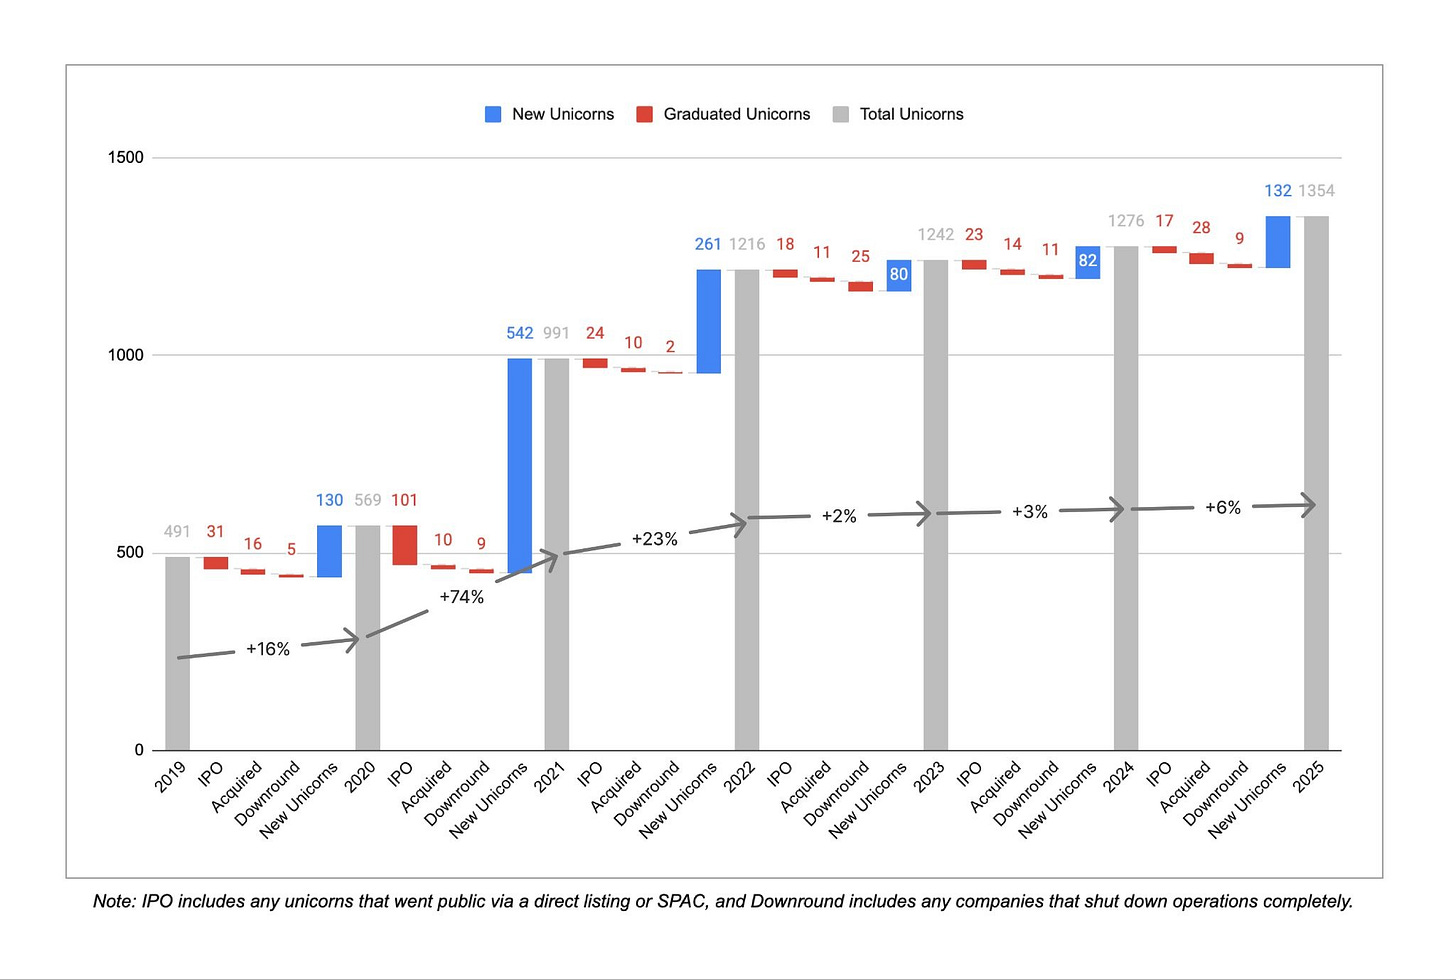
Caption: Annual count of newly minted unicorns
After three years of rapid growth, the pace of new unicorn creation has clearly slowed over the past three years. Between December 2019 and December 2022, over 300 companies joined the unicorn ranks each year on average. From December 2022 to December 2025, that number dropped to ~100 per year—though 2025 saw a modest rebound versus the prior two years. Meanwhile, 45 companies lost unicorn status over the past three years due to down-rounds or shutdowns—versus only 16 in the prior three years—indicating that corrections to the inflated valuations of the zero-interest-rate era (2021/2022) are still underway.
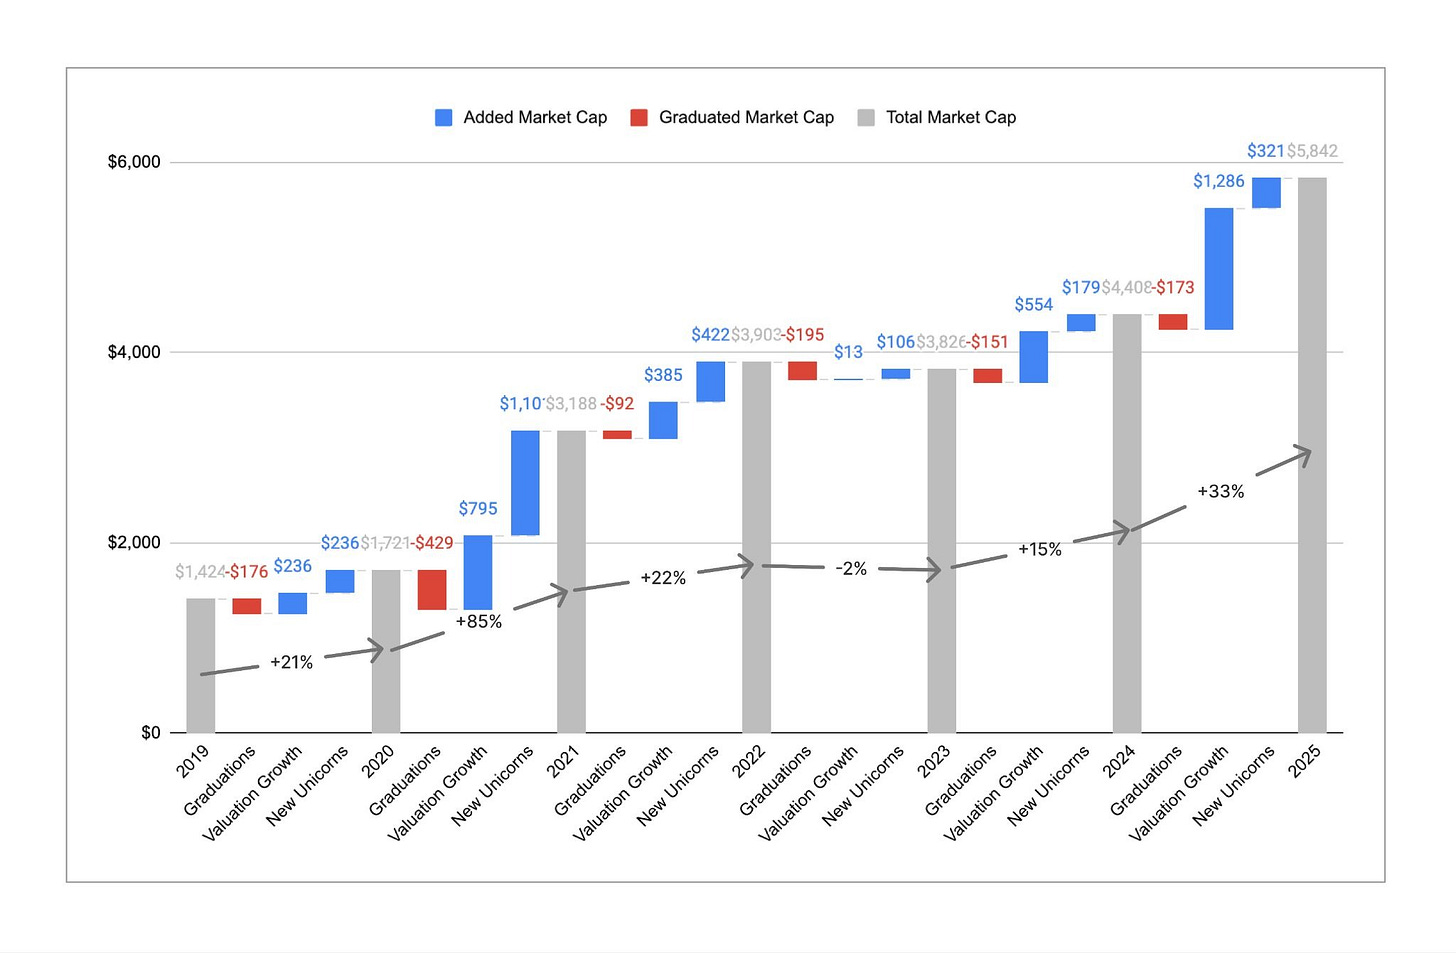
Caption: Unicorn count vs. total market cap trend
Although the number of unicorns remained largely flat, total market cap rose significantly. Over the past year, global unicorn market cap climbed from ~$4.4 trillion to ~$5.8 trillion—a 33% increase. This marks a strong rebound, especially following an actual year-on-year decline in 2023. Historically, market cap growth was driven more by new entrants crossing the unicorn threshold—but in 2025, ~80% of the growth came from valuation increases among existing unicorns. As a result, the average market cap per unicorn rose from ~$3 billion to ~$4.4 billion—the highest level in six years of tracking this metric. Becoming a unicorn is harder than ever—but once a company crosses the $1 billion threshold, it is, on average, more valuable and growing faster.
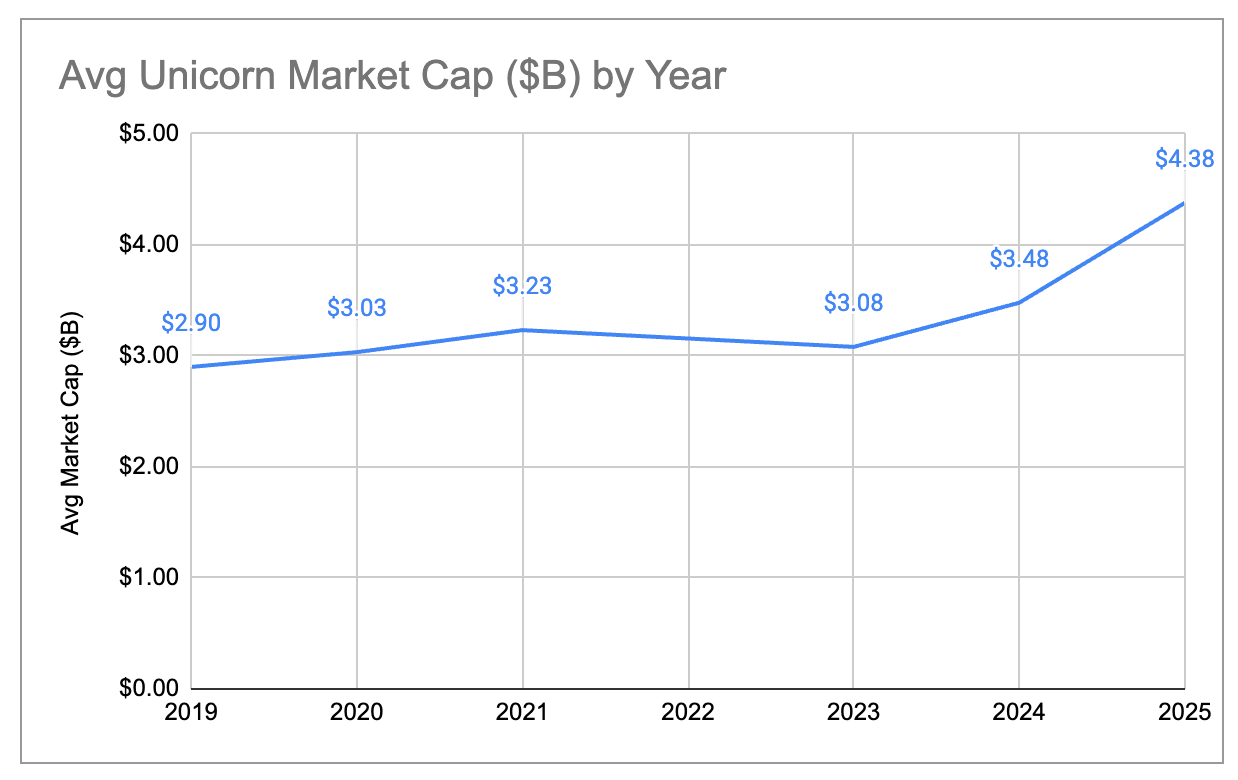
Caption: Trend in average unicorn market cap
New vs. Legacy Unicorns
One way to filter out distortions from zero-interest-rate-era inflation is to focus only on unicorns founded after 2023. Below is a comparison of market cap distribution for unicorns founded before and after 2023:
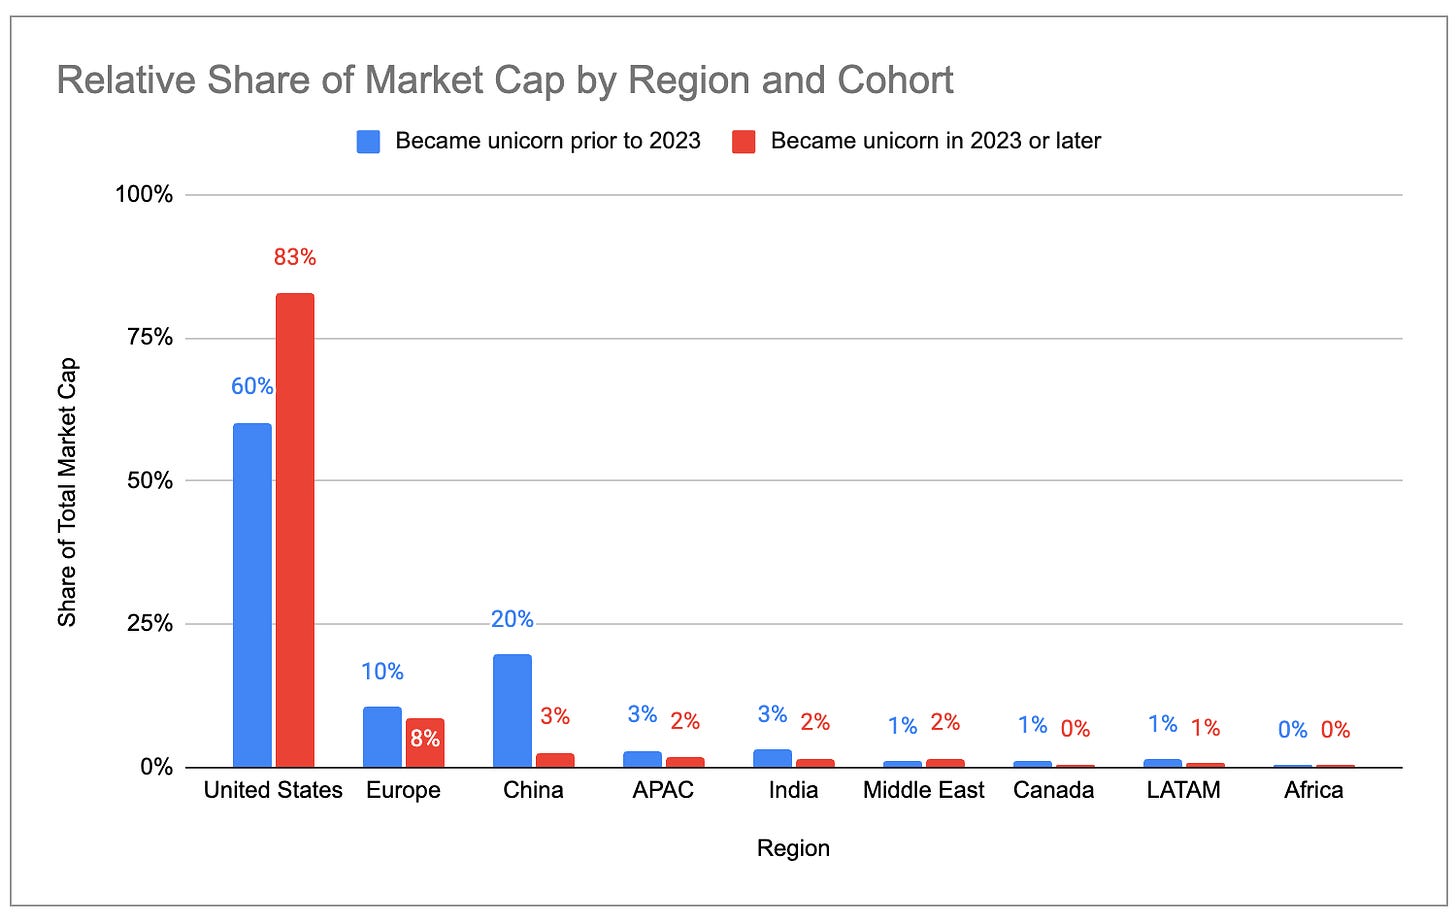
Caption: Market cap distribution of unicorns founded before 2023 (by country/city)
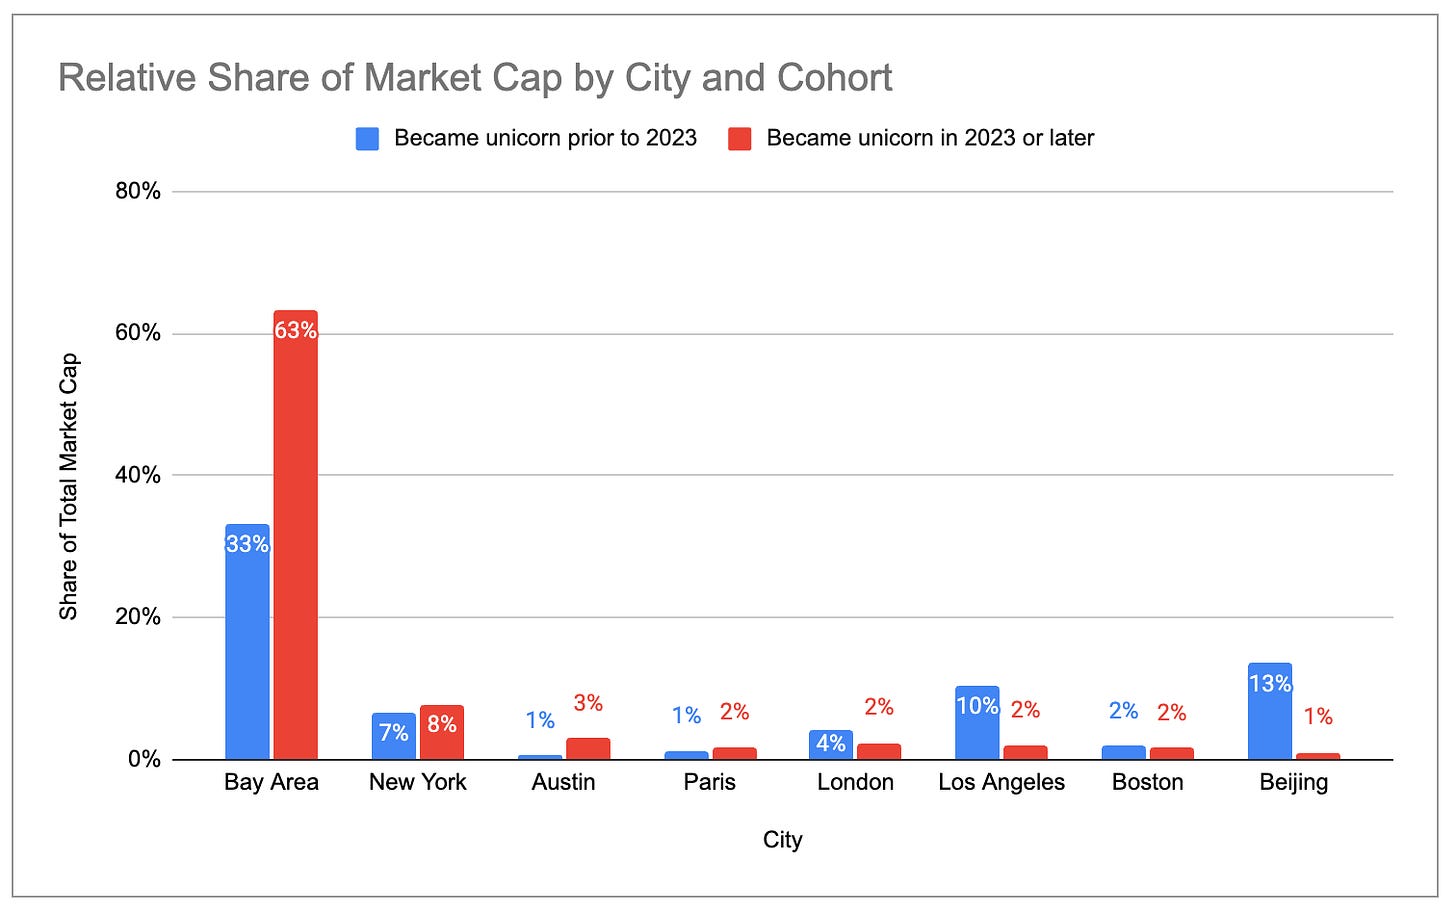
Caption: Market cap distribution of unicorns founded in 2023 and later (by country/city)
Newer unicorns are more concentrated in the U.S., while shares for Europe and China have declined. Among unicorns founded since 2023, the Bay Area accounts for 63% of market cap—versus only 33% among legacy unicorns.
“Zombie” Unicorns
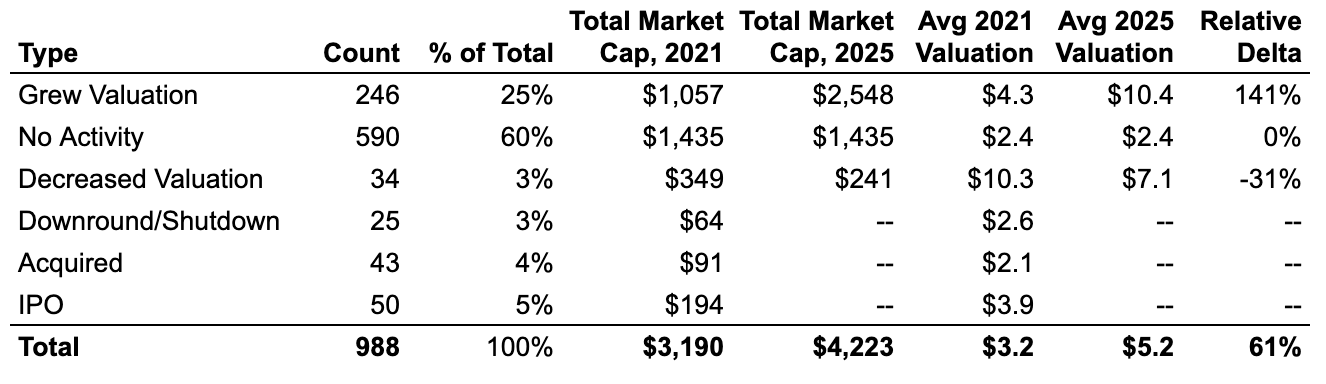
Of the nearly 1,000 unicorns as of December 2021, ~60% retain unicorn status today but have raised no new financing rounds. These “zombie” unicorns secured sufficient capital during the zero-interest-rate era to survive—but have failed to surpass their prior valuations. Collectively, they account for ~$1.4 trillion—or nearly 25%—of current global unicorn market cap.
Caption: Share of “zombie” vs. “active” unicorns among December 2021 cohort
The U.S. and the Bay Area show a much higher proportion of “active” unicorns (those completing new funding rounds since 2021) relative to “zombies.” By contrast, “zombie” concentration is higher in Europe, India, Latin America, and New York.
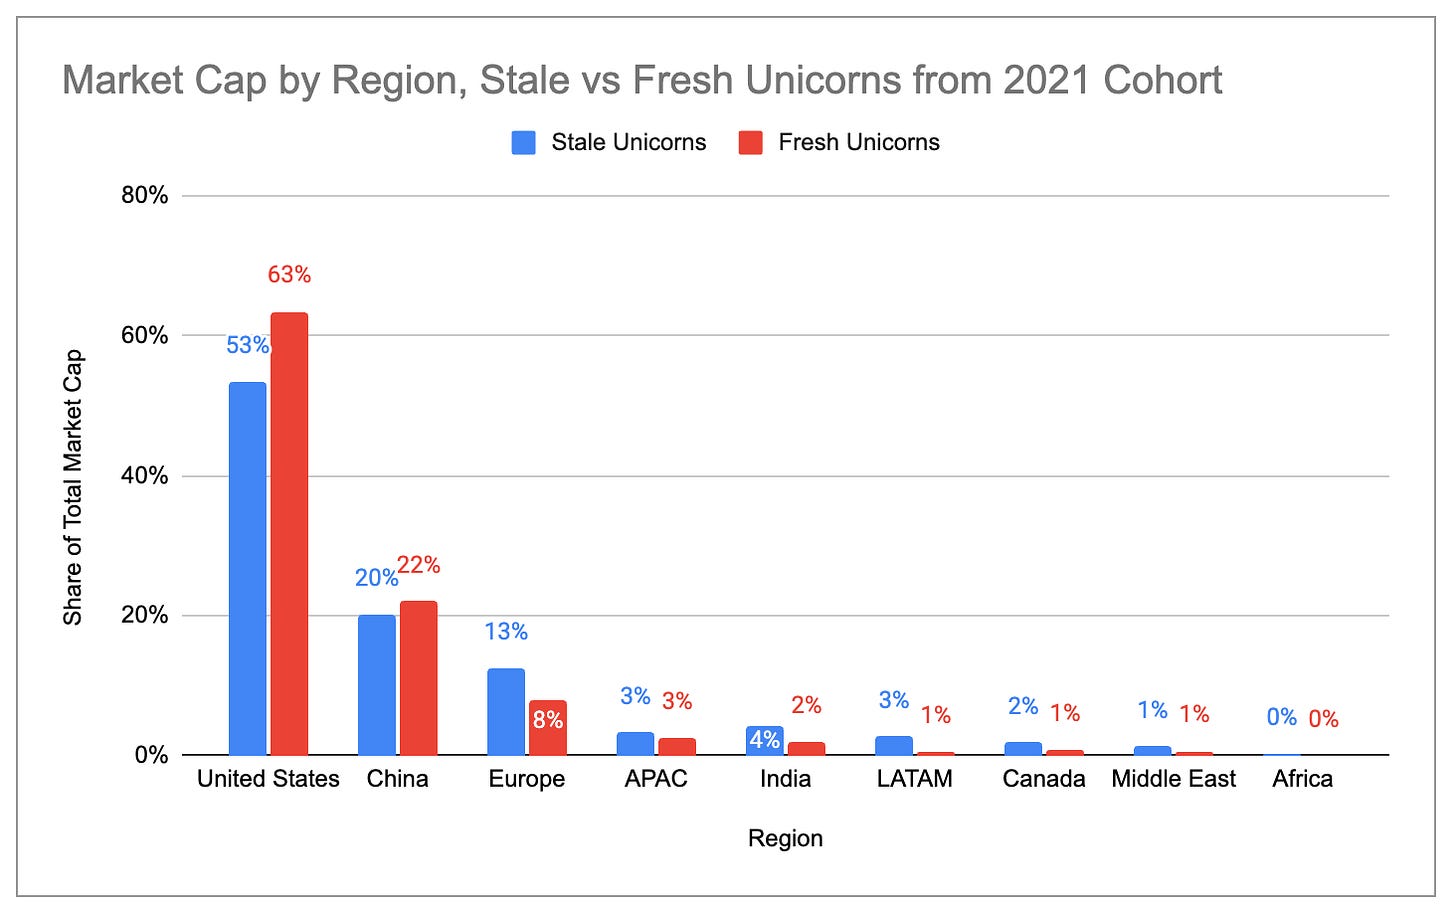
Caption: Distribution of “zombie” vs. “active” unicorn market cap by country
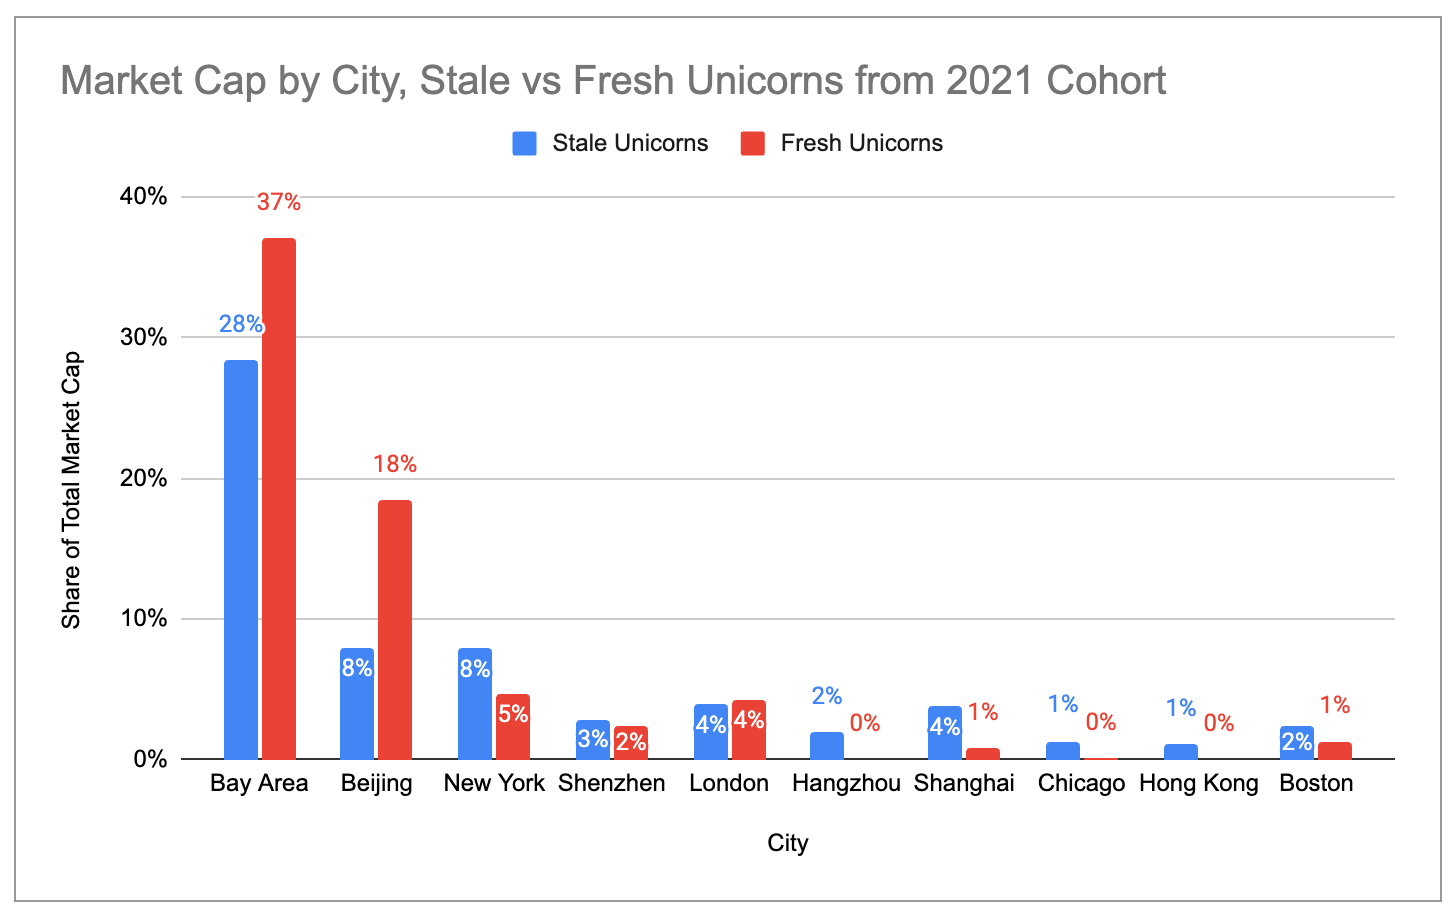
Caption: Distribution of “zombie” vs. “active” unicorn market cap by city
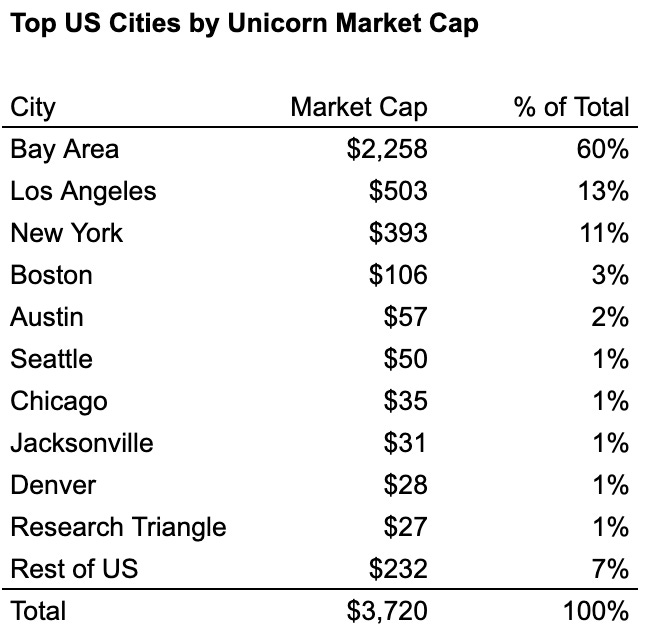
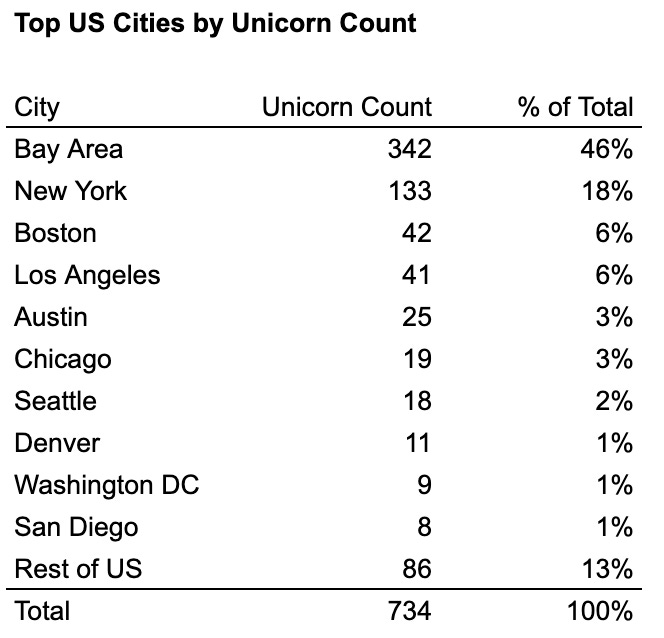
America’s Four Major Unicorn Clusters
Within the U.S., four “industry towns” account for ~76% of all unicorns and ~87% of total unicorn market cap: the Bay Area, New York, Los Angeles, and Boston. The Bay Area is the undisputed leader—its unicorn count is more than double that of the second-ranked city, and its market cap more than four times larger.
Caption: Unicorn count across major U.S. cities
Caption: Unicorn market cap across major U.S. cities
Examining the industry composition of each city’s top ten unicorns reveals clear clustering effects:
- Bay Area = AI Cluster (6 of top 10 are generative AI)
- New York = Fintech/Crypto Cluster (7 of top 10)
- Los Angeles = Defense/Aerospace + Consumer Cluster (3 of top 6 are defense/aerospace; 4 of top 10 are consumer)
- Boston = Relatively balanced, but biotech/healthcare-leaning (3 of top 10)
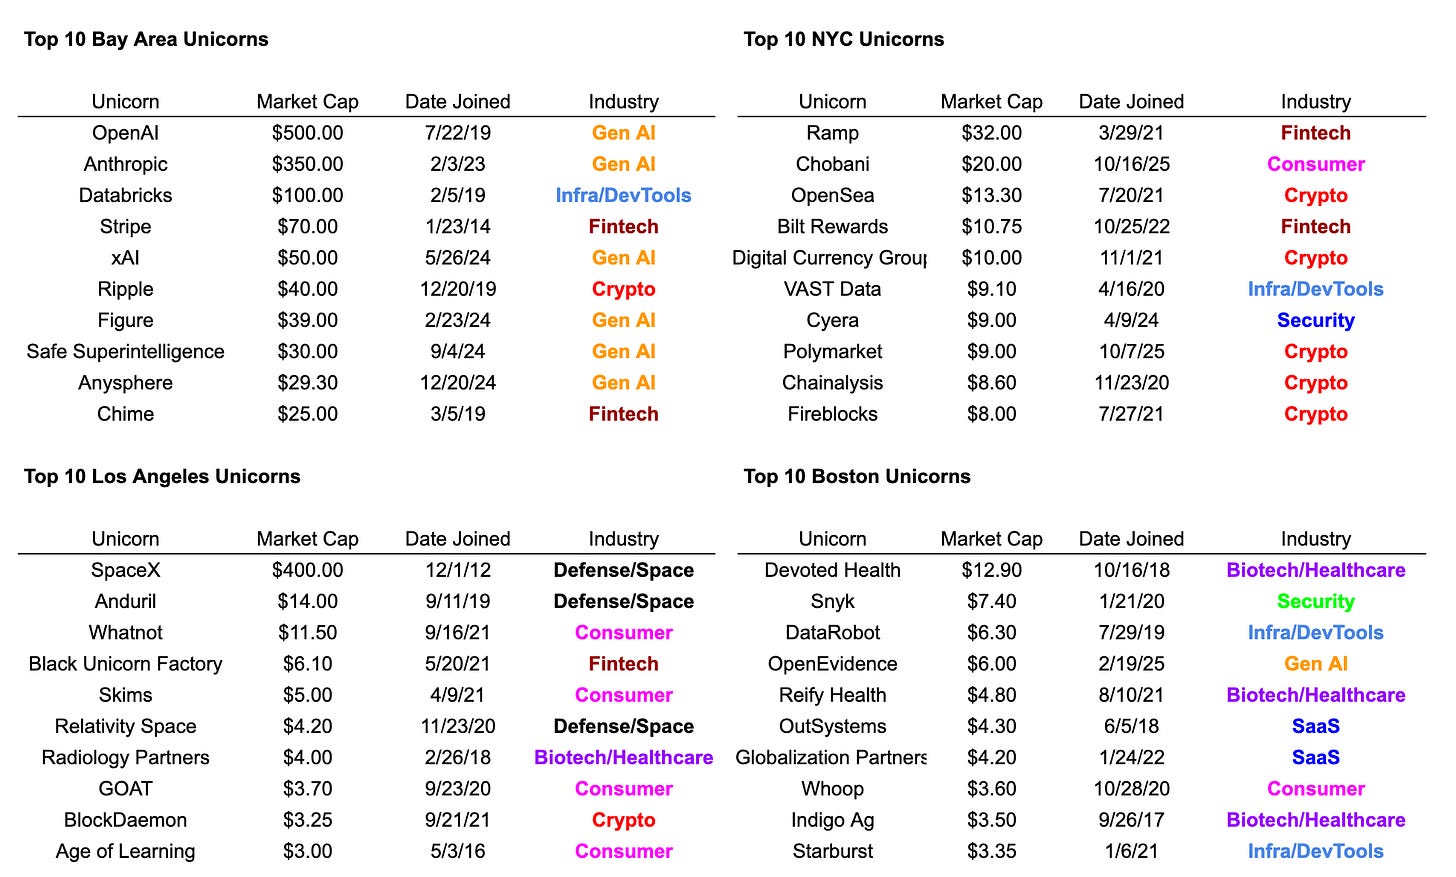
Caption: Industry breakdown of top 10 unicorns in the U.S.’s four major cities
Join TechFlow official community to stay tuned
Telegram:https://t.me/TechFlowDaily
X (Twitter):https://x.com/TechFlowPost
X (Twitter) EN:https://x.com/BlockFlow_News