Tech stock valuations have reverted to pre-AI boom levels! Apollo’s Chief Economist: Forward P/E ratio compressed from 40x to 20x
TechFlow Selected TechFlow Selected
Tech stock valuations have reverted to pre-AI boom levels! Apollo’s Chief Economist: Forward P/E ratio compressed from 40x to 20x
Tech giants are undergoing the most painful valuation repricing since 2022.
Author: Claude, TechFlow
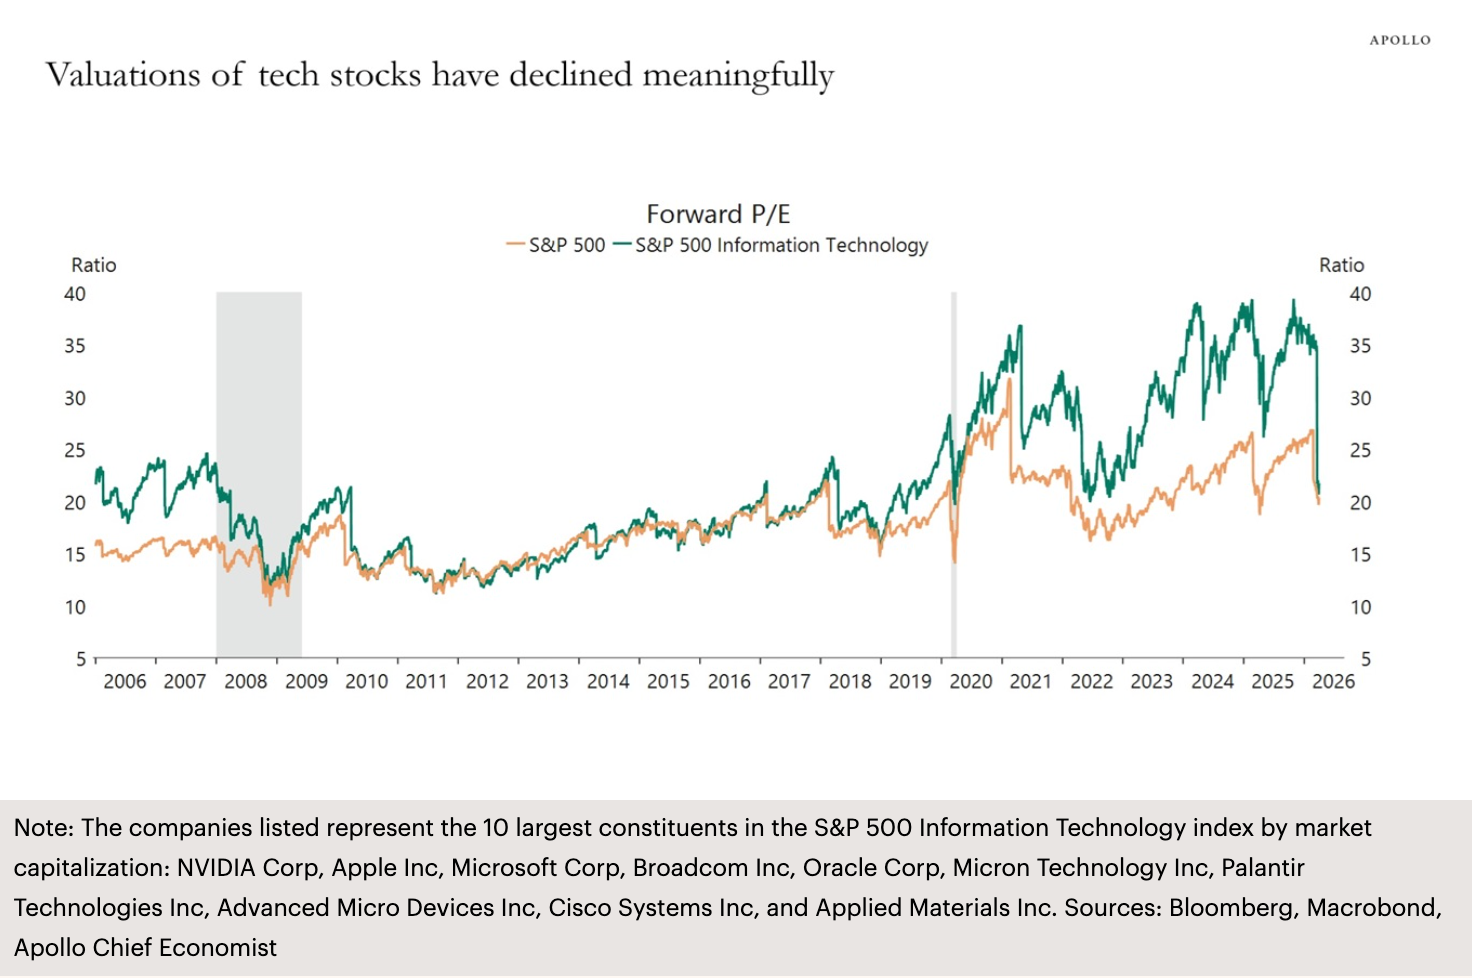
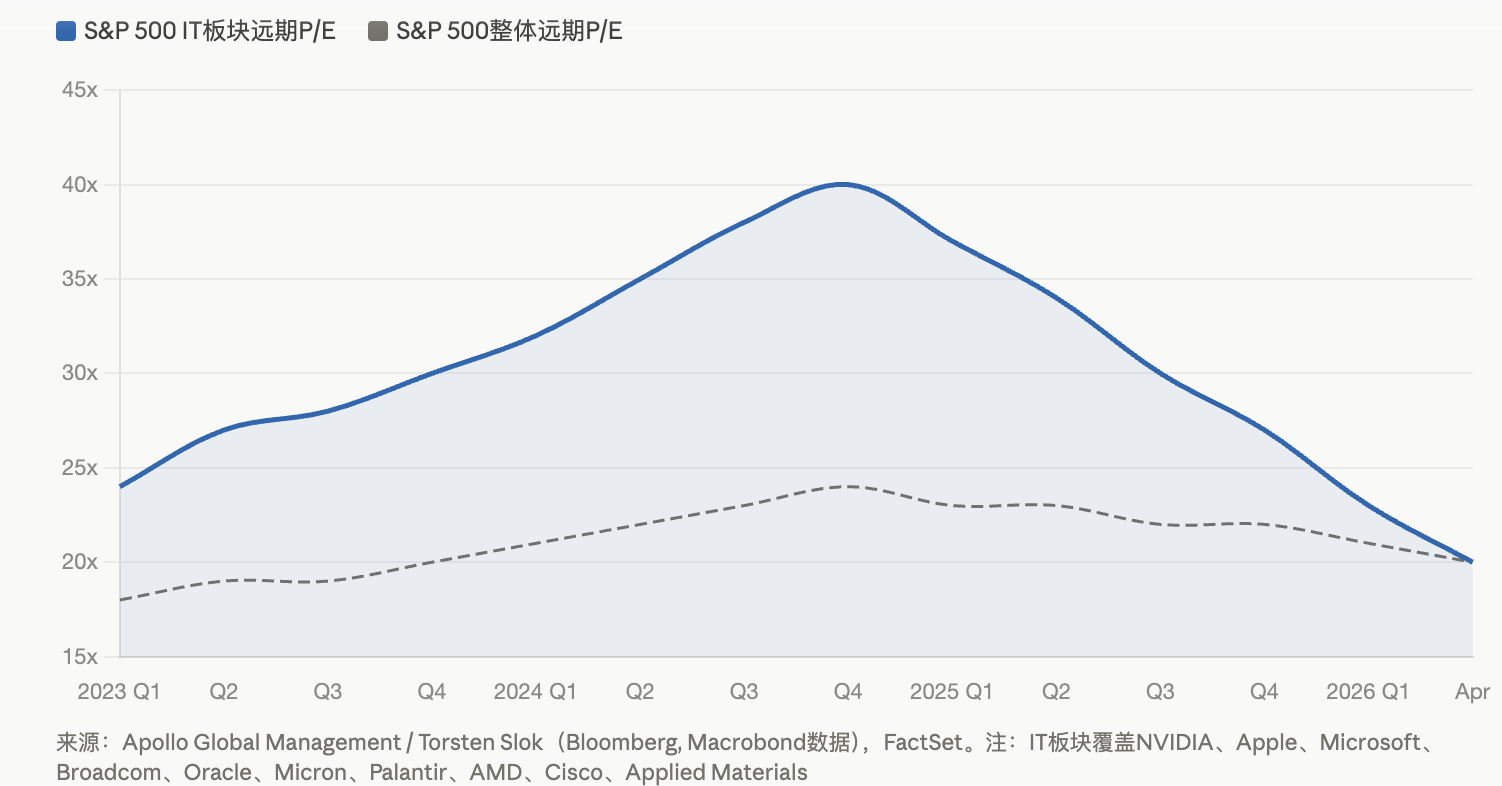
TechFlow Introduction: Torsten Slok, Chief Economist at Apollo Global Management, revealed in his latest chart that the forward P/E ratio of the S&P 500 Information Technology sector has contracted sharply—from roughly 40x at the peak of the AI boom down to approximately 20x—returning to pre-AI-boom valuation levels. A confluence of three pressures—sector rotation triggered by Middle East conflict, doubts over ROI from AI capital expenditures, and slowing earnings growth—is driving the most painful valuation repricing for tech giants since 2022.
The valuation bubble in the S&P 500 Information Technology sector is being rapidly squeezed.
According to Apollo Global Management’s April 11 Daily Spark research note, Torsten Slok—a Partner and Chief Economist at the firm—used a single chart to illustrate the current state of tech stocks: the forward P/E ratio of the S&P 500 Information Technology sector has fallen from a high of ~40x during the AI boom to ~20x, reverting to its pre-AI-boom valuation level.
This chart covers the ten largest constituents of the index by market cap: NVIDIA, Apple, Microsoft, Broadcom, Oracle, Micron, Palantir, AMD, Cisco, and Applied Materials. In other words, the core winners of the AI era have collectively given back their valuation premiums accumulated over the past two-plus years.
Three Pressures Converge: Tech Giants Face Valuation Repricing
This valuation compression is not driven by a single factor but rather stems from the cumulative impact of multiple headwinds.
The Middle East conflict serves as the most immediate catalyst. Since the outbreak of the Iran war, the energy sector surged over 34% in Q1, with ExxonMobil up nearly 42% year-to-date. Capital has flowed massively out of tech stocks and into energy and defensive sectors, making tech the largest net outflow category. The S&P 500 formed a “death cross” (50-day moving average crossing below the 200-day moving average) at the end of March. As of early April, the index hovered around 6,582 points—less than 100 points above the 6,300-point threshold marking the start of a correction zone.
Doubts over ROI from AI capital expenditures constitute the second pressure. According to FactSet data, the S&P 500’s expected Q1 earnings growth stands at 12.6%, with a forward P/E of ~20.4x. Over the past two years, tech giants have deployed massive capital expenditures (Amazon plans $200 billion in 2026; Microsoft, Meta, and others each plan hundreds of billions). Yet AI-related revenue remains far below investment scale. As cited in a CEIBS report, the ~$400 billion in AI capex projected for 2025 would require AI-related annual revenue to reach $160 billion to break even—while actual revenue stood at only ~$15–20 billion at the time.
Slowing earnings growth forms the third pressure. According to Bloomberg Intelligence, the “Magnificent Seven” are expected to post ~18% earnings growth in 2026—the lowest since 2022—and the gap relative to the remaining 493 S&P 500 companies (expected to grow ~13%) is narrowing. David Lefkowitz, Head of U.S. Equity Strategy at UBS Global Wealth Management, noted as early as January this year that earnings growth diffusion is underway, and tech is no longer the sole protagonist.
NVIDIA at 21x, Microsoft Down 23%: Growing Divergence Among Majors
Valuation compression manifests even more dramatically at the individual stock level.
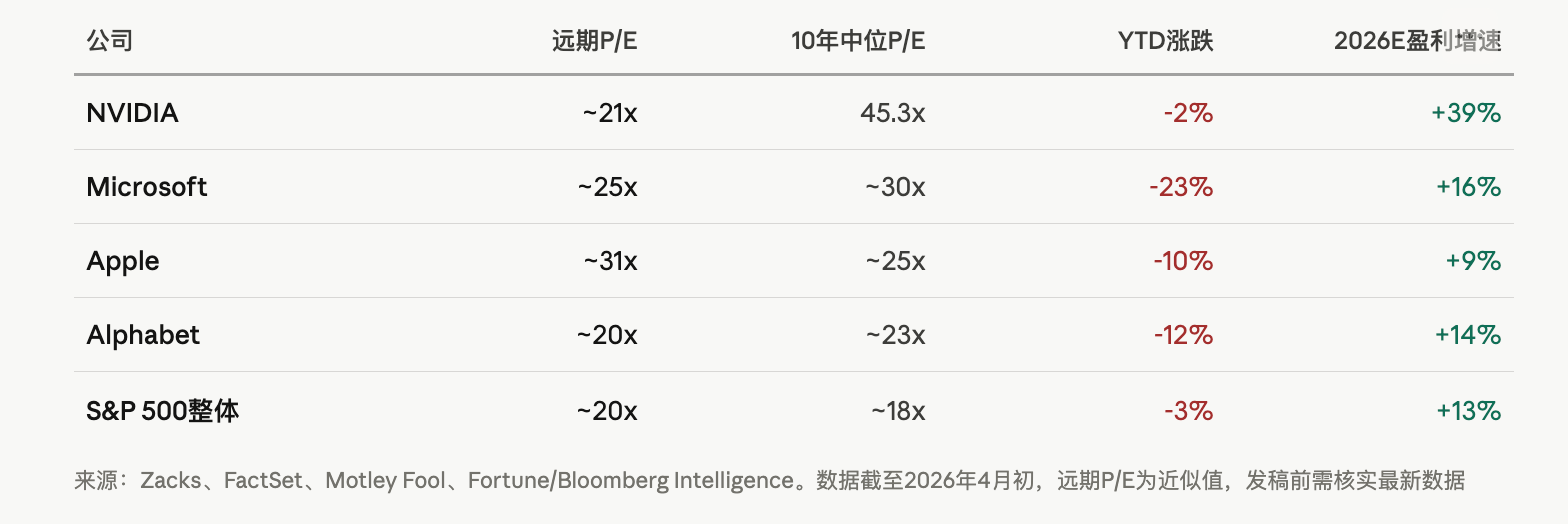
Per Zacks analysis, NVIDIA’s forward P/E has dropped to ~21.4x—well below its 10-year median of 45.3x—even though its projected 3–5-year annual earnings growth remains robust at 39.1%. Microsoft is down ~23% year-to-date, with its market cap falling below $3 trillion after briefly surpassing $4 trillion in October last year. Apple has been relatively stable among the Magnificent Seven, partly due to its significantly lower AI-related capex versus peers and its aggressive share buybacks—$24.7 billion repurchased in one quarter—earning it a premium amid market punishment of profligate spenders.
Insider activity may tell an even more telling story. Per Motley Fool’s citation of SEC Form 4 data, corporate insiders at NVIDIA, Apple, Alphabet, Microsoft, and Amazon collectively net-sold ~$16.1 billion worth of shares over the past two years, ending April 2. Although most sales relate to tax-driven compensation settlements, the absence of meaningful insider buying amid such large-scale net selling unsettles markets.
Debate Over AI Bubble Intensifies—but Key Differences from the 2000 Dot-com Bubble Remain
With tech valuations returning to pre-AI levels, does this signal a bursting of the AI bubble?
Opinions among institutions diverge sharply. BlackRock’s tech sector report notes that the S&P 500 Information Technology Index’s forward P/E stood at ~30x in October 2025—elevated historically, yet still well below the Nasdaq-100’s ~60x peak during the dot-com bubble. BlackRock emphasizes that today’s valuations reflect real revenue, proven business models, and accelerating AI adoption—fundamentally distinct from 2000.
A prior Goldman Sachs report similarly observed that while implied long-term dividend growth rates embedded in current prices are unusually high, they remain below the extremes seen during both the dot-com bubble and the 1960s “Nifty Fifty” era.
Yet warning signs are equally evident. According to The Globe and Mail, the S&P 500’s Shiller P/E entered its second-highest valuation band in 155 years at the start of this year. Historically, the two instances when the Shiller P/E breached 40x—the dot-com bubble and January 2022—were followed by S&P 500 declines of 49% and 25%, respectively.
Zacks analysts adopt a more pragmatic view: falling stock prices alongside rising earnings expectations have led to passive P/E compression, improving risk-reward profiles for some names. NVIDIA is viewed as the best-matched growth-and-valuation play at current levels, while Microsoft is seen as offering potential for a “catch-up rebound.”
For investors, the critical question is not whether AI holds value—but whether today’s massive capex can translate into profit returns commensurate with valuations within a reasonable timeframe. If 2026 marks the cyclical peak of hyperscale customer capex, then—even as the underlying technology continues to advance—the ROI cycle for AI infrastructure investment may vastly exceed market patience.
Join TechFlow official community to stay tuned
Telegram:https://t.me/TechFlowDaily
X (Twitter):https://x.com/TechFlowPost
X (Twitter) EN:https://x.com/BlockFlow_News