After five consecutive weeks of outflows totaling $3.8 billion, Bitcoin ETFs suddenly reversed—what will determine the next move?
TechFlow Selected TechFlow Selected
After five consecutive weeks of outflows totaling $3.8 billion, Bitcoin ETFs suddenly reversed—what will determine the next move?
The key shift is that the market is no longer facing one-way, continuous ETF outflows; it is now testing whether the institutional demand engine is restarting.
Author: CryptoSlate
Translated by TechFlow
TechFlow Intro: This article clarifies an easily overlooked structural issue: Bitcoin ETFs are not a floor—they are conditional buyers. A $3.8 billion net outflow over five weeks is not merely an unattractive number; it signals that the historically most stable institutional gateway has quietly shut—precisely when tariff-related uncertainty peaked. Data reversed after February 20—but is this reversal a genuine signal or merely tactical maneuvering? The author outlines three possible paths and four key indicators—well worth reading carefully.
Full Text Below:
Bitcoin ETFs have just experienced their longest consecutive net outflow period since the start of 2025. Rising uncertainty around tariff policy is roiling interest rates and equity markets—and this outflow cycle is especially significant because it alters Bitcoin’s support structure under stress.
For nearly two years, spot Bitcoin ETFs have functioned almost as a one-way conduit. They liberated Bitcoin from private keys and operational complexity, transforming it into code compatible with any conventional investment portfolio. Capital flowed in, shares were created, and Bitcoin gained a steady, compliant source of demand.
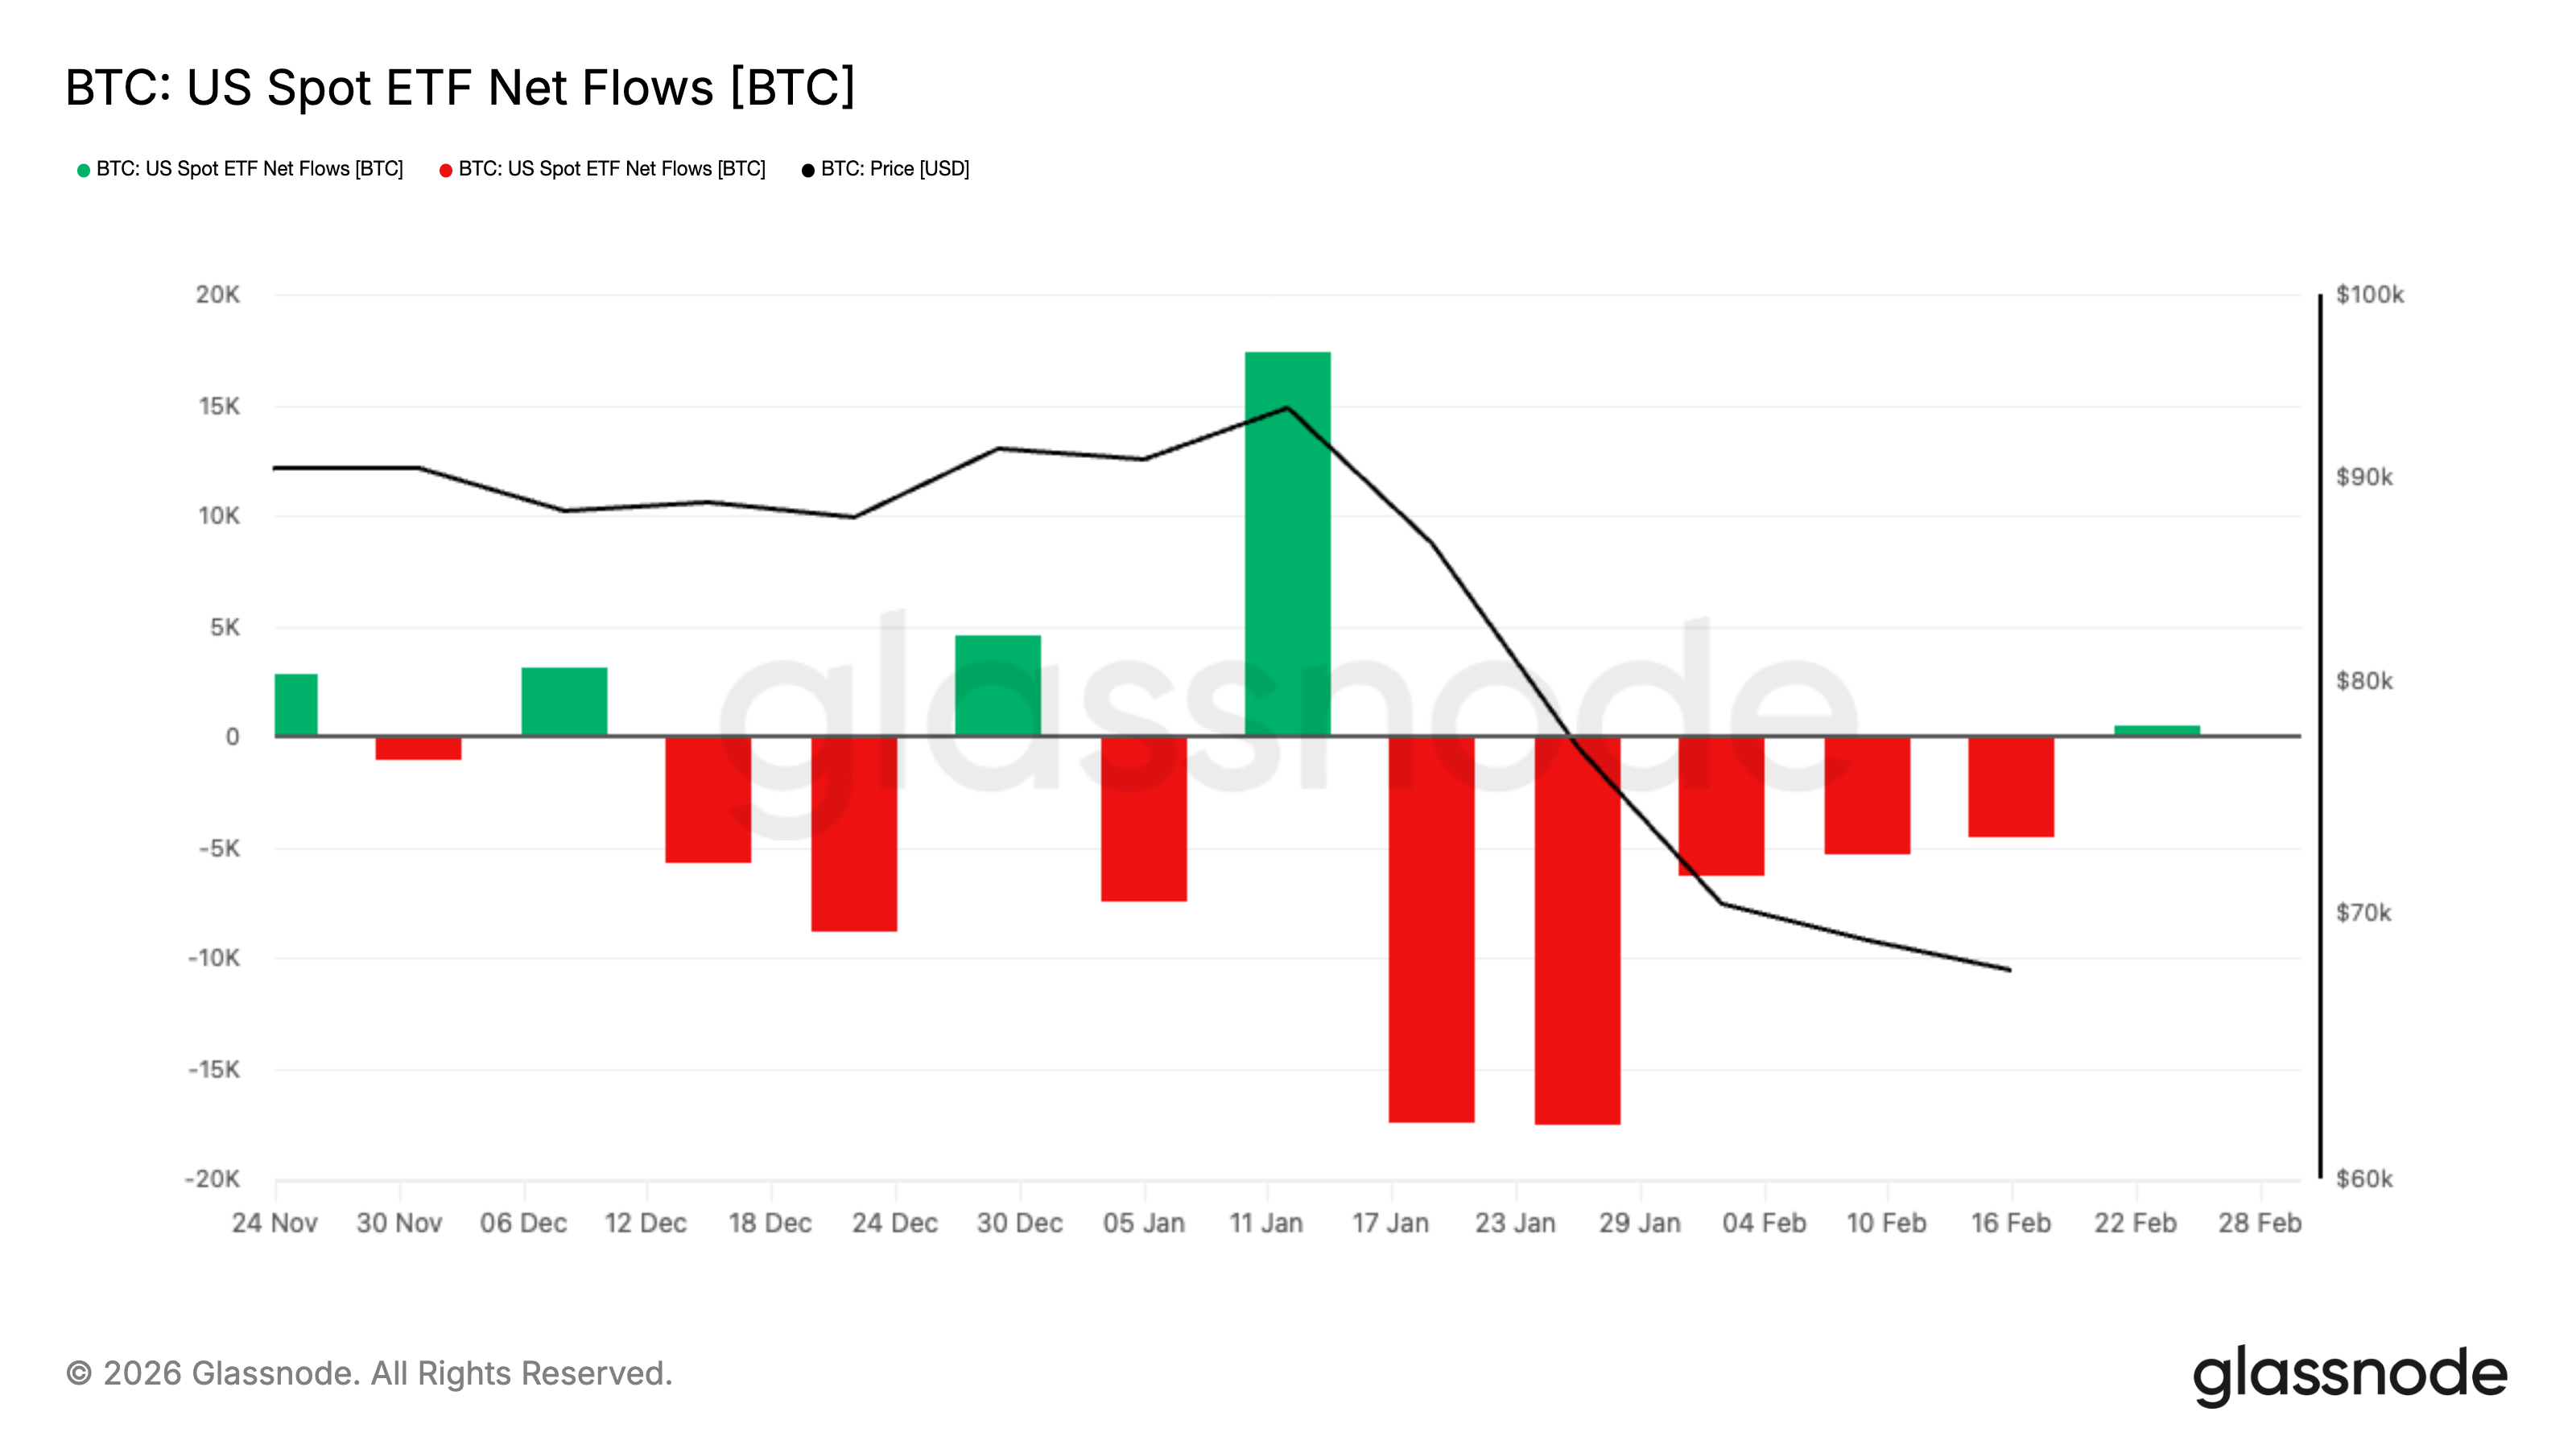
In the five consecutive weeks leading up to the end of February, investors withdrew approximately $3.8 billion from U.S.-listed spot Bitcoin ETFs—the longest weekly net outflow streak since the beginning of 2025. Bitcoin held mostly above $60,000 during this period and recently traded near $68,000, as markets attempt to regain equilibrium.
The scale of this outflow is striking in itself—but timing matters even more. The outflow coincided precisely with tariff-policy uncertainty seeping into interest rates, equities, and commodities, once again injecting volatility into the broader macro environment.
Yet starting February 20, fund flows—at least temporarily—shifted direction.
From February 20 to 27, U.S.-listed spot Bitcoin ETFs recorded approximately $875.5 million in net inflows, including strong share creation on multiple consecutive days. This is insufficient to offset the prior five-week hemorrhage—but it does complicate the narrative.
What initially appeared to be a straightforward de-risking cycle may now be evolving into a reset: institutional demand is cautiously re-emerging—even while macro uncertainty persists.
What Exactly Have ETFs Done to the Bitcoin Market?
Spot ETFs operate via share creation and redemption mechanisms. When demand for ETF shares rises, authorized participants create new shares by depositing underlying assets into the fund. When demand wanes and shares are redeemed, the mechanism contracts in reverse. Behind the scenes, this links equity-market trading activity to Bitcoin exposure—which is why ETF fund flows serve as Bitcoin’s daily scoreboard.
The SEC approved rules permitting physical creation and redemption of shares for certain crypto ETPs, meaning authorized participants can exchange underlying assets directly for shares—bypassing cash entirely. The SEC emphasized efficiency and cost reduction in its rationale.
Yet even if cash-based execution remains dominant in practice, the core logic holds: ETF fund flows represent one of the cleanest bridges between institutions and the Bitcoin market.
A useful framework:
On net-inflow days, ETF assets expand, shares are created, and exposure grows. Markets sense a buyer who appears without requiring daily new catalysts.
On net-outflow days, ETF assets shrink, shares are redeemed, and exposure contracts. Markets lose that default buyer—and simultaneously absorb additional selling pressure.
How Is a Five-Week Consecutive Outflow Different From a Single Large Outflow?
The cumulative $3.8 billion withdrawal over five weeks sets a record for duration among recent cycles. Such an extended streak of weekly net outflows has not occurred since the start of 2025. The macro backdrop adds further weight.
Trade policy is once again influencing crypto markets. Tariff uncertainty creates a headline-driven environment where sudden repricing of one asset rapidly spills over to others.
In such conditions, portfolios are managed more conservatively. As volatility rises, portfolio managers swiftly cut positions they can liquidate quickly—triggering a negative feedback loop that further depresses prices and intensifies outflows. They may later reassess the assets they sold—but that offers no relief during the outflow itself.
Whether acknowledged or not, Bitcoin sits squarely in the “quick-to-cut” bucket—and ETF flows are among the first places this decision manifests.
Another contrast looming over this period is gold. Gold has benefited from safe-haven demand amid tariff uncertainty; recent USD weakness and geopolitical risks only amplify this demand.
That doesn’t mean Bitcoin has failed in this cycle. Markets are clearly categorizing assets behaviorally—and Bitcoin is trading more like risk exposure than a safe haven.
When ETF Buying Stops, Who Steps In?
To understand this, set aside grand narratives and ask just one question:
When Bitcoin drops 3% in a single day—who shows up as a buyer without needing persuasion?
In 2024, ETFs gave the market a clear answer: net inflows represented default demand. It required no leverage, no memes, no perfect sentiment—only a committee decision and broker execution.
But when this channel narrows, two concrete things happen.
First, declines feel lonelier.
Without sustained ETF net inflows, price discovery relies more heavily on active spot buyers—and liquidity providers who require higher compensation to take the opposite side. That’s why pullbacks feel sharper and rebounds more hesitant—even when news flow isn’t particularly dramatic.
Second, net outflows exert real market force.
Redemptions aren’t reflections of market sentiment—they’re mechanical contractions of institutional positions. Depending on product structure and participant hedging strategies, redemptions may translate into actual Bitcoin sales, hedge adjustments, or basis position unwinds.
The external result is identical: reduced support, increased supply, weaker rebounds.
We can attribute Bitcoin’s poor performance to a broad cooling of U.S. institutional participation—and note that ETF net outflows and lighter overall positioning across regulated venues have exacerbated this dynamic. You may disagree with the tone of that characterization, but it aligns with what the ETF data shows.
This dispels a misconception: ETFs are Bitcoin’s floor. A floor requires a consistently buying participant. A buyer who exits for five straight weeks is, by definition, a conditional buyer.
What Should You Watch?
To fully grasp the implications, monitor four signals—and know what each means.
Track weekly net flow data. A single week turning positive is a pulse; two or three consecutive weeks signal a reopening of the channel. Sustained weekly positivity suggests institutional capital pipelines are re-opening. A renewed slide into persistent negativity would make rallies feel like climbing without handrails—because the cleanest institutional funding conduit remains contracted.
Watch Bitcoin’s performance on macro-negative days. In tariff-driven markets, equities swing on headlines, rates reprice, and volatility spikes. At such times, Bitcoin either trades like a scarce asset—or like risk beta.
Watch whether price rises without ETF net inflows. If Bitcoin begins trending upward while ETF flows remain flat or even negative, another class of buyer has stepped in. Sometimes it’s derivatives position resets; sometimes it’s a return of native crypto spot demand. Either way, it marks the moment Bitcoin stops relying solely on ETFs.
Watch the shape of outflows. A slow drip differs fundamentally from a sudden surge. A slow drip reflects position trimming; a sudden surge typically signals forced selling or rapid de-risking.
None of these predict price—but they tell you whether the market’s largest demand engine is running, idling, or reversing.
What Comes Next?
The answer is no longer unidirectional—as it was just a week ago.
The five-week, $3.8 billion net outflow marks a clear contraction in institutional positioning. Yet data since February 20 introduces a new variable: roughly $875.5 million in net inflows within just over a week.
This doesn’t negate the earlier de-risking—but it does indicate the institutional capital pipeline isn’t broken. It may simply have undergone a stress test.
Now there are three realistic paths forward.
Path One: Confirmation. If net inflows persist for multiple weeks and begin accumulating steadily, the five-week outflow looks more like a position reset—not a structural exit. In this scenario, ETFs resume functioning as stable allocation vehicles; Bitcoin performs better under macro stress; and recent volatility is re-characterized as noise-driven consolidation—not demand collapse.
Path Two: Fragility. A brief inflow rebound followed by renewed net outflows suggests last week’s share creation was tactical—not strategic: fast money reacting to price levels, not long-term capital rebuilding positions. In that case, rallies may continue feeling heavy—especially in a macro environment where portfolio managers rapidly cut risk in response to tariff sensitivity.
Path Three: Stability Without Acceleration. Flows stabilize near zero, extremes fade, Bitcoin trades in a compressed range—and positions rebuild quietly. This sideways repair may lack drama—but it’s often more constructive, as it removes forced flows from the equation and allows price discovery to normalize.
The critical shift is this: markets no longer face unidirectional, ongoing ETF outflows. They’re now testing whether the institutional demand engine is restarting.
The $3.8 billion outflow grabs attention—but today’s more important question is: Have marginal buyers returned? And are those buyers early-positioners rebuilding allocations—or merely traders standing where they believe a floor exists?
ETF flows don’t predict price. But they will keep revealing whether Bitcoin’s cleanest institutional buying is expanding, idling, or slipping back into reversal. That pipeline matters most when macro uncertainty reignites market volatility.
Join TechFlow official community to stay tuned
Telegram:https://t.me/TechFlowDaily
X (Twitter):https://x.com/TechFlowPost
X (Twitter) EN:https://x.com/BlockFlow_News