Market Unshaken by Nearly $10 Billion in Selling Pressure, Is Bitcoin Heading to $140,000?
TechFlow Selected TechFlow Selected
Market Unshaken by Nearly $10 Billion in Selling Pressure, Is Bitcoin Heading to $140,000?
Bitcoin holders' unrealized profits recently hit a record high of $1.4 trillion, with 140,000 emerging as a key price level for large whales to take profits.
 Navigating Web3 tides with focused insights
Author: UkuriaOC, CryptoVizArt, Glassnode
Translation: AididiaoJP, Foresight News
Last weekend, Bitcoin's liquidity faced a significant test as an early investor sold over 80,000 BTC through Galaxy Digital’s OTC trading service. Despite this, the market demonstrated strong resilience, with the vast majority of investors choosing to hold rather than realize their paper profits.
Executive Summary
Last weekend, Bitcoin’s liquidity faced a severe challenge when a major early investor offloaded more than 80,000 BTC via Galaxy Digital’s OTC service. Although this $9.6 billion sell-off pressured upward price momentum, the market swiftly absorbed the massive selling pressure. Price briefly dipped to $115,000 before quickly stabilizing at $119,000, slightly below its all-time high.
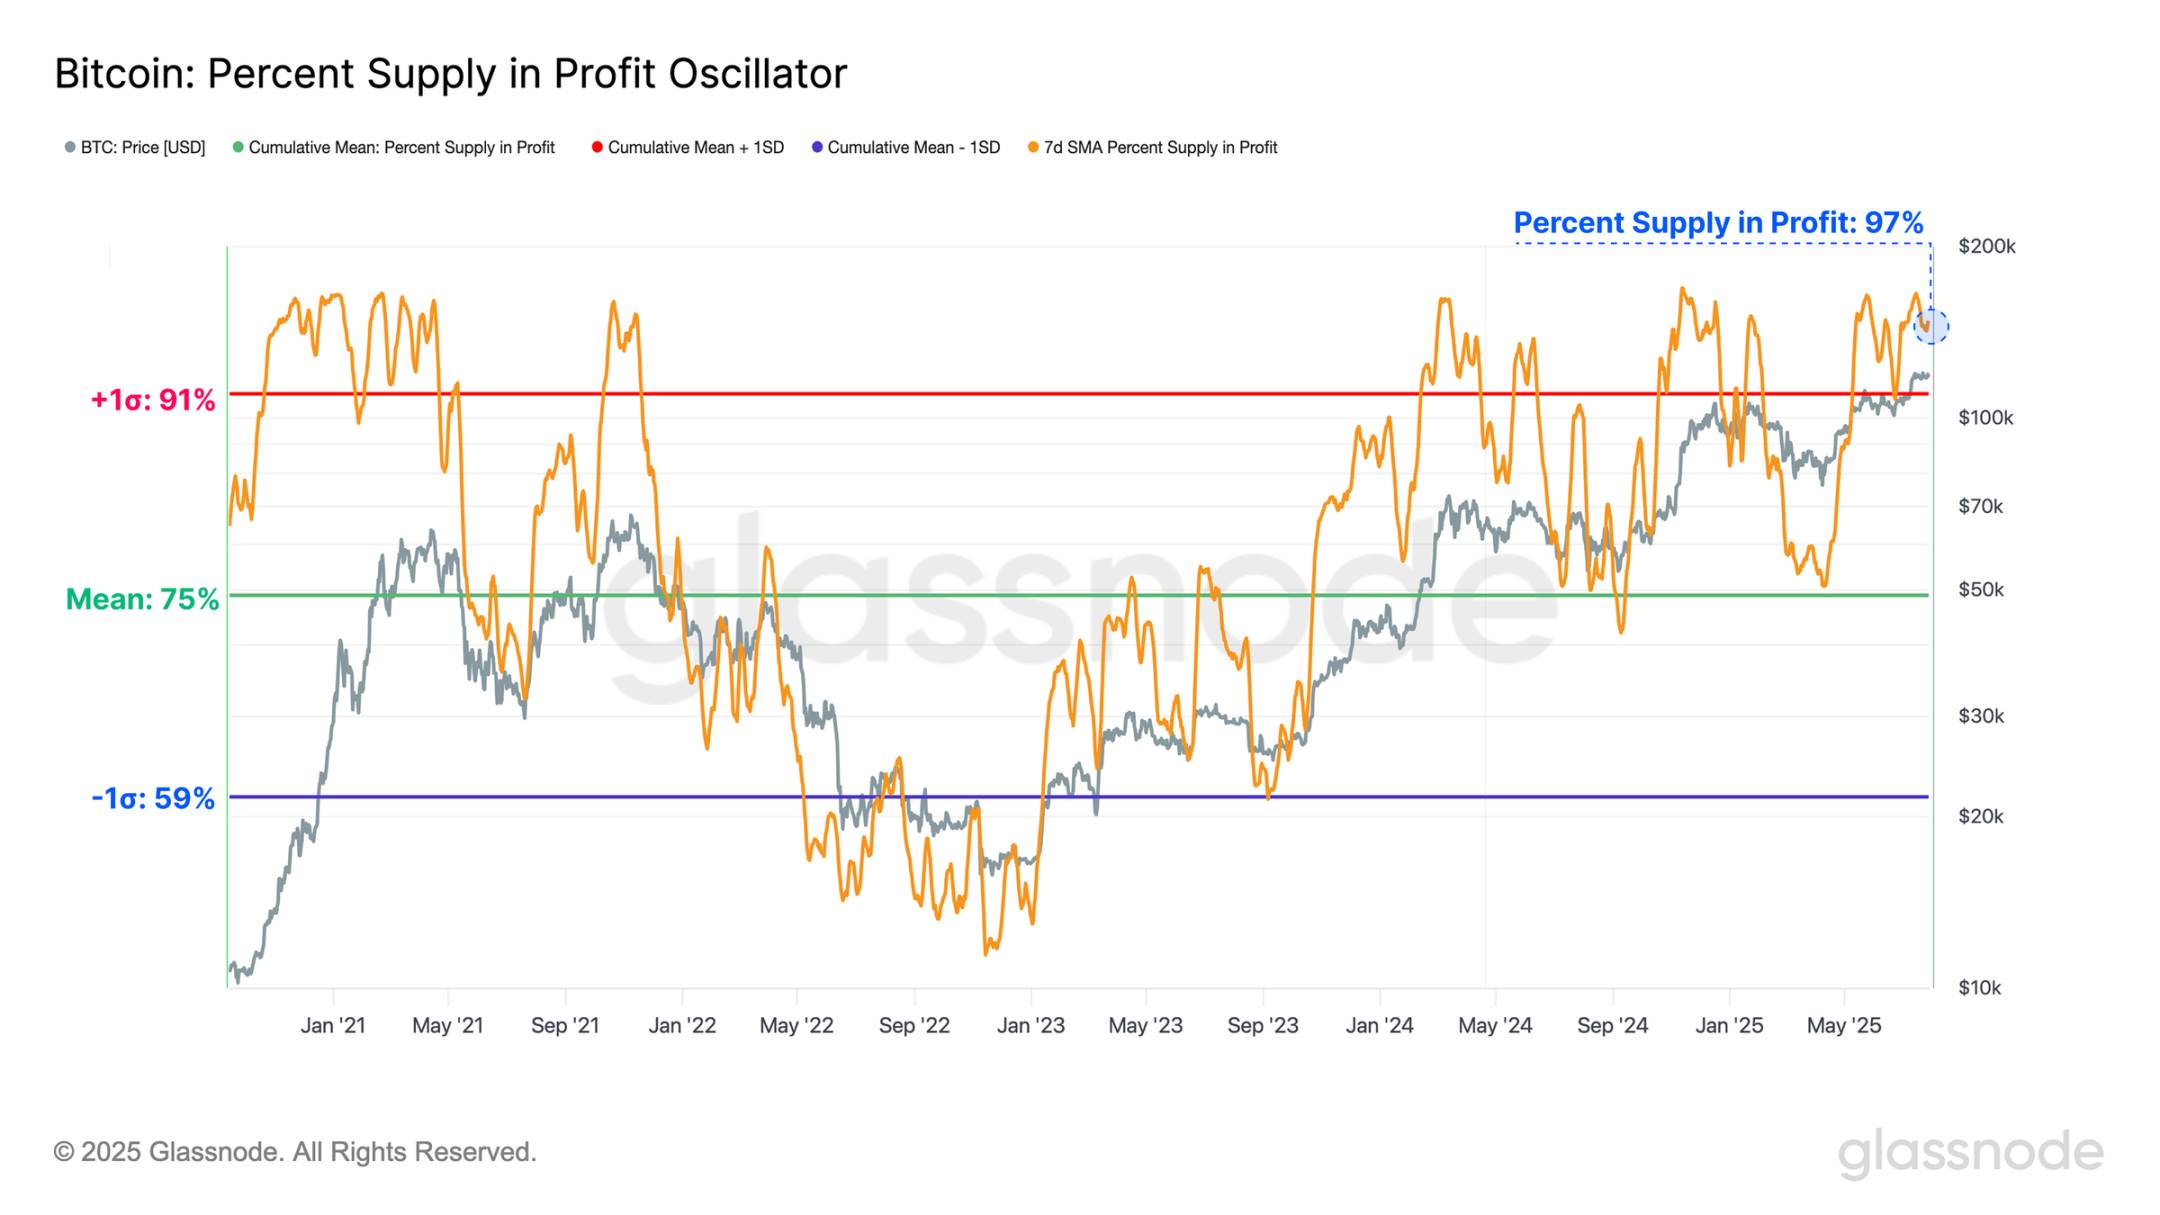
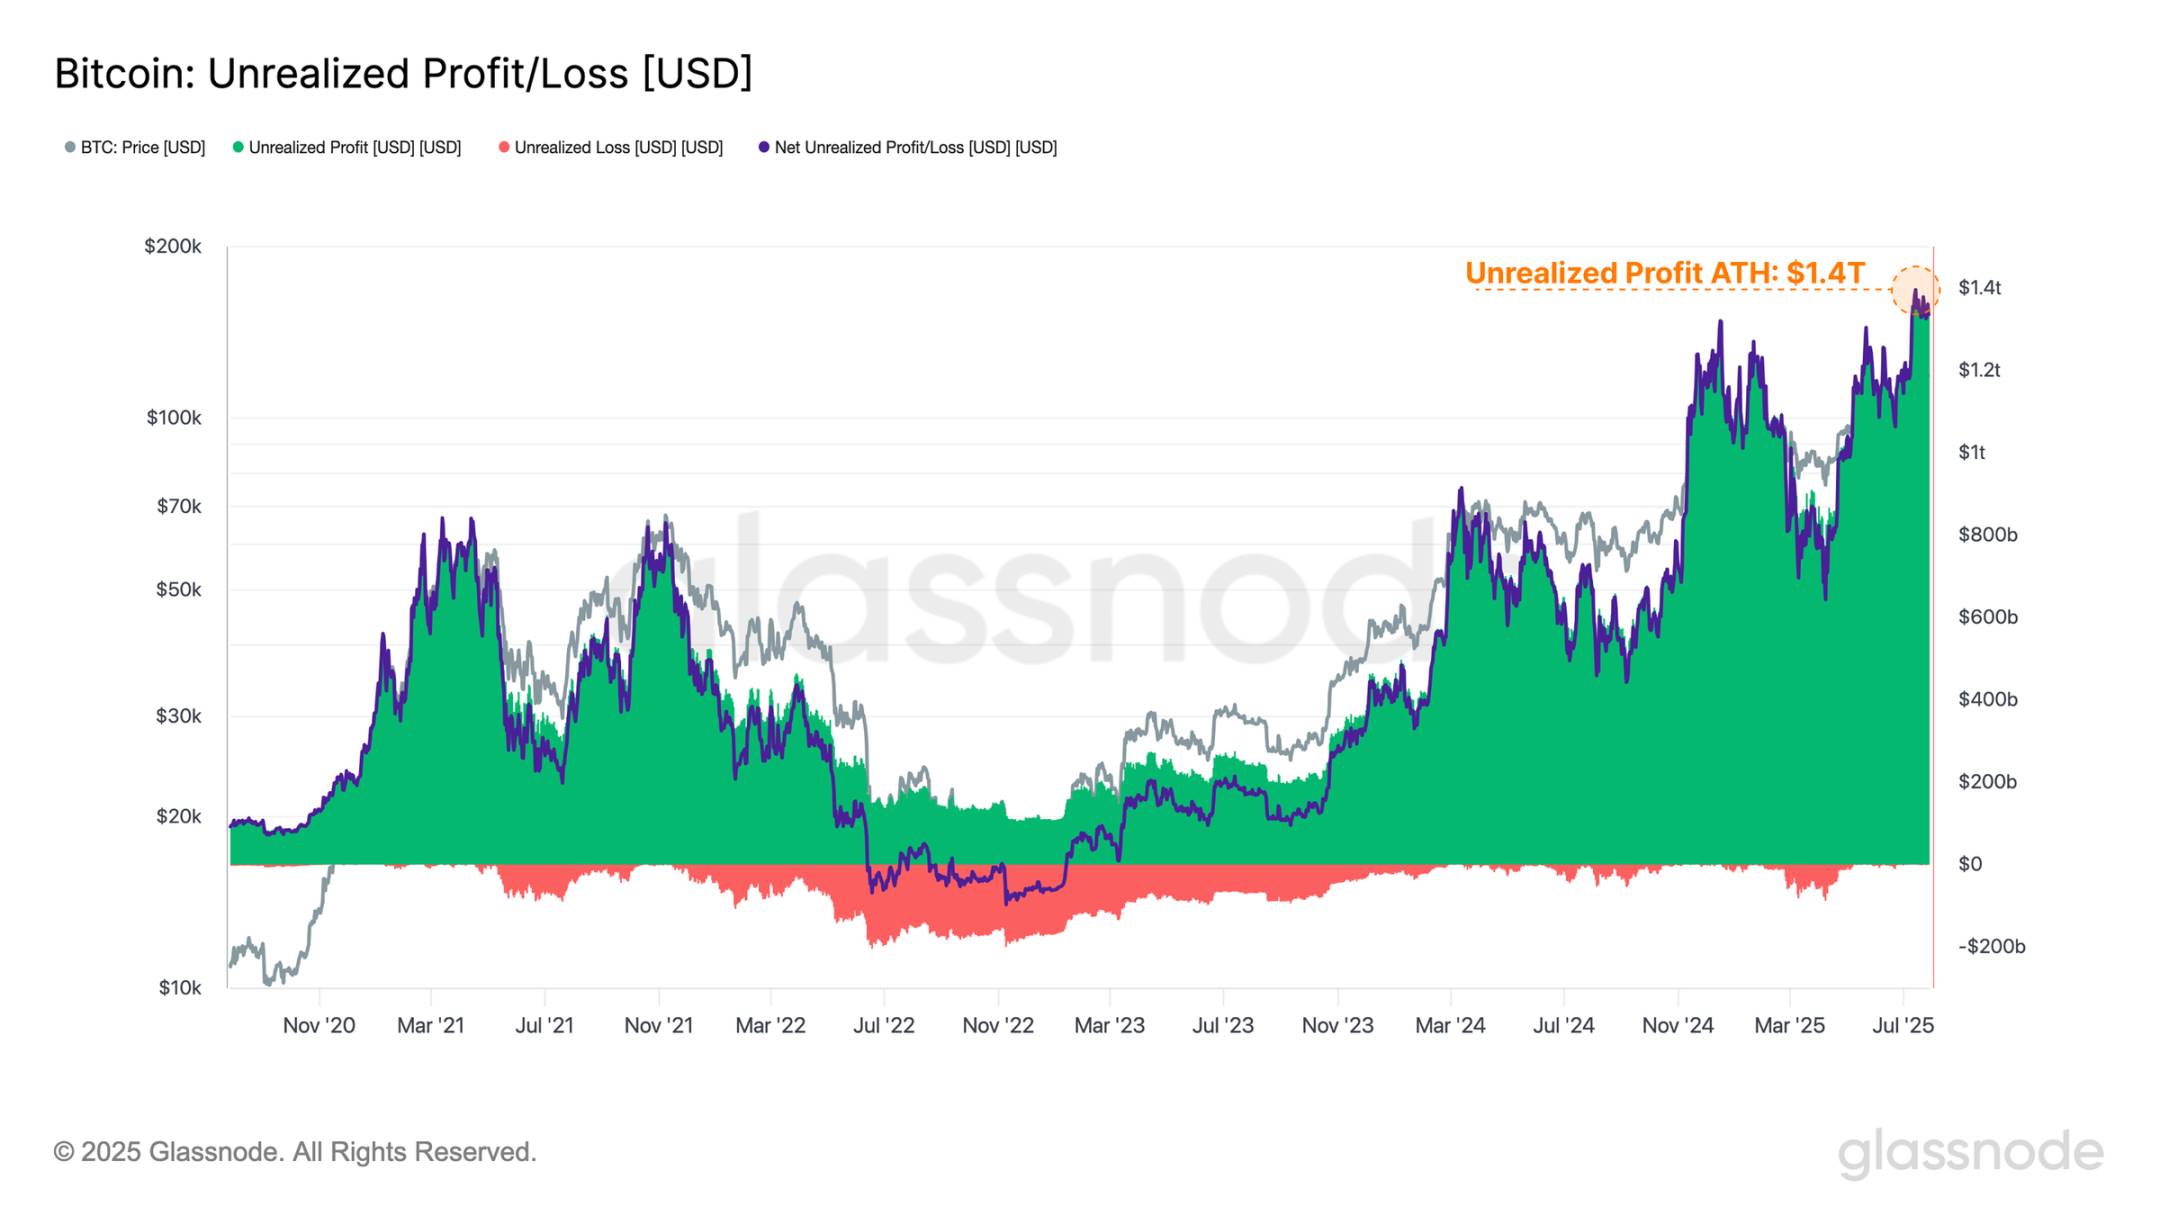
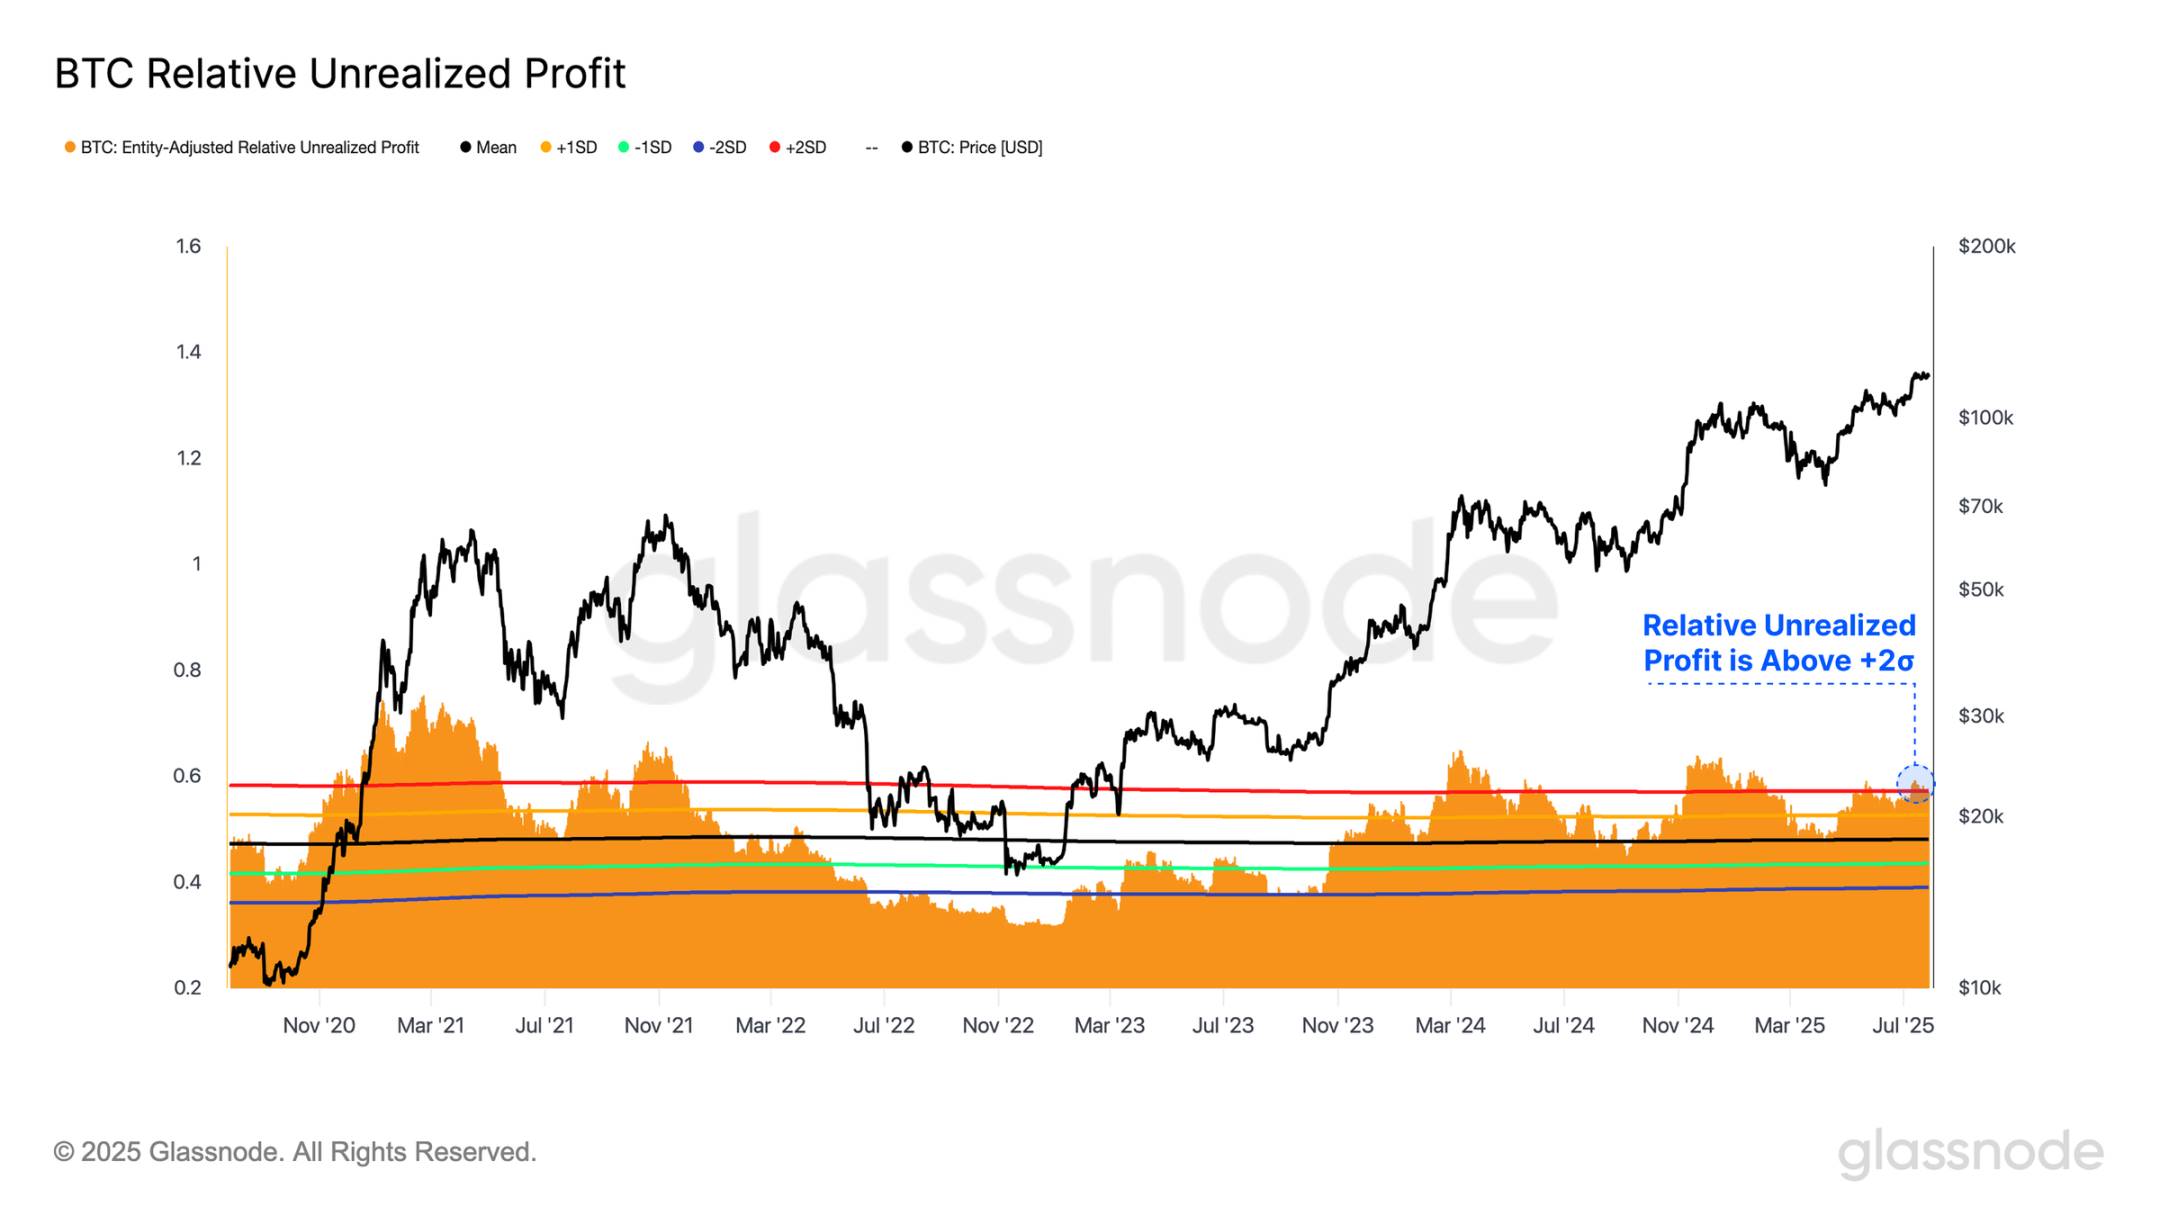
Even after such a large-scale selling event, the scale of unrealized profit held by market participants remains substantial. The total unrealized profit currently stands at $1.4 trillion, with 97% of the circulating supply still in a profitable state.
Multiple on-chain valuation models indicate that Bitcoin is currently consolidating between $105,000 and $125,000. A decisive breakout could push prices higher toward $141,000, where significant selling pressure is expected due to the anticipated realization of large unrealized profits.
Deep Liquidity
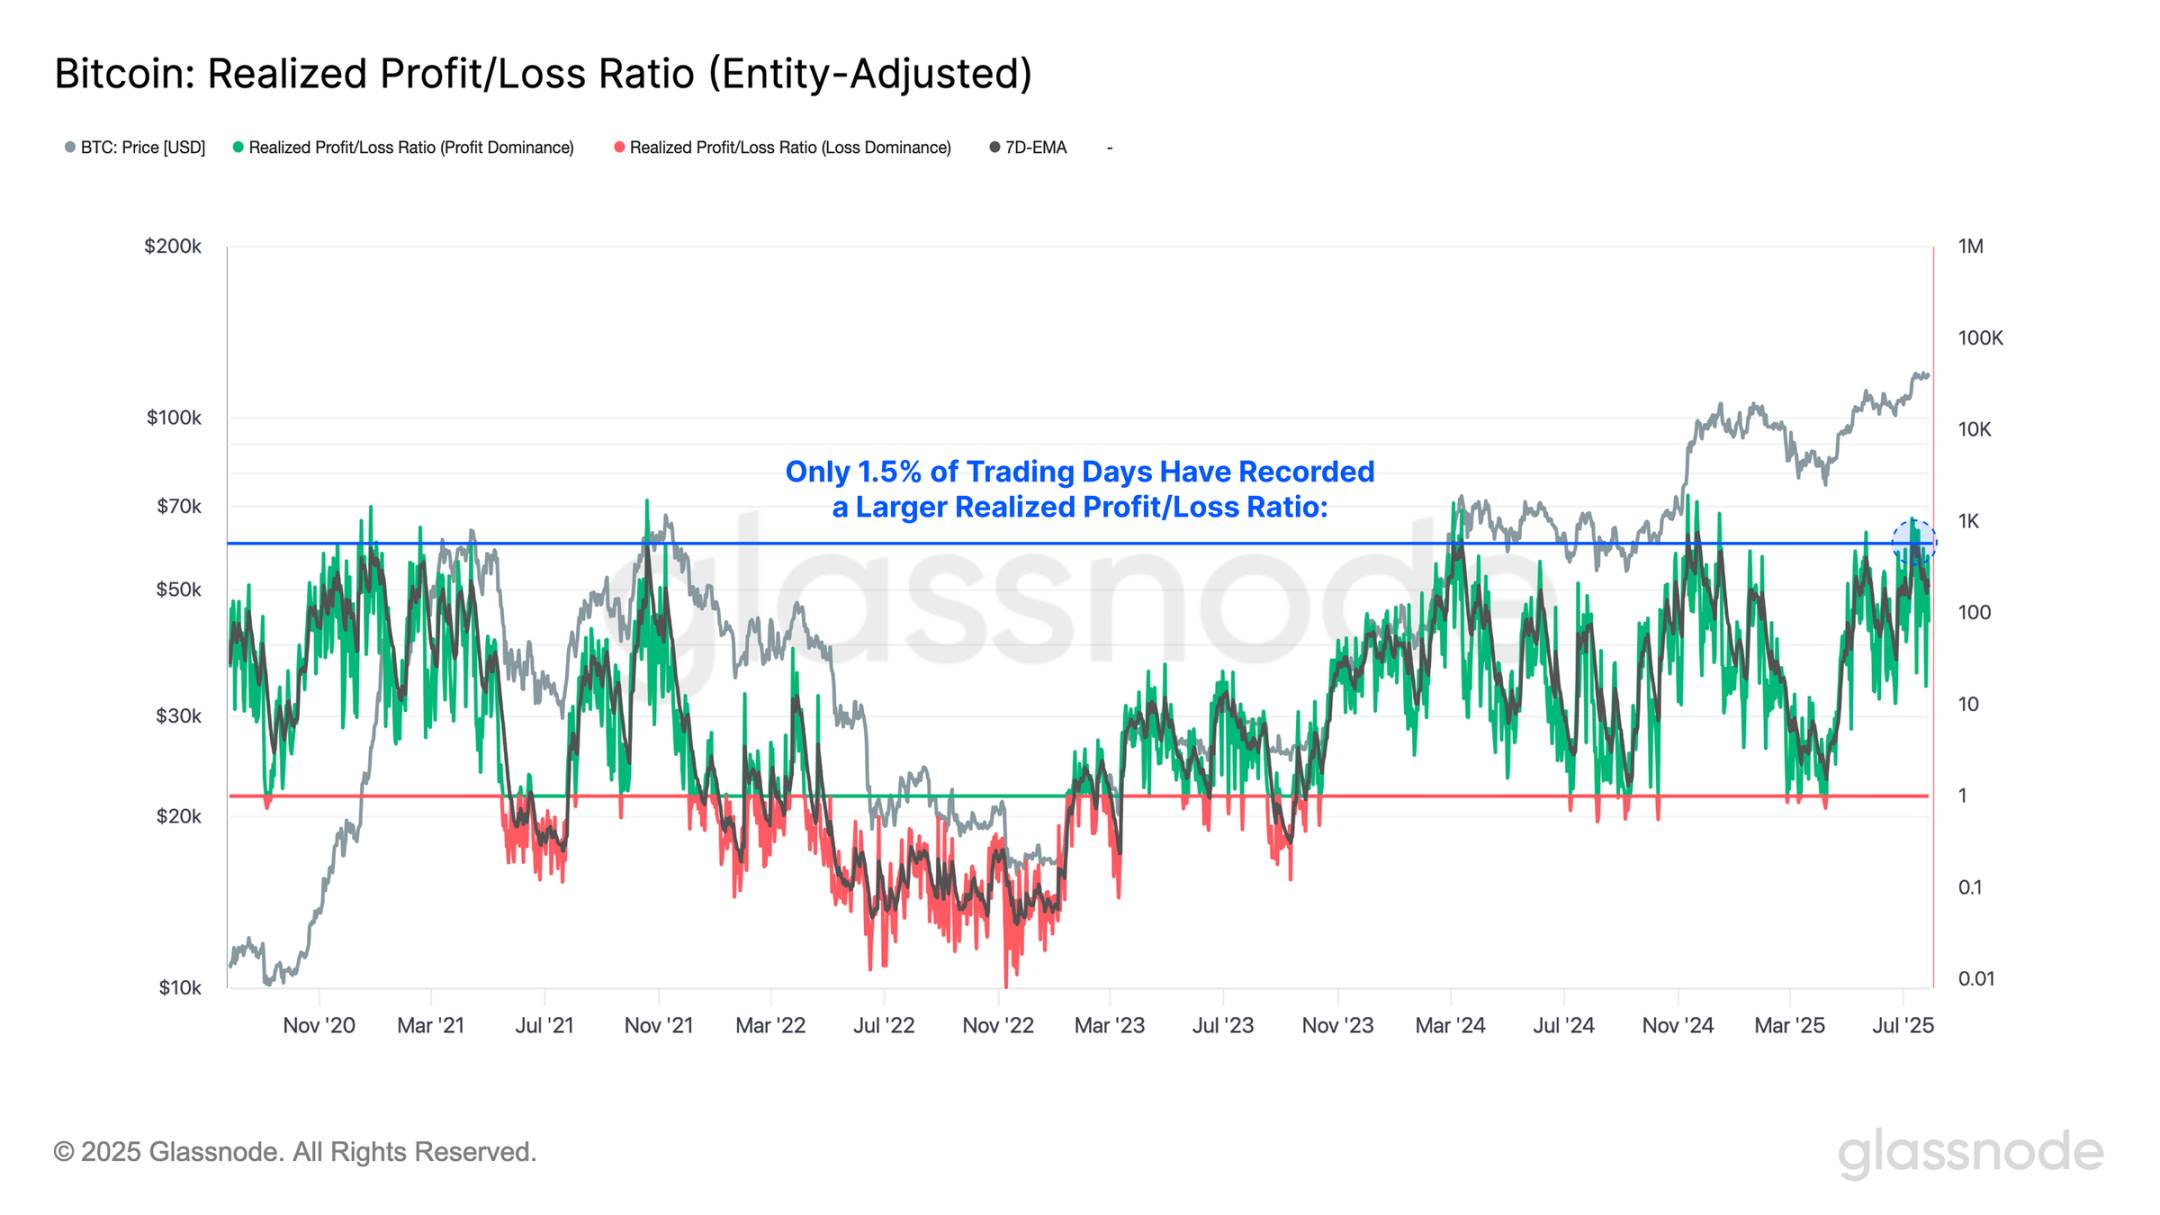
Realized Cap is a foundational on-chain metric used to quantify the total dollar-denominated liquidity within the Bitcoin network. It has now surpassed $1.02 trillion, highlighting the growing depth and thickness of liquidity in the asset.
Last weekend, this liquidity was put to the test. An early Bitcoin investor sold 80,000 BTC (approximately $9.6 billion) through Galaxy Digital, likely using a combination of open market sales and OTC transactions. The resulting selling pressure drove the price down to $115,000 before stabilizing at $119,000.
This event underscores Bitcoin’s ability to absorb massive sell-offs even during typically thin weekend trading sessions, confirming the robustness of its market structure.
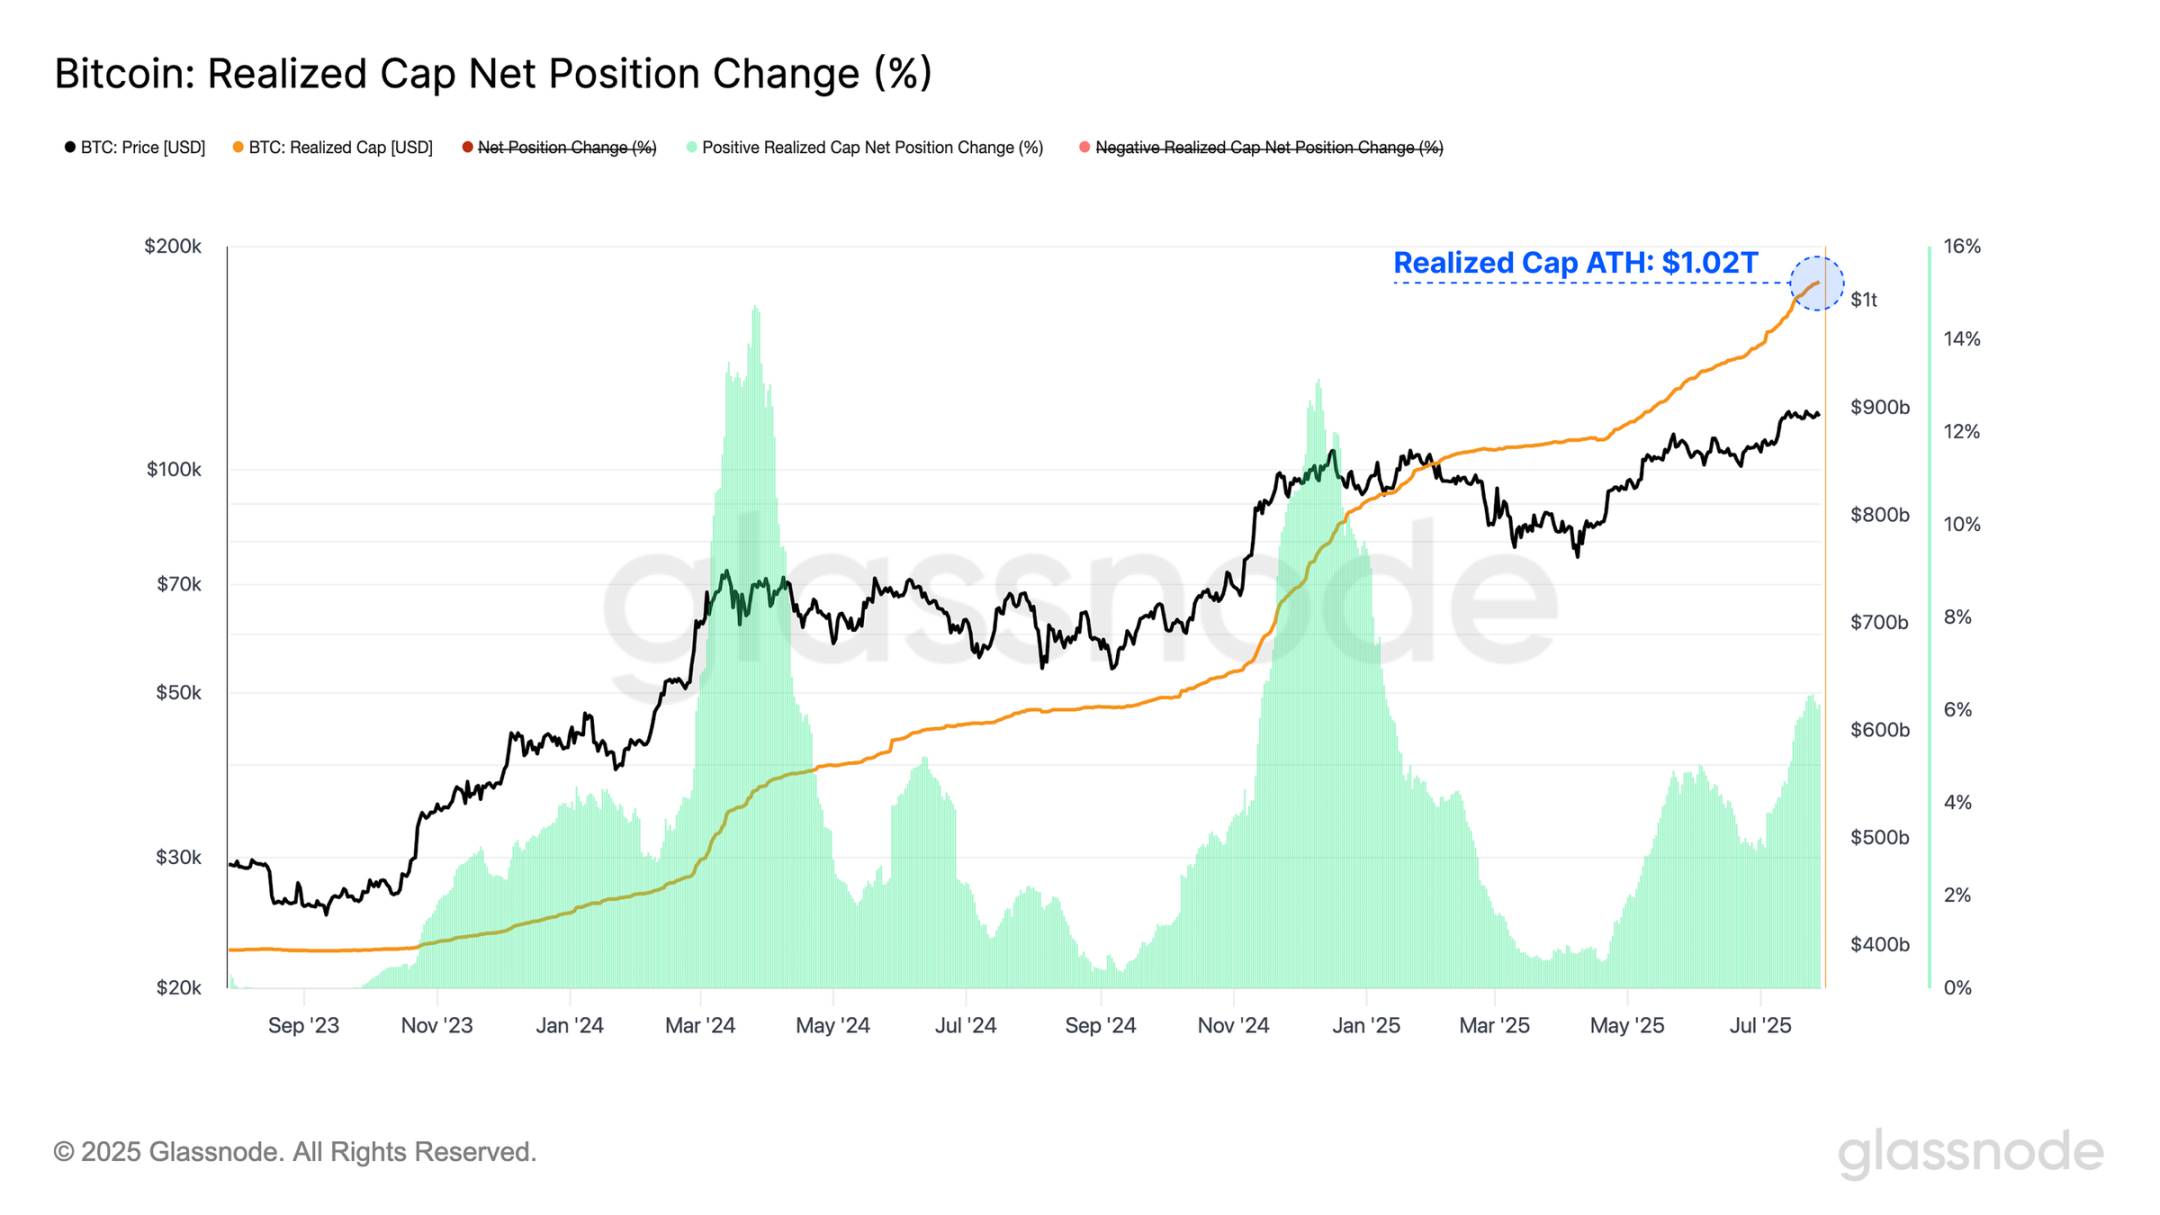
The event also pushed the Net Realized Profit/Loss metric to a record high of $3.7 billion. Notably, this spike preceded the weekend sell-off, reflecting capital movements ahead of final distribution.
Since these coins were initially flagged by entity-adjusted algorithms as internal transfers, subsequent address changes processed through Galaxy Digital were recorded as economically meaningful transactions—indicating ownership transfer.
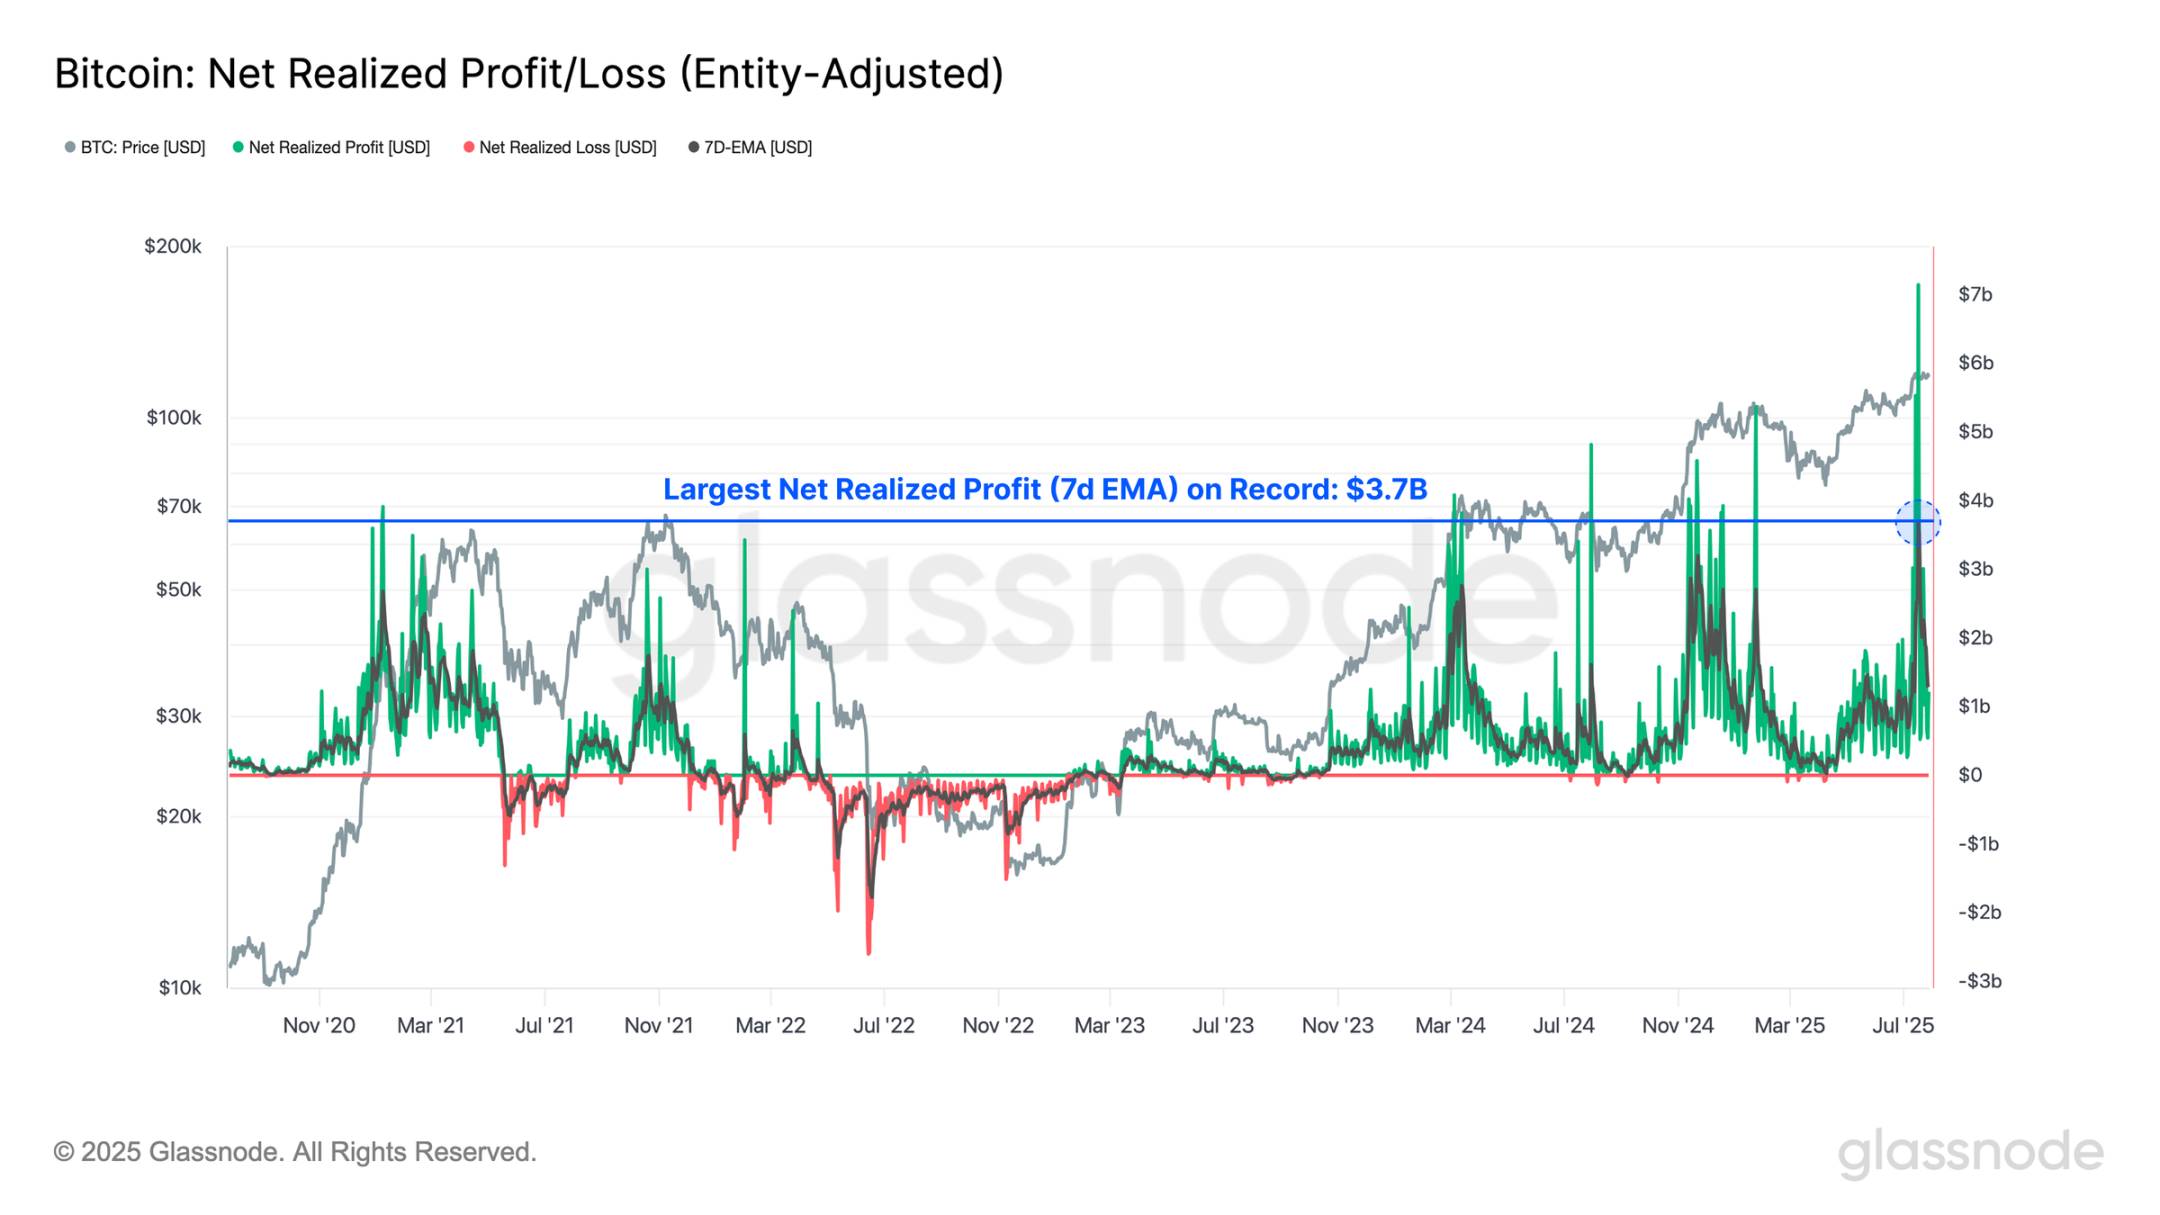
Recent surges in profit-taking have sharply accelerated the Realized Profit/Loss Ratio, with realized profits now reaching 571 times realized losses. This level is extremely high—only 1.5% of trading days in history have seen higher readings.
However, interpreting this signal requires caution. While extreme profit-taking often coincides with price tops (such as the $73,000 all-time high on March 2024), it does not trigger immediate reversals. For example, during the late-2024 break above $100,000, the peak in profit-taking occurred at $98,000, yet prices continued rising another 10% to $107,000 before topping.
This lag suggests that elevated profit-taking volumes often precede (but do not immediately cause) market exhaustion. Such supply pressure takes time to digest, and market reactions may be delayed.
Holding Period Analysis
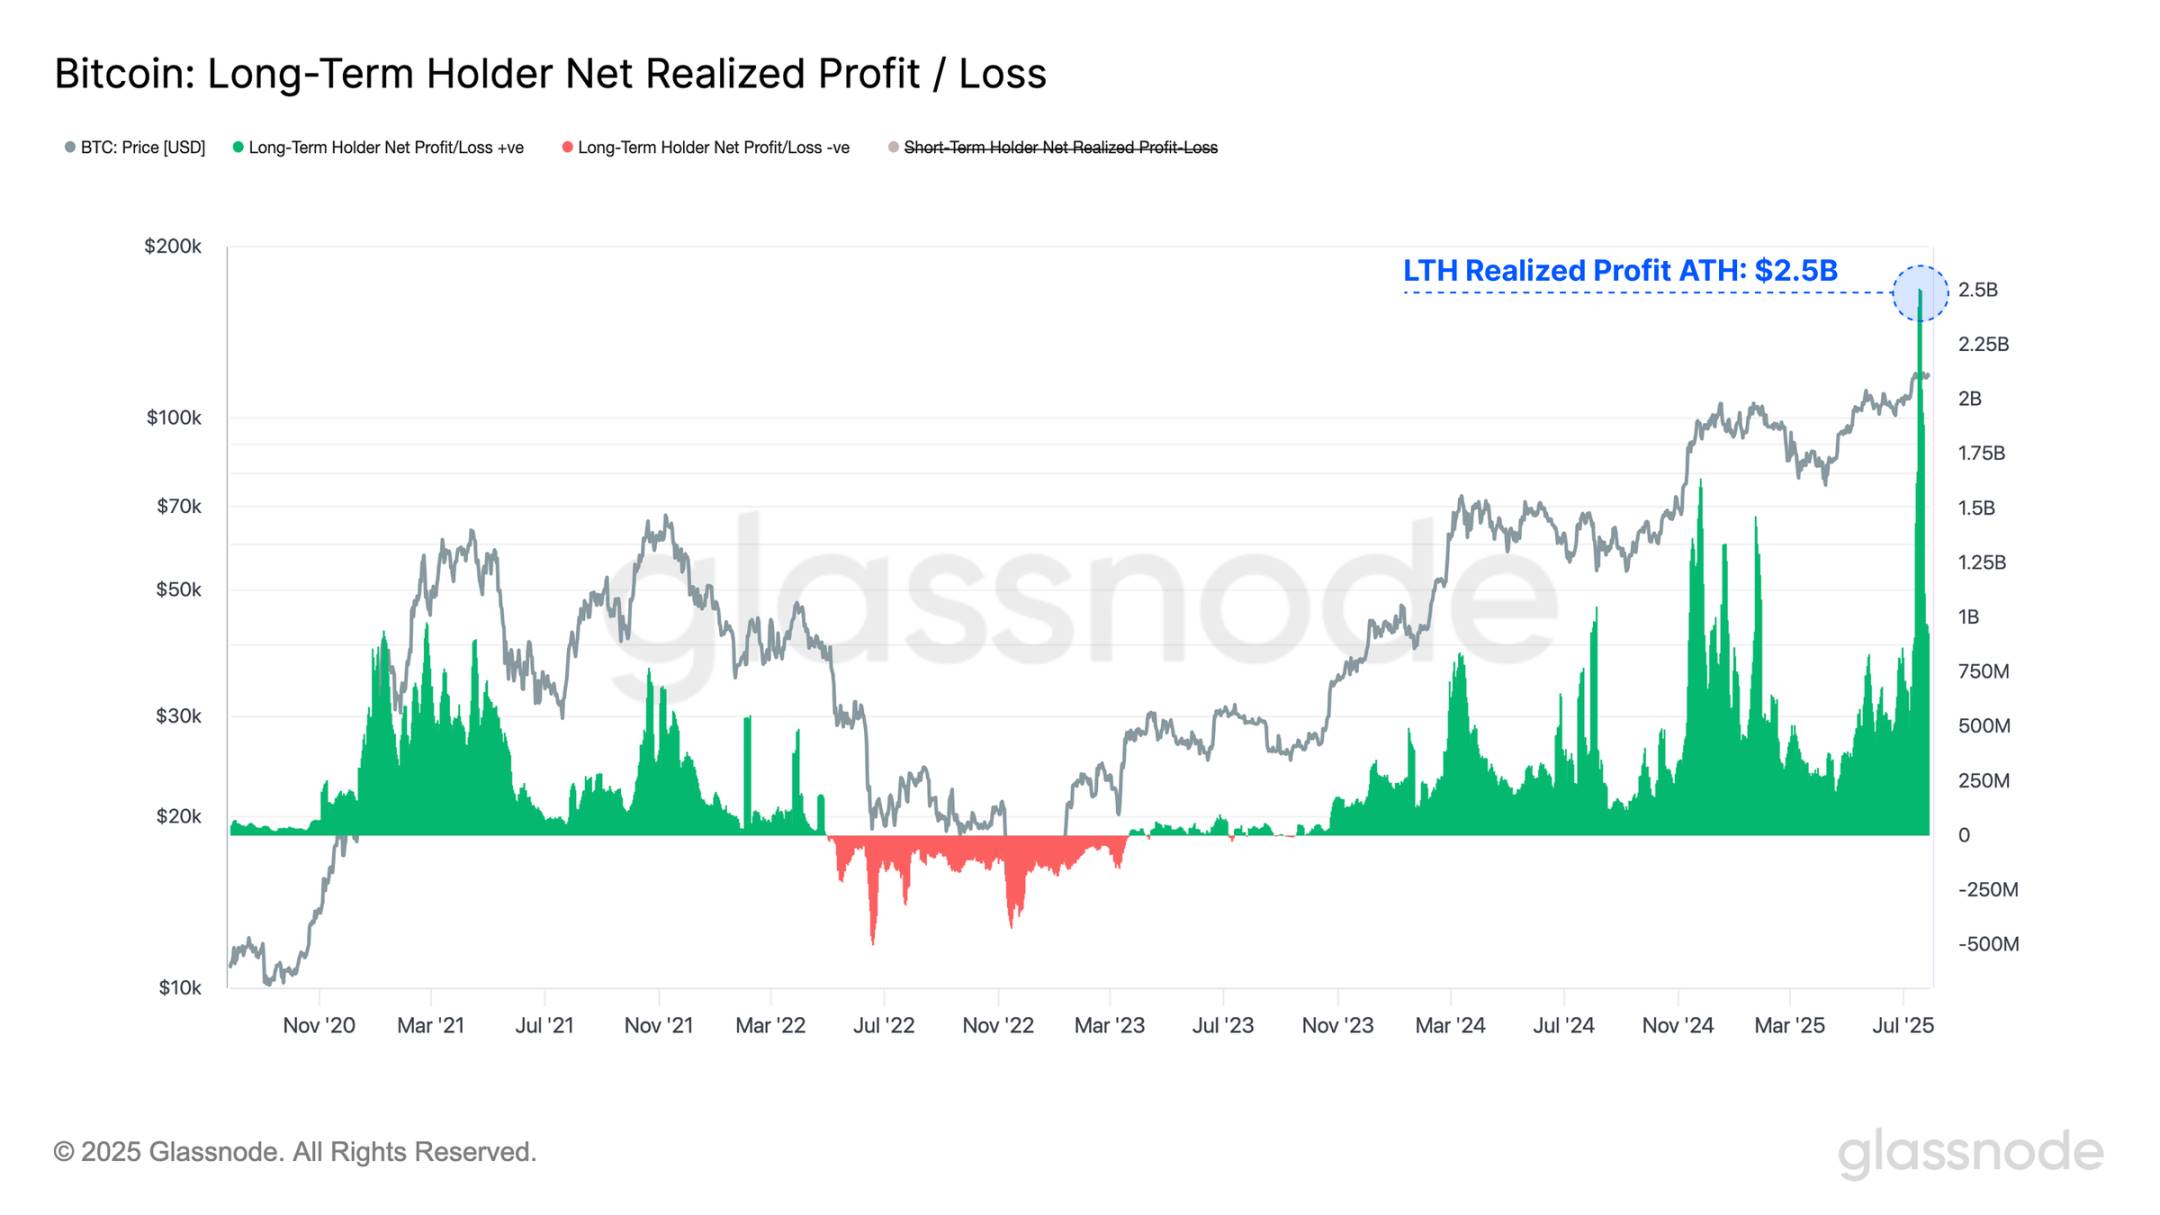
Following the absorption of a large volume of long-dormant coins, the Long-Term Holder Net Realized Profit/Loss reached a record high of $2.5 billion, surpassing the previous peak of $1.6 billion. This marks the largest single instance of selling pressure in Bitcoin’s history—an extreme liquidity stress test—but the market showed remarkable resilience, with prices remaining close to all-time highs.
This further confirms Bitcoin’s exceptional capacity to withstand major distribution events, building on prior tests seen this cycle including Mt. Gox compensation payouts and German government coin sales.
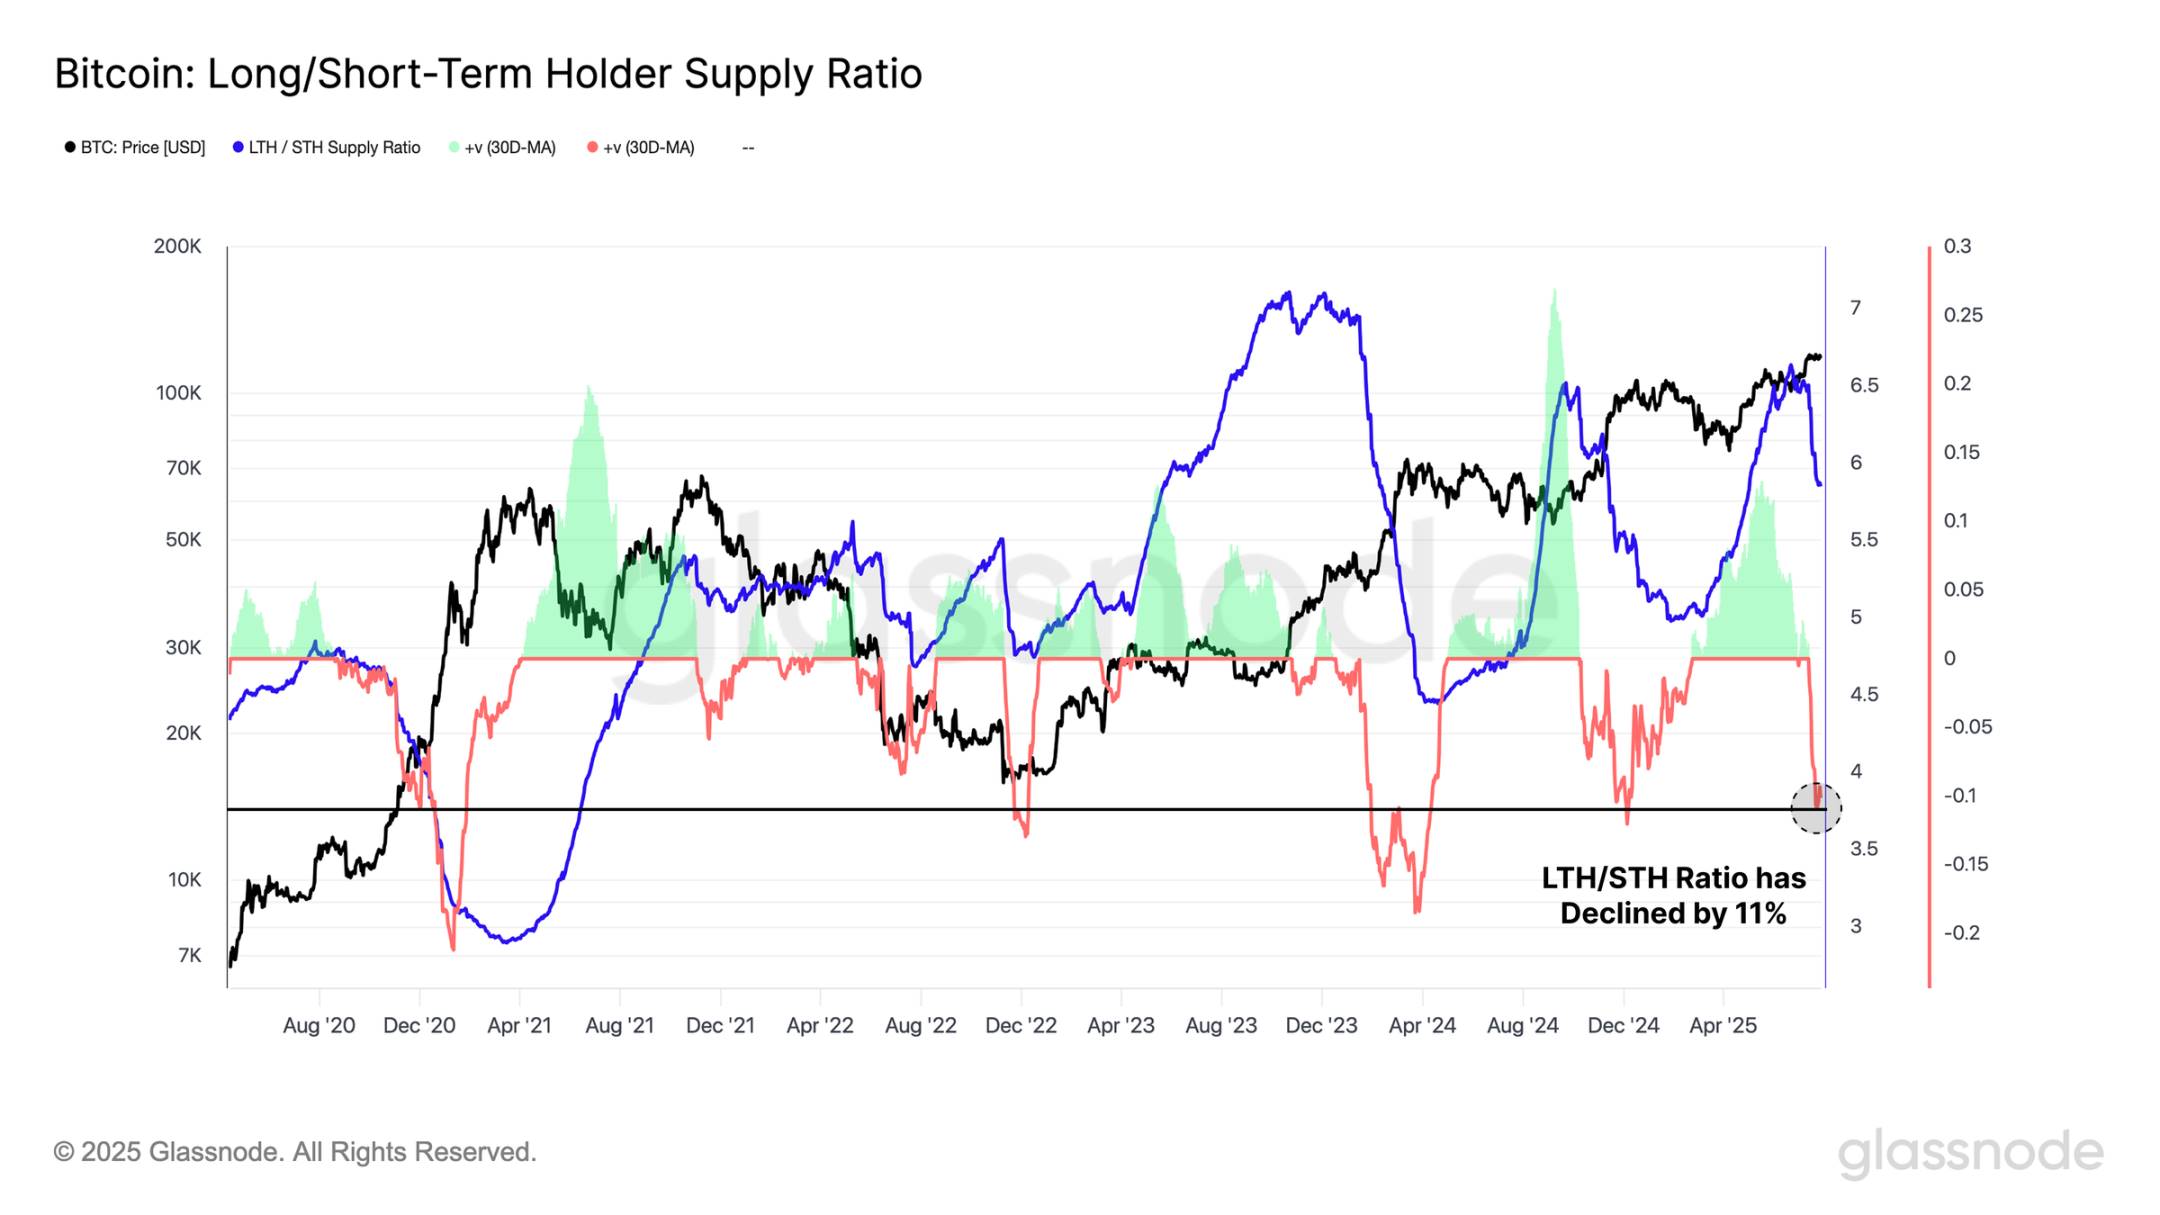
By comparing the supply ratio between long-term and short-term holders, we observe a recurring pattern across the three historical highs of this cycle: after initial accumulation phases, there is always a sharp shift toward aggressive distribution.
The current distribution phase continues, with the LTH/STH supply ratio steadily contracting. Over the past 30 days, this ratio has declined by 11%, a drop exceeded in only 8.6% of trading days, underscoring the intensity of the shift in investor behavior.
Unrealized Profit Analysis
Despite facing significant selling pressure last weekend—including large-scale profit-taking by long-term investors—Bitcoin’s market remained unusually stable. As a result, the vast majority of participants continue to hold substantial unrealized profits, with 97% of the circulating supply currently holding at cost bases below the spot price.
The total book value of unrealized gains held by market participants recently hit a record high of $1.4 trillion. This indicates that most investors are sitting on massive unrealized profits, which could fuel future selling pressure if prices continue to rise.
We can also examine the Market Value to Unrealized Profit (MVRP) ratio as a normalized metric. Currently, this indicator has once again breached the +2σ band—a level historically associated with periods of market euphoria and the formation of all-time highs. This statistically reinforces the reality that participants are holding significant unrealized profits.
This suggests many investors are optimistic about market conditions, which acts as both a sentiment catalyst and an indicator of increasing motivation for future profit-taking.
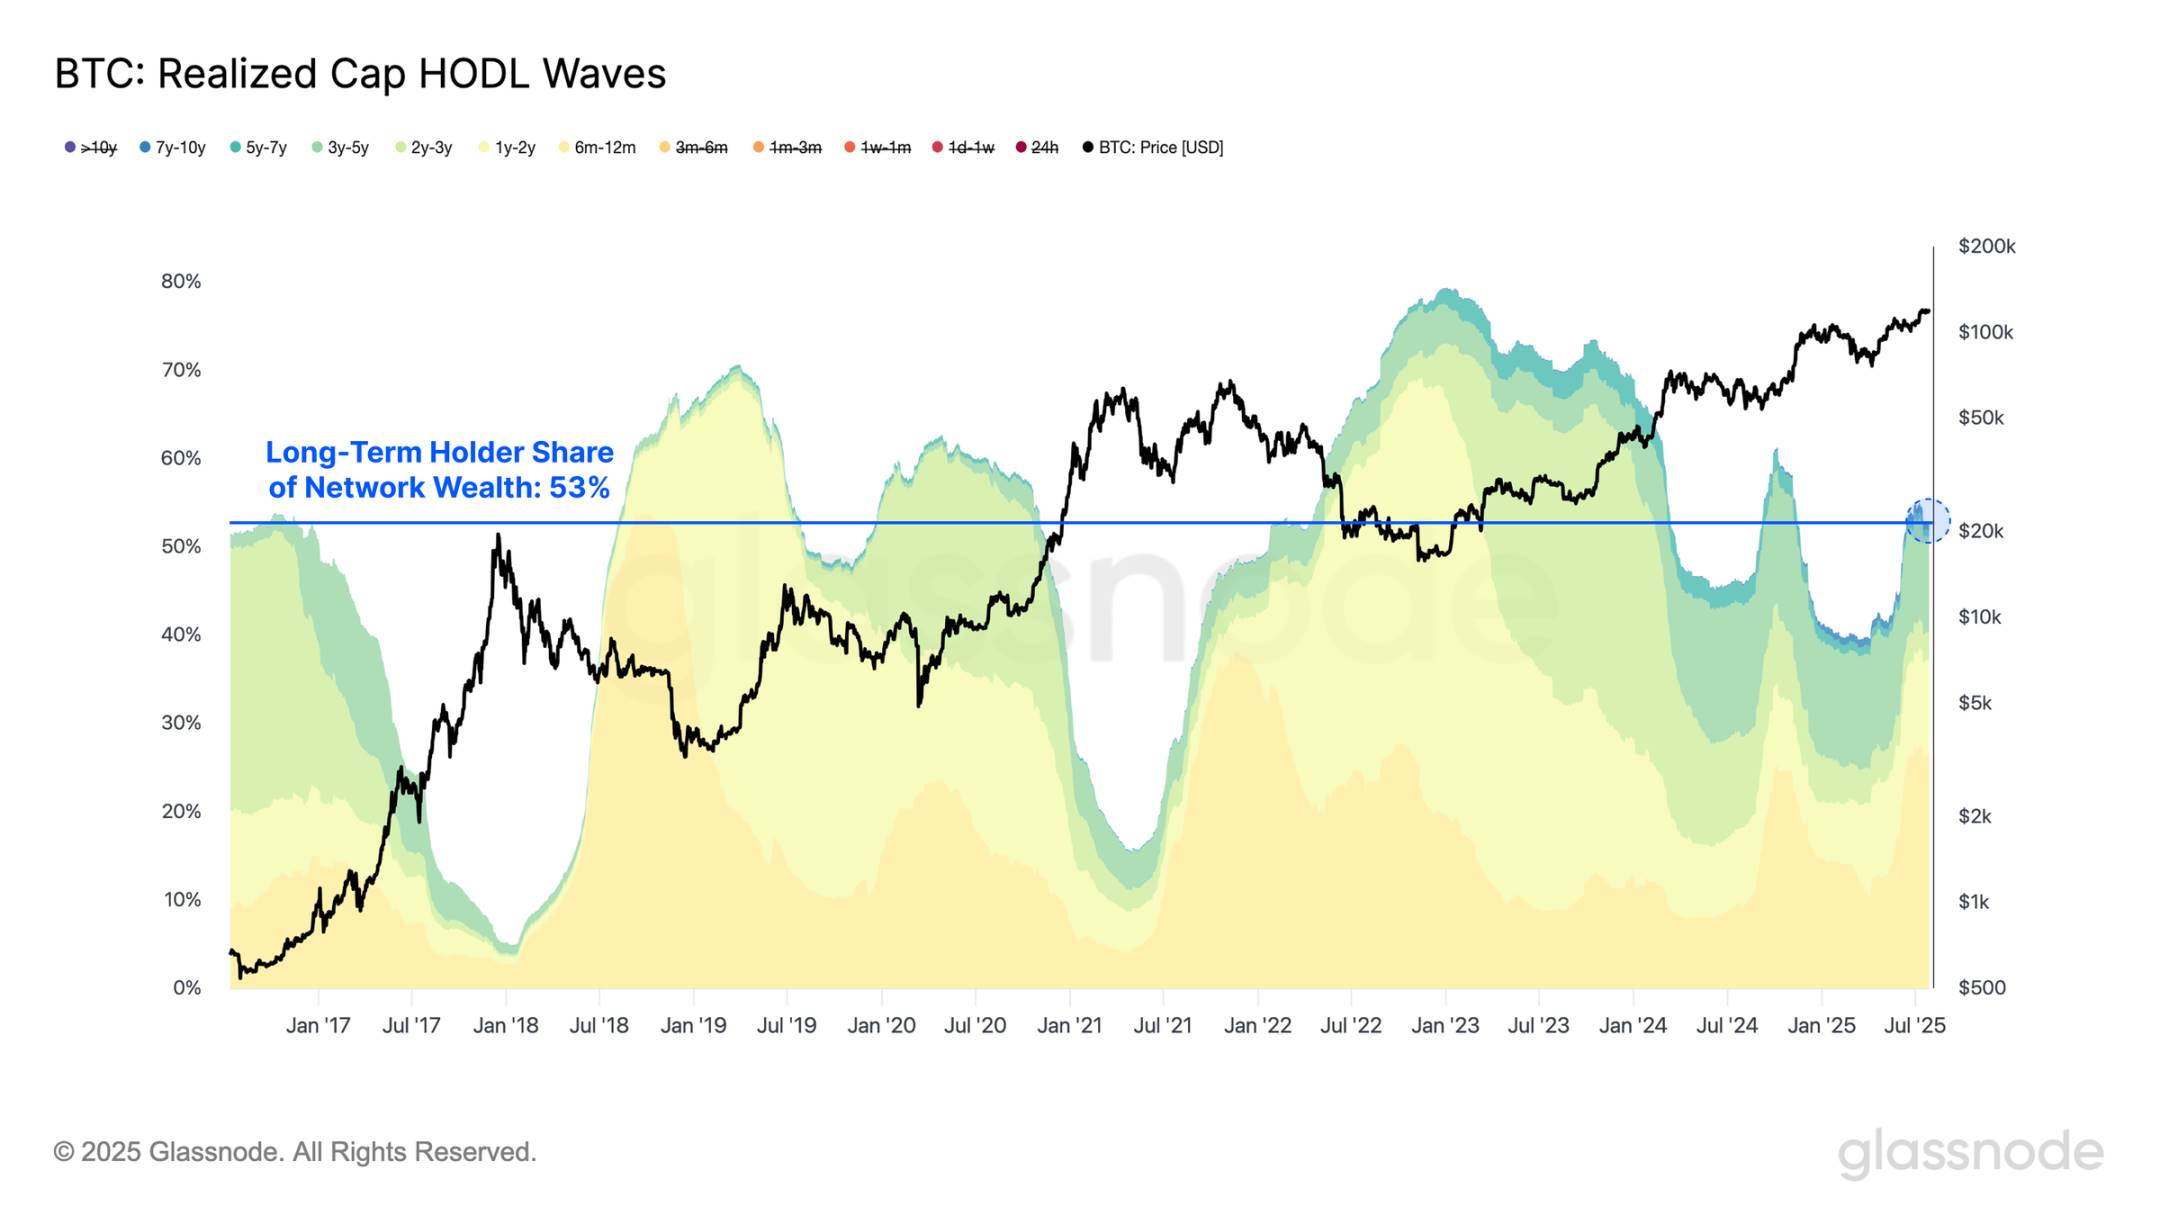
Unlike previous cycles, long-term holders still control 53% of the wealth. Although this group has been continuously distributing throughout the cycle, this proportion remains substantial given the already elevated levels of unrealized profit.
The overall dynamics suggest that long-term holders may still have further selling ahead. As prices reach attractive levels capable of activating deeply dormant whale holdings, the market will require additional demand inflows to absorb the resulting selling pressure.
Market Cost Analysis
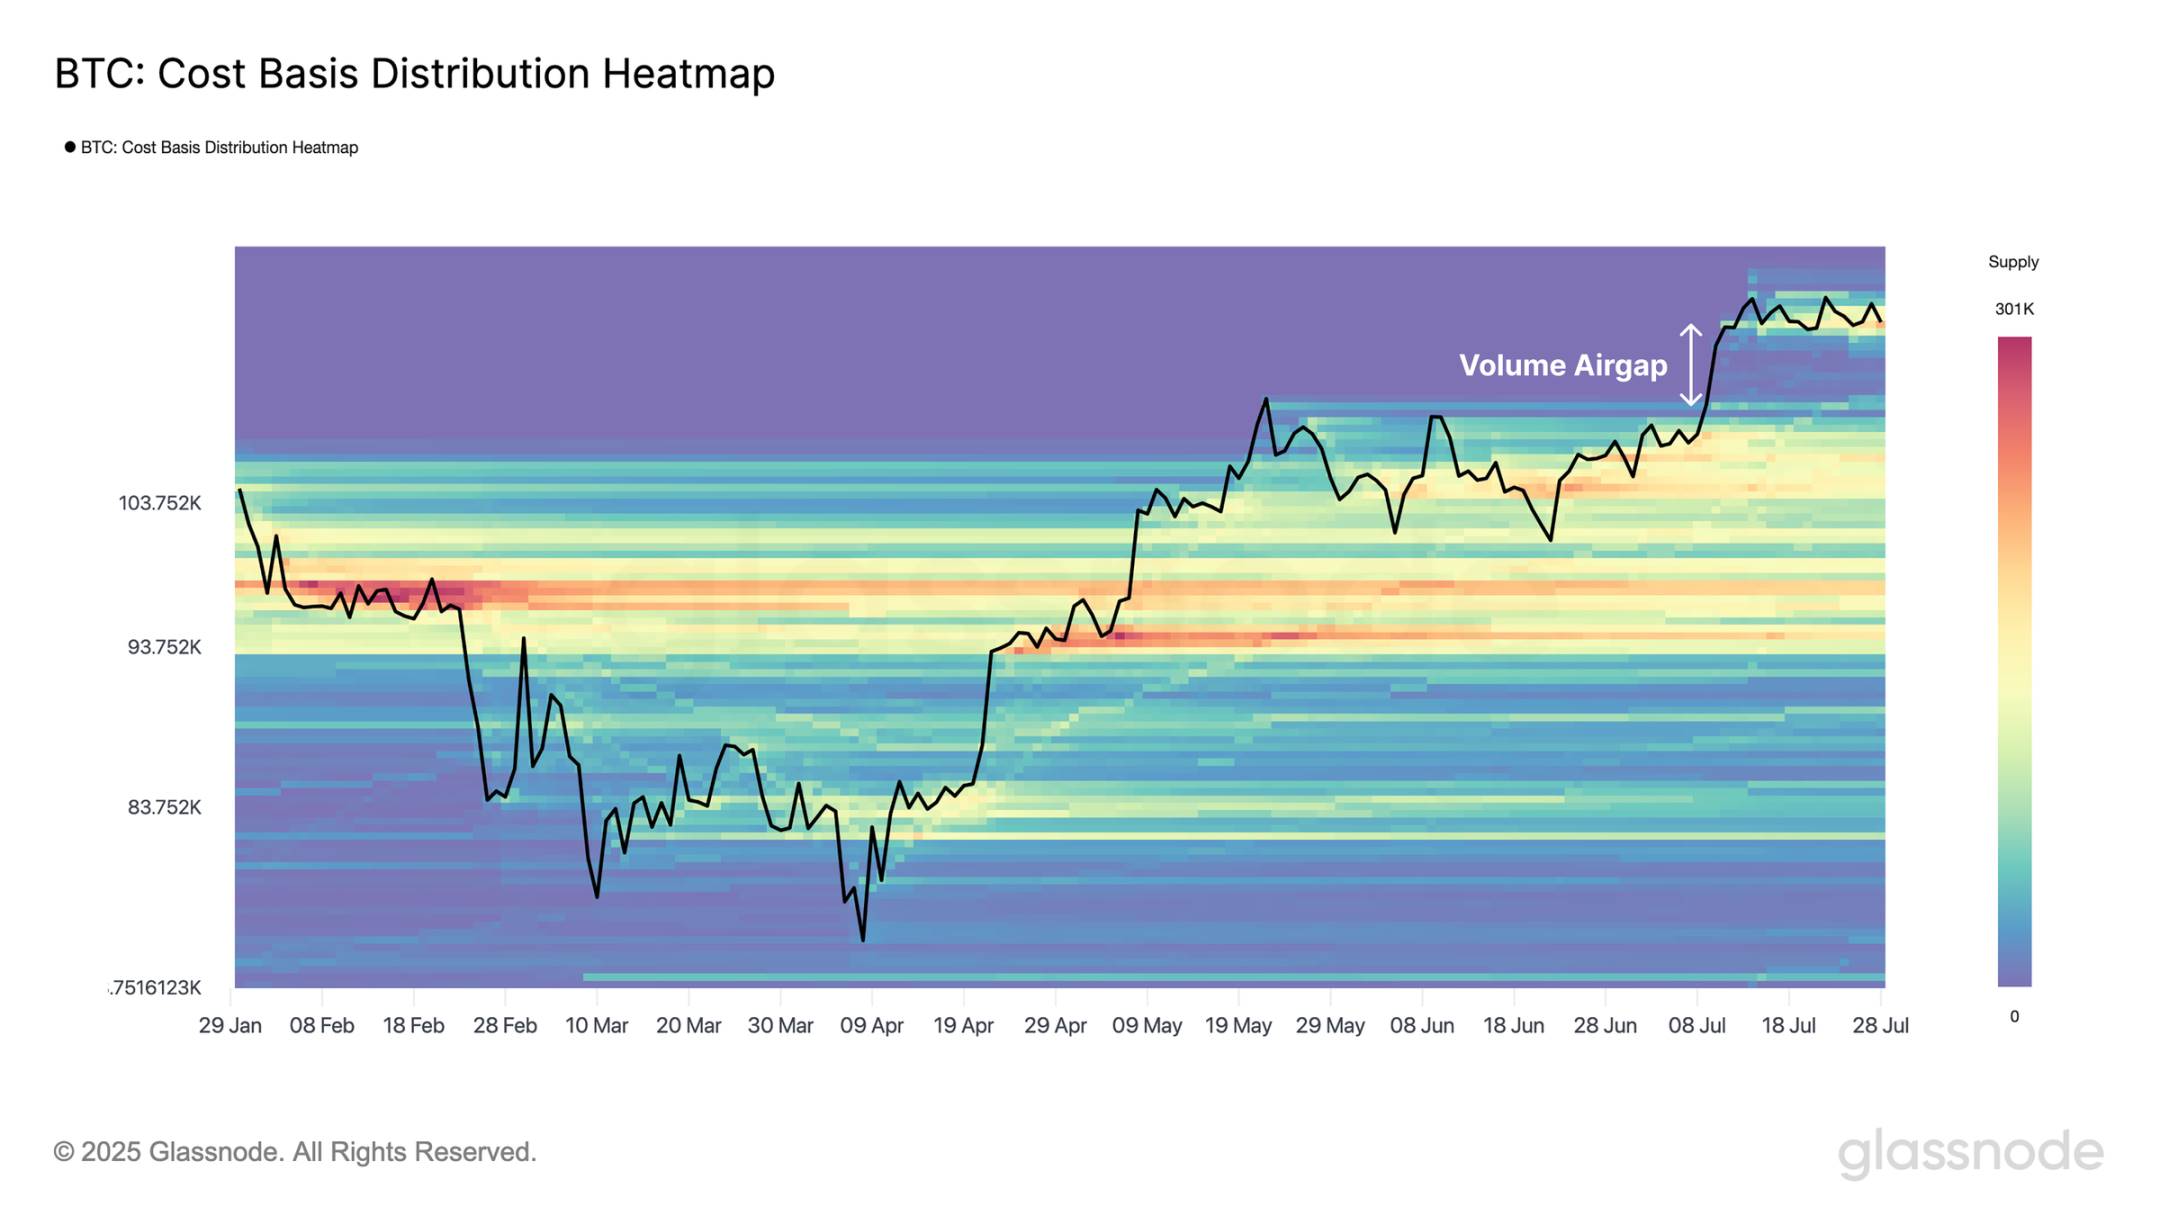
Bitcoin’s cost basis distribution reveals a significant concentration of cost bases between $117,000 and $122,000, indicating that a large number of investors accumulated positions within this high-price range.
Notably, there is a volume vacuum between $110,000 and $115,000—below the current spot price—resulting from rapid price appreciation without sufficient exchange activity. Not all vacuums need to be filled, but this zone exerts gravitational pull on price, and the market may test its support strength, making it a key area to monitor during any pullback.
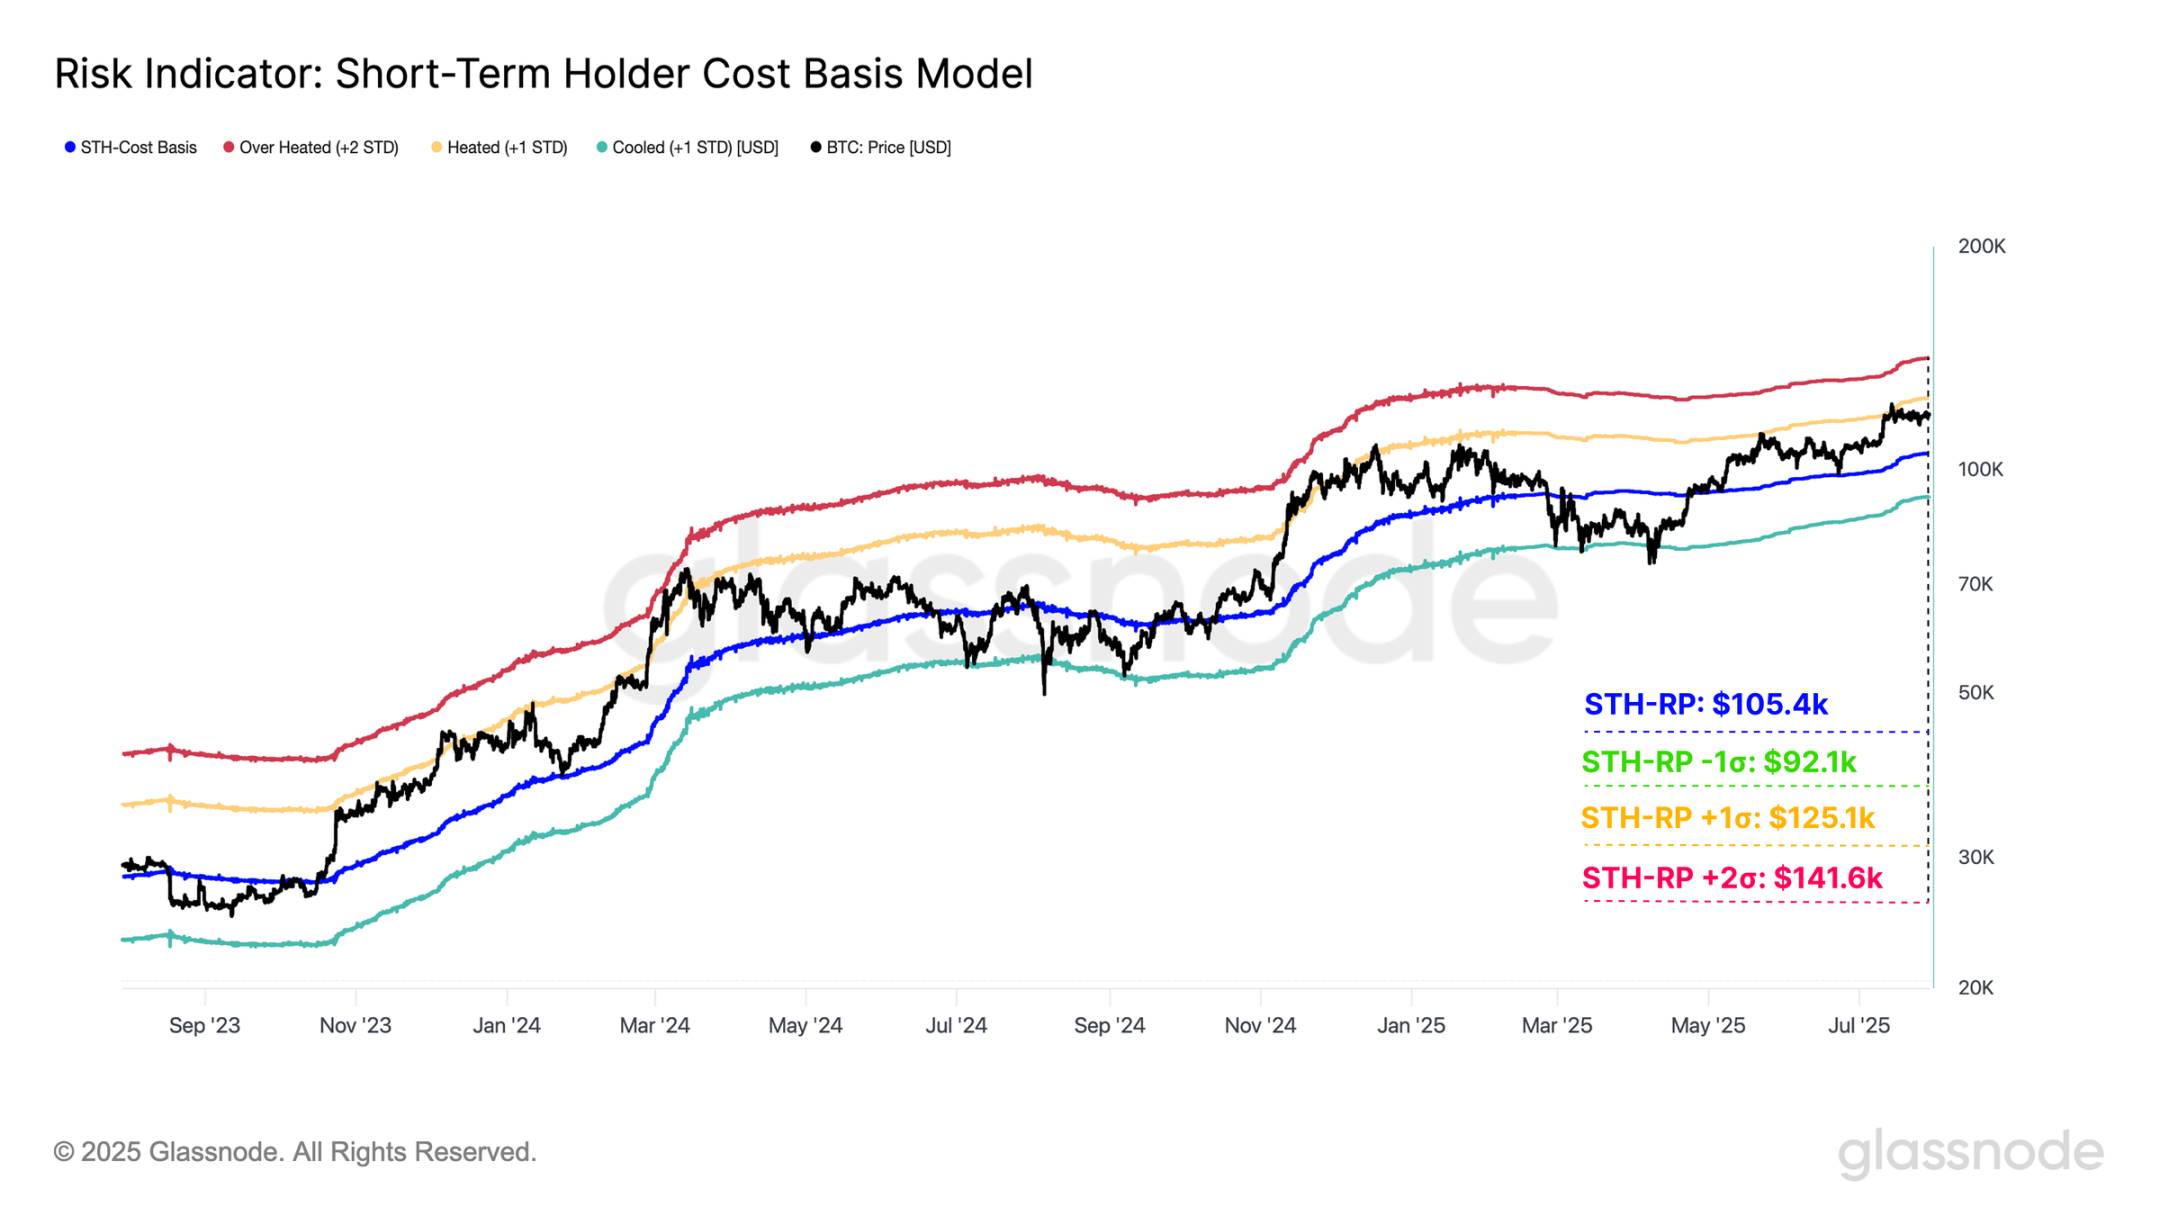
The Short-Term Holder (STH) Cost Basis—representing the average entry cost of newer investors—has historically served as a critical threshold distinguishing local bull and bear regimes. Overlaying standard deviation bands adds statistical context:
-
STH CB +2σ: $141,600
-
STH CB +1σ: $125,100
-
STH Cost Basis: $105,400
-
STH CB -1σ: $92,100
A key observation is that Bitcoin’s price remains consistently above the STH Cost Basis—a positive sign of market strength. Moreover, in all major top formations this cycle, price has stalled near the +1σ level, and the current setup is no exception.
From a macro perspective, Bitcoin may remain range-bound between $105,000 and $125,000 until a decisive breakout occurs. A sustained move beyond this range could shift focus to $141,000 (the +2σ zone), where on-chain indicators suggest selling pressure may intensify sharply.
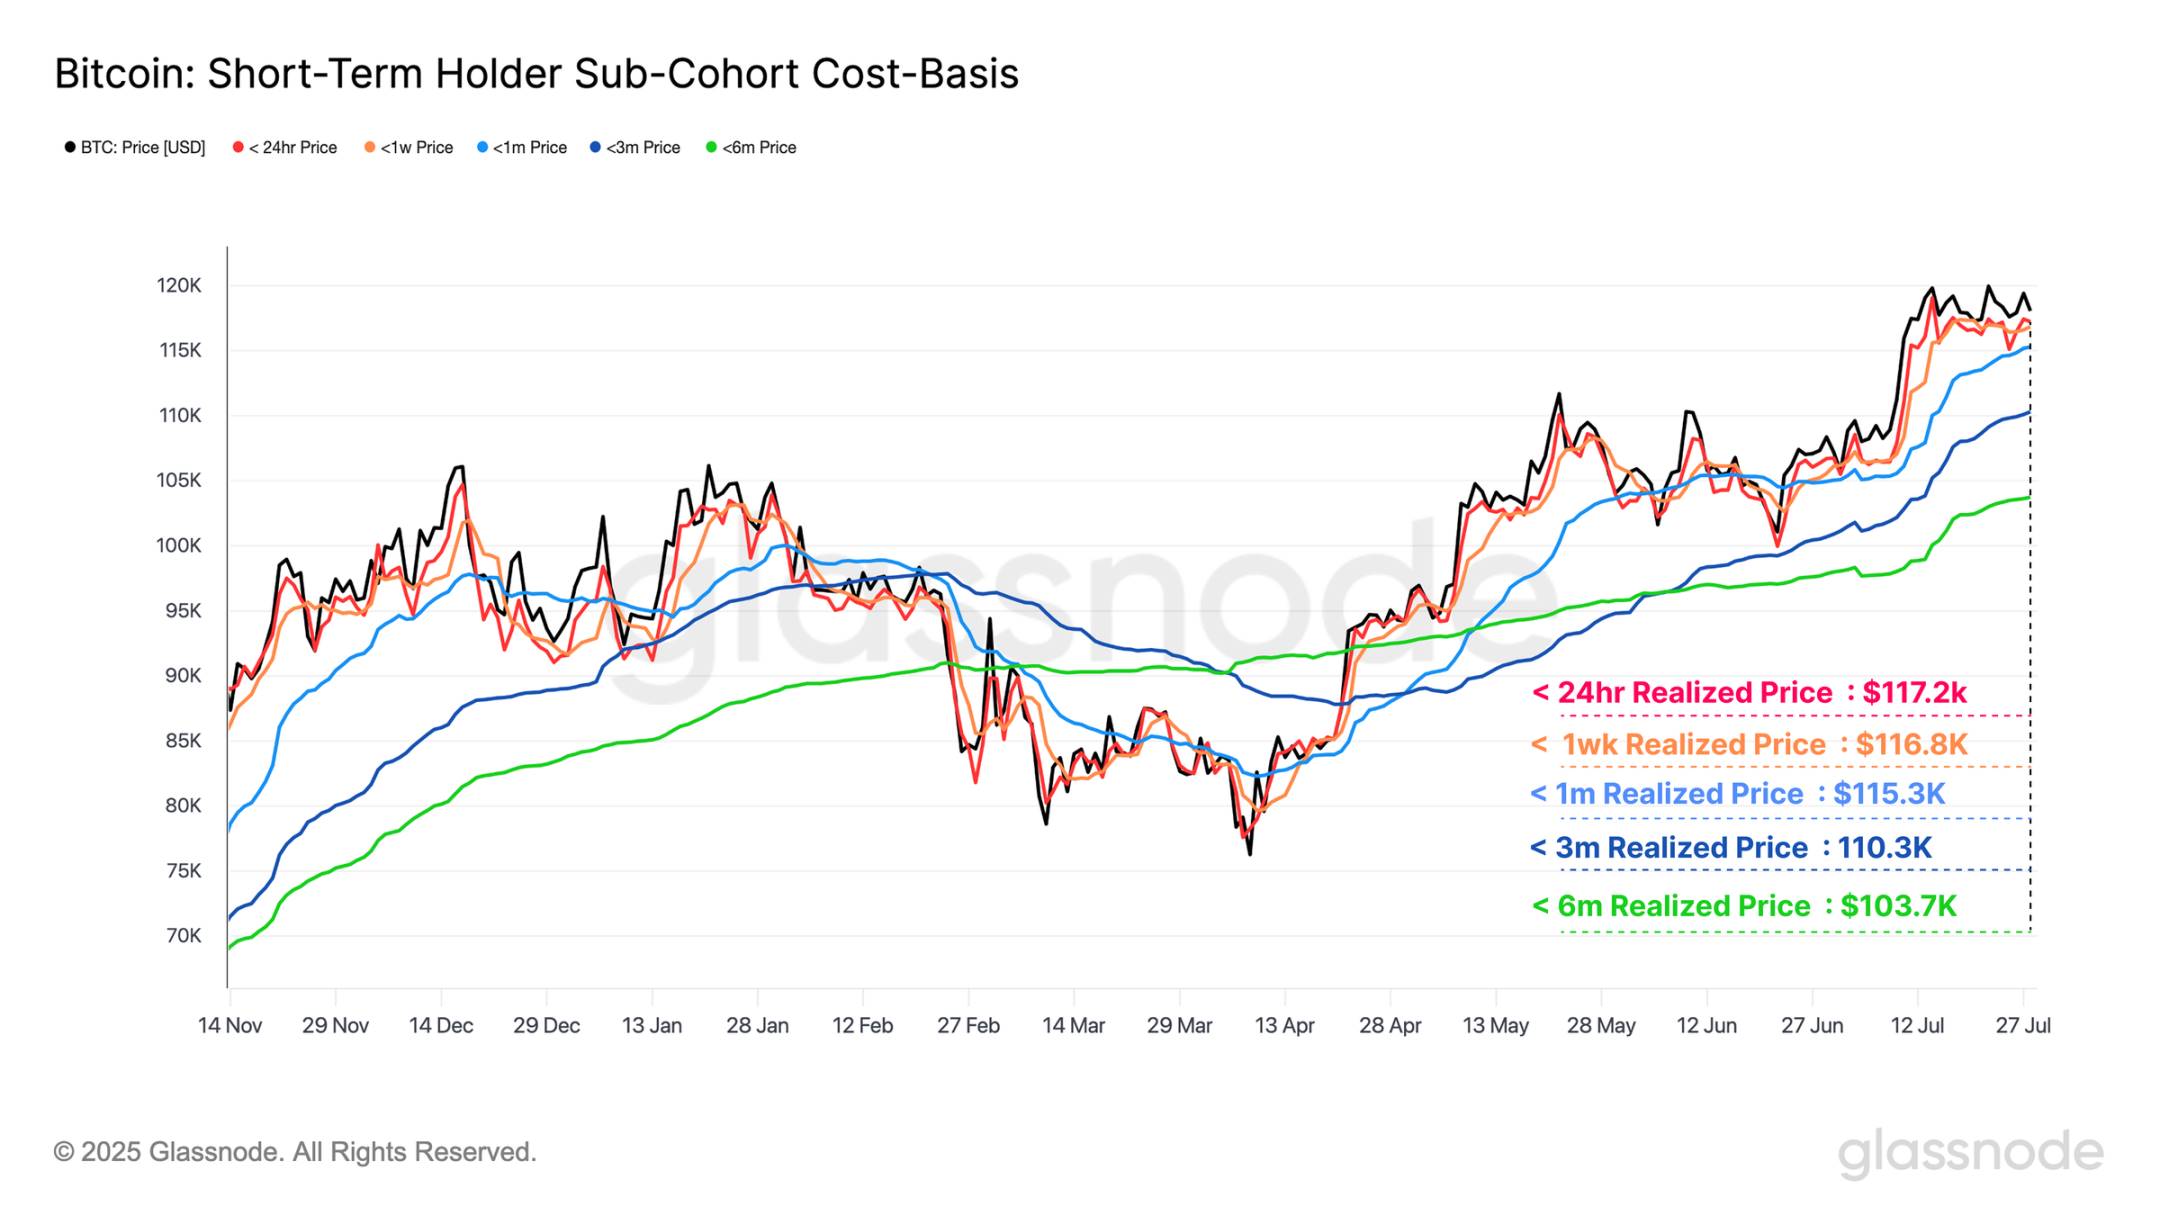
By analyzing subgroups within short-term holders, we can construct "fast-slow cost basis bands" as a momentum gauge for short-term market sentiment. Currently, price remains above all STH subgroup cost bases, signaling market strength. Notably, the cost basis band for holders with 24 hours to 3 months of holding duration ($110,000–$117,000) aligns closely with the low-volume region identified in the cost basis distribution.
The convergence of multiple independent indicators reinforces the significance of this price zone, suggesting it may act as critical support during any correction.
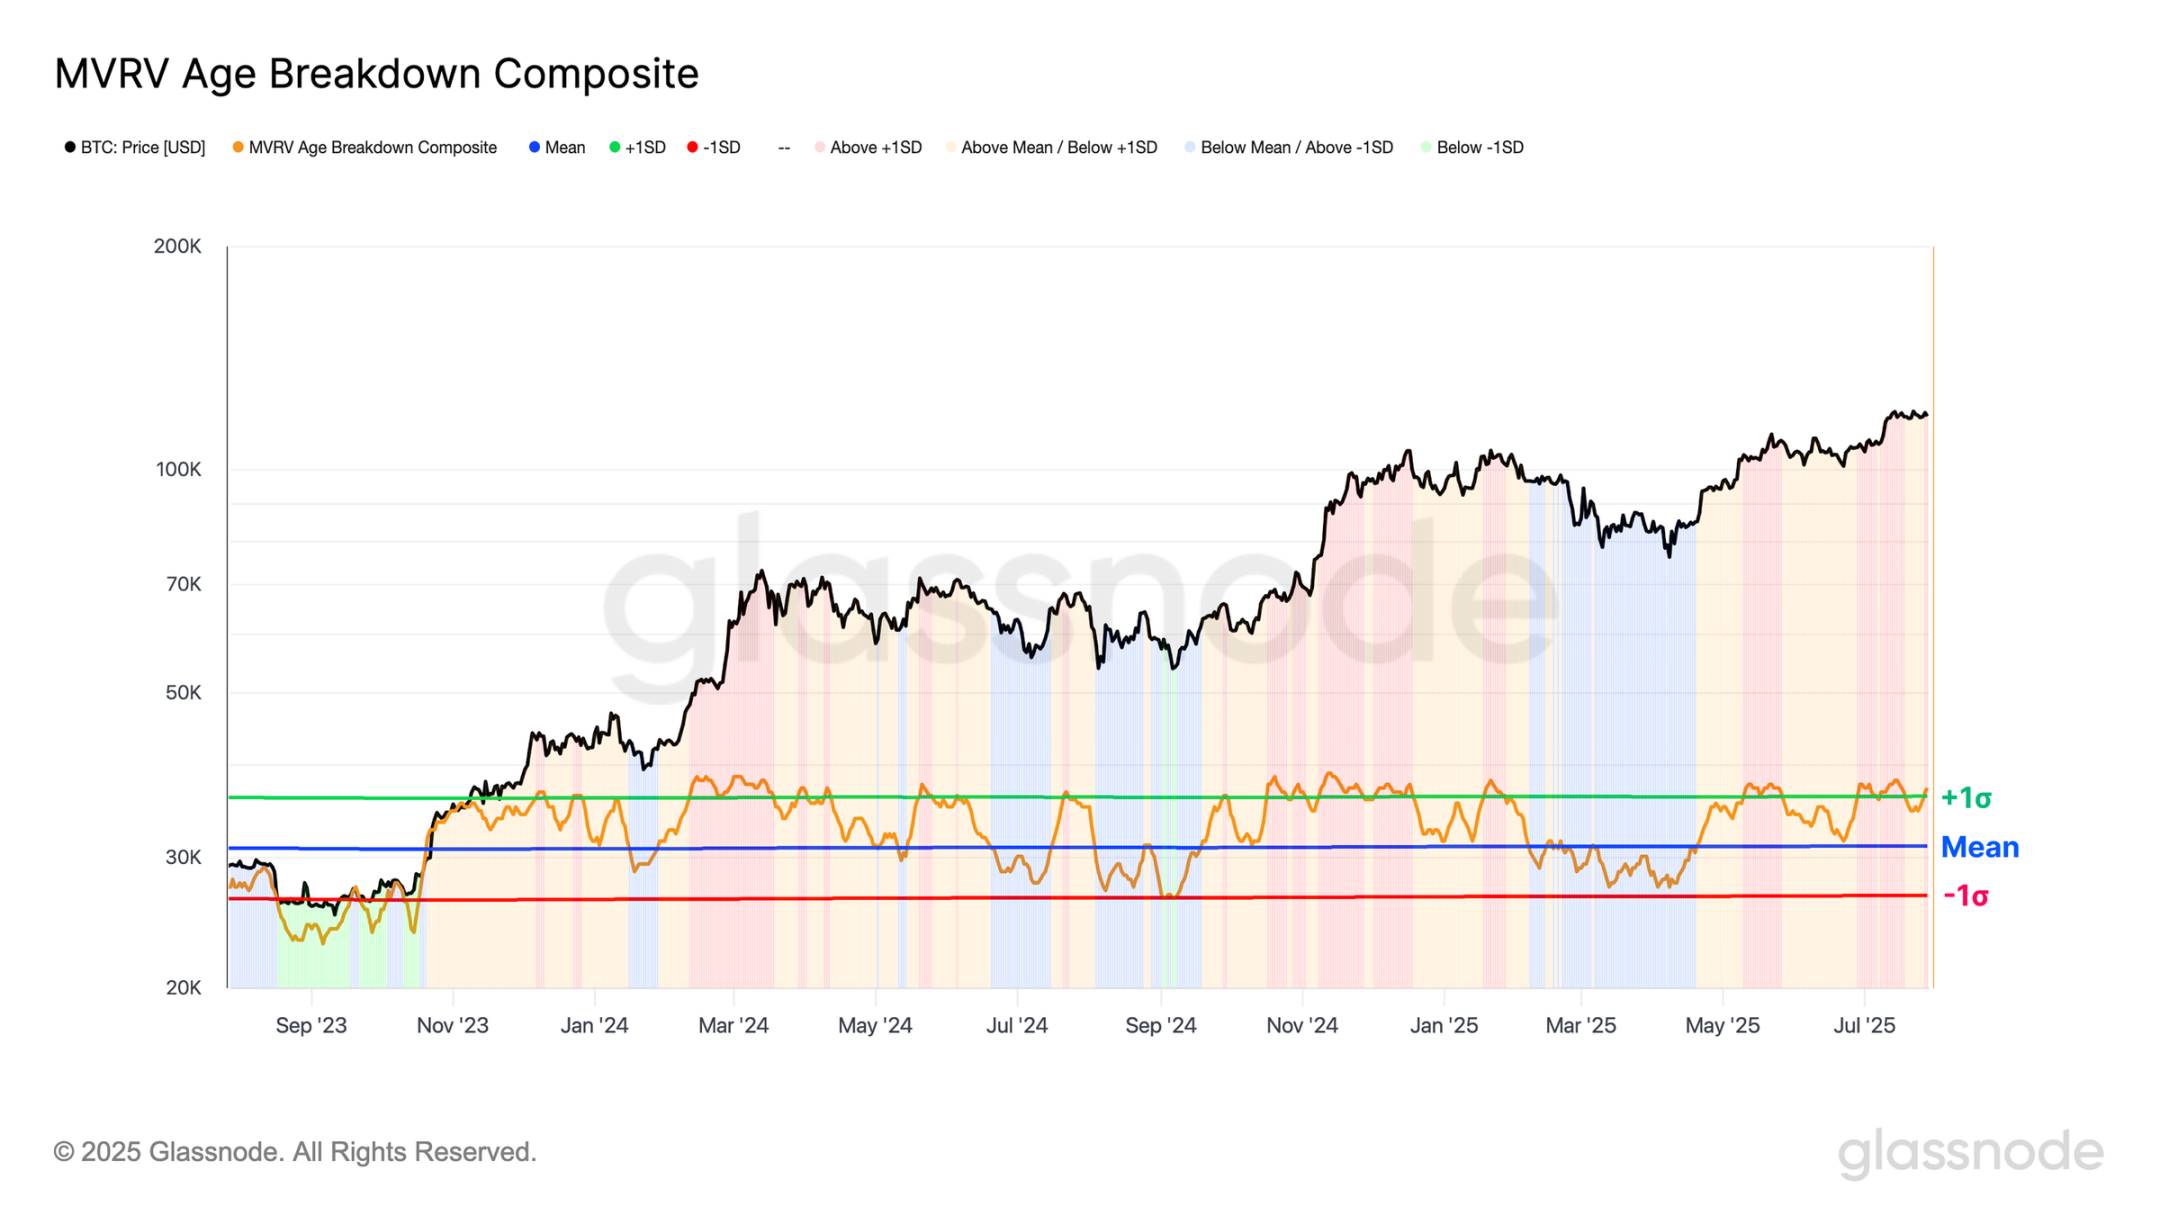
To gain deeper insight into subgroup momentum, we use an equal-weight composite metric measuring the proportion of profitable subgroups. This indicator remains persistently above average and is approaching the +1σ level, indicating solid market momentum and confirming that most new investors remain in profit.
Summary & Conclusion
Last weekend, Bitcoin’s resilience faced a severe test as the market efficiently absorbed the sale of 80,000 BTC ($9.6 billion)—one of the largest profit-taking events in its history. Despite the extraordinary transaction size, price quickly stabilized near all-time highs, highlighting the depth and maturity of current market liquidity.
Bitcoin is currently consolidating between $105,000 and $125,000. A decisive breakout from this range could alter the market landscape, bringing $141,000 into focus—where on-chain metrics suggest intense profit-taking may occur. Conversely, the low-volume zone between $110,000 and $115,000 below the current price warrants close attention, as it would become a key observation point should a pullback occur.
Join TechFlow official community to stay tuned
Telegram:https://t.me/TechFlowDaily
X (Twitter):https://x.com/TechFlowPost
X (Twitter) EN:https://x.com/BlockFlow_News
 @glassnode