Ethereum enters midlife crisis: $7.3 billion burned over four years, yet why does token inflation persist?
TechFlow Selected TechFlow Selected
Ethereum enters midlife crisis: $7.3 billion burned over four years, yet why does token inflation persist?
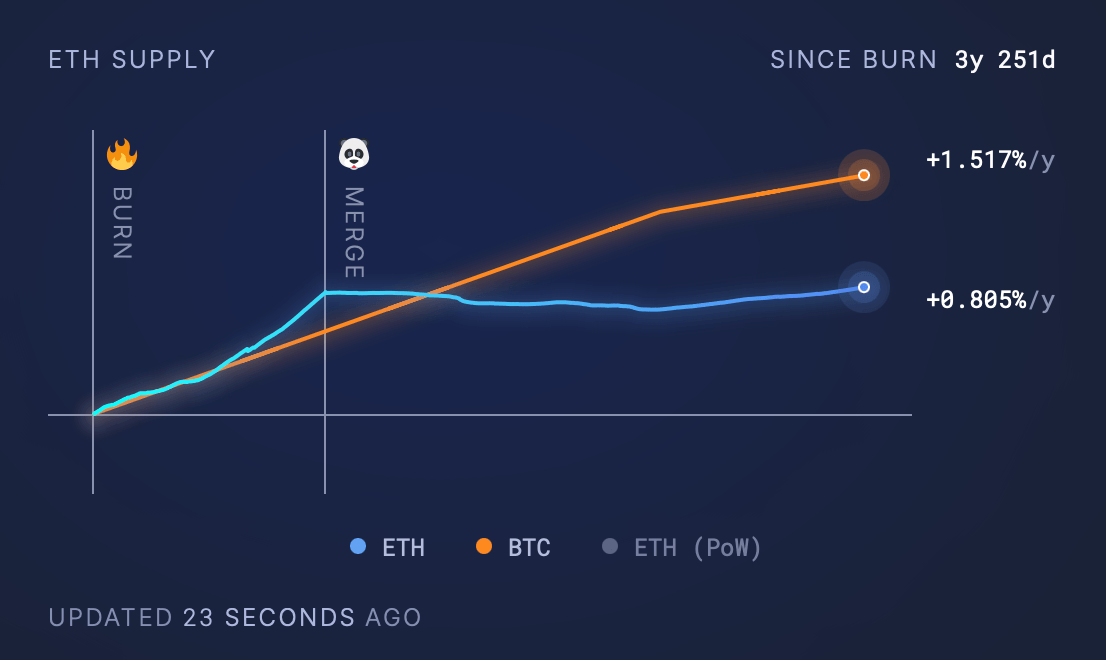
Ethereum's supply is still growing, with an annual growth rate of 0.805%. Despite burning a significant amount of ETH, the issuance volume continues to exceed the amount burned.
Author: Lawrence, Mars Finance
Introduction
Ethereum, the world's leading smart contract platform, introduced a fee-burning mechanism via EIP-1559 in an attempt to achieve deflationary goals.
However, as of April 13, 2025, research shows that its supply continues to grow at an annual rate of 0.805%, increasing by 3,477,830.85 ETH despite burning 4,581,986.52 ETH. This report analyzes this phenomenon from a research perspective, exploring historical context, current dynamics, influencing factors, and future outlook.
Historical Background
The London hard fork introduced EIP-1559, which changed how transaction fees are managed. Previously, all transaction fees were awarded to miners; under the new mechanism, base fees are burned while the remaining "tips" are allocated to validators (miners before The Merge). This mechanism aims to counteract the inflationary effect of new ETH issuance, ultimately making ETH a deflationary asset.
The September 2022 Merge transitioned Ethereum from PoW to PoS, significantly reducing the issuance rate. Before the Merge, miners received approximately 13,000 ETH per day; after the Merge, with around 14 million ETH staked, daily issuance dropped to about 1,700 ETH. This change laid the foundation for achieving deflation, but the actual effectiveness of the burn mechanism depends on network activity and fee levels.
Current Supply Dynamics
Since August 2021, $7.3 billion worth of Ether (ETH) has been burned.
As of April 13, 2025, Ethereum’s circulating supply is approximately 120,690,000 ETH, with an annual growth rate of 0.51%. Since the London hard fork, 4,581,986.52 ETH have been burned—worth about $7.3 billion based on historical ETH prices. However, net supply increased by 3,477,830.85 ETH, indicating that issuance exceeded burn volume.
In comparison, Bitcoin experienced an average annual inflation rate of 1.517% over the same period (three years and eight months), despite having a fixed cap of 21 million BTC, whereas Ethereum theoretically has no supply limit.
Factor Analysis
The following factors influence the balance between burning and issuance:
Network Activity and Transaction Fees:
-
Burn rates are directly tied to transaction volume and fees. High-activity periods (e.g., NFT booms or DeFi surges) may lead to temporary deflation. The 2024 Dencun upgrade reduced Layer 2 transaction costs by introducing proto-danksharding, improving user experience but also reducing burn volumes.
-
For example, Dencun lowered transaction costs for Layer 2 solutions like Optimism and Arbitrum, indirectly reducing burns on the main chain.
Issuance Rate:
-
Post-Merge, the issuance rate is based on staking rewards—approximately 1,700 ETH per day, or roughly 620,500 ETH annually (assuming stable staking participation). Although this is far lower than pre-Merge levels (13,000 ETH/day), current burn rates during low-activity periods remain insufficient to offset issuance.
Main Contributors to Burning:
Data indicates major sources of burns include:
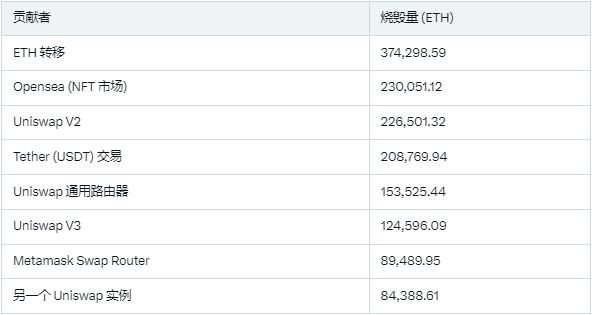
These platforms drive significant transaction volume, but their activity levels fluctuate with market conditions such as NFT trends and DeFi usage.
Market Conditions:
-
High-activity periods can achieve temporary deflation, while low-activity periods (such as Q2 2024, which saw a net increase of 75,301 ETH) revert to inflation. Data from Q2 2024 shows 228,543 ETH issued, 107,725 ETH burned, resulting in a net increase of 120,818 ETH.
Analysis of Ongoing Inflation
Ethereum’s current supply dynamics may be influenced by the following factors in the future:
The “Expectation Trap” in Technological Evolution
Limits in EIP-1559 Mechanism Design
Although the burn mechanism creates a new paradigm for value capture by destroying base fees, its effectiveness is constrained by nonlinear fluctuations in network activity. Data shows that after the 2024 Dencun upgrade, Layer 2 transactions accounted for over 83% of total volume, causing a 72% plunge in daily gas revenue on the mainnet.
Challenges in Sharding Implementation
The planned Pectra sharding upgrade, originally targeted for Q1 2025, was delayed due to ZK-Rollup compatibility issues, leaving TPS stuck in the 15–45 range and unable to support high-frequency transaction scenarios.
“Value Dissipation” in Ecosystem Competition
Diversification of Value Across Multi-chain Ecosystems
Solana, with 9,000 TPS and transaction costs of just $0.0001, captured 38% of the public blockchain market share in 2024. Its 2 million daily active users are 5.6 times that of Ethereum’s mainnet.
Structural Decline in DeFi and NFTs
Ethereum’s monthly NFT sales plummeted from a peak of $1.23 billion in 2023 to $125 million in 2025. Moreover, after Uniswap v4 fully migrated to L2s, DEX trading volume on the mainnet accounts for less than 9%. More critically, in the RWA (real-world assets) sector, institutions like BlackRock chose Polygon to issue tokenized funds, causing Ethereum to miss out on a trillion-dollar market entry point.
The Reflexivity Paradox in Economic Models
Misaligned Incentives in Staking Mechanisms
The post-Merge designed staking yield of 3.2% lost appeal amid a macroeconomic environment where the Federal Reserve benchmark interest rate reached 5.25%. Validator counts declined from 3.495 million to 3.4 million, and the staking ratio fell to 27%.
Asymmetric Effects of the Burn Mechanism
Data modeling shows that Ethereum needs to burn more than ~1,600 ETH per day to become deflationary. However, during market downturns, when daily active addresses drop to 360,000, only about 800 ETH are burned per day on average.
Structural Suppression from Regulatory Environment
The Shadow of Securities Classification
The SEC classified 75% of ERC-20 tokens as securities and banned ETH ETFs from participating in staking, directly causing a 22% year-on-year decline in institutional capital inflows. In contrast, Bitcoin, benefiting from its clear positioning as “digital gold,” attracted $30 billion in ETF inflows. This regulatory arbitrage gap has driven the ETH/BTC exchange rate to a historic low of 0.02.
Compliance Cost Pass-through Effect
To meet KYC/AML requirements, compliance upgrades such as account abstraction increased smart contract gas consumption by 27%, further suppressing network activity.
Conclusion: Blockchain’s Midlife Crisis
Ethereum’s deflation dilemma is essentially a microcosm of the collision between technological idealism and commercial realism. As ETH’s market capitalization share remains at a historic low of 17.5%, it reflects not only monetary policy imbalances but also the broader industry’s painful transition from “proof-of-concept” to “value creation.” The path forward may not lie in mechanically pursuing a deflationary model, but rather in building a new paradigm that balances efficiency, fairness, and regulatory sustainability. Just as Satoshi Nakamoto could not have foreseen the ETF frenzy when creating Bitcoin, Ethereum’s value discovery requires transcending existing frameworks and finding a dynamic equilibrium between technological ideals and market realities.
Join TechFlow official community to stay tuned
Telegram:https://t.me/TechFlowDaily
X (Twitter):https://x.com/TechFlowPost
X (Twitter) EN:https://x.com/BlockFlow_News