ETH/BTC exchange rate hits five-year low—does Ethereum stand a chance?
TechFlow Selected TechFlow Selected
ETH/BTC exchange rate hits five-year low—does Ethereum stand a chance?
This article will review on-chain and exchange data from the past week to provide an overview of the token trading landscape.
By Pzai, Foresight News
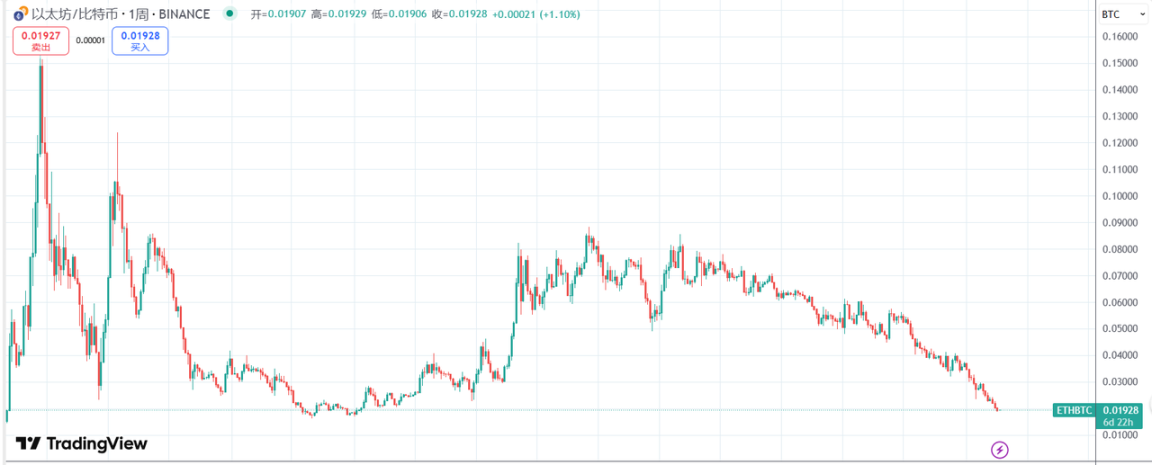
On April 14, the ETH/BTC exchange rate dropped to 0.01924, hitting its lowest level since January 2020. As a mainstream asset during the previous bull market, Ethereum's underperformance in this cycle has drawn criticism from many investors. Amid Bitcoin’s dominant performance this cycle, Ethereum appears to be undergoing a dual test of confidence and value. Some community members have pointed out: "Despite OM crashing 90% today, it has still outperformed ETH year-to-date." Meanwhile, large dormant whales on-chain have recently started stirring. This article reviews recent on-chain and exchange data to provide an overview of the current token trading landscape.
On-Chain Data: Signs of “Retreat”
In the past week, several whale addresses have been dumping into the market. According to Arkham data, an OG address cluster that initially purchased 100,000 ETH back in 2015 has cumulatively sold 4,180 ETH (worth approximately $7.05 million) on Kraken since April. Another address starting with 0x62A offloaded 4,482 ETH at an average price of $1,572 on April 12—also valued at $7.05 million. The continued price decline has triggered multiple on-chain liquidations. For example, one whale reduced their position by 35,881 ETH at an average of $1,562 on April 10, deleveraged, then sold another 2,000 ETH at $1,575. The address currently holds 688 ETH.
Since Bitcoin’s halving in 2024, Ethereum has underperformed BTC by 40%, marking the first time it has remained weak throughout an entire post-halving year. In contrast, the SOL/ETH exchange rate has risen 49% year-to-date, reaching 0.0817. This indicates that Solana continues to significantly outperform Ethereum in 2025. According to DeFiLlama, Ethereum’s DEX revenue over the last 24 hours was only $1.1 million, while its TVL has dropped from a peak near $80 billion to $46.9 billion—a nearly 50% decline. During the last cycle, Ethereum rose to become the second-largest asset thanks to advantages in new assets like NFTs and DeFi. However, as meme trading enthusiasm shifts to chains like Solana, Ethereum’s on-chain asset circulation has relatively slowed.

On-Chain Activity Metrics
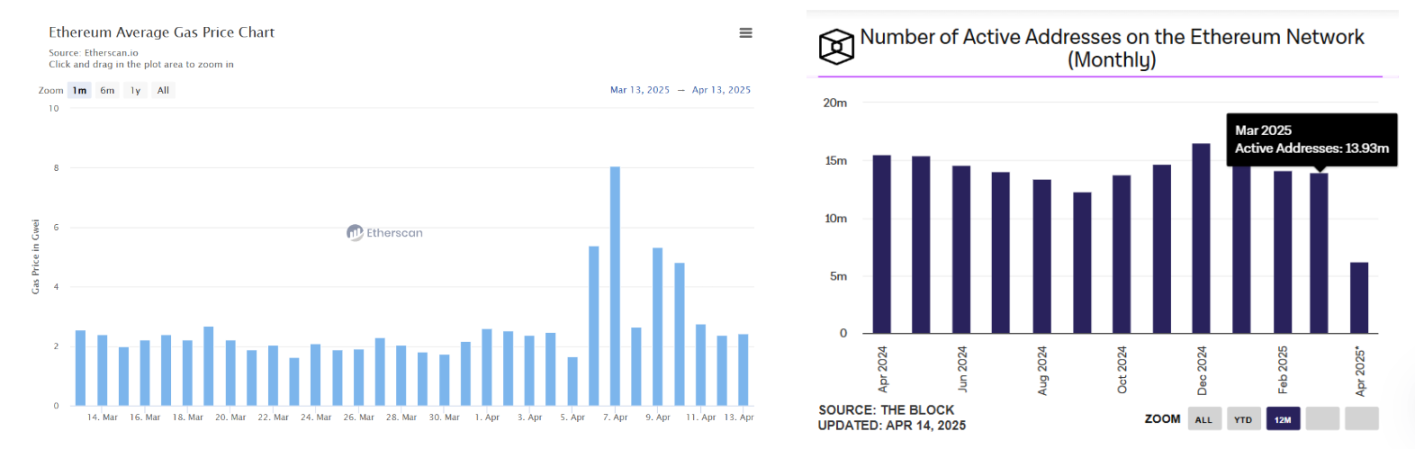
Over the past month—excluding the broader market downturn on April 7—Ethereum’s mainnet gas fees have remained around 2 Gwei, reflecting declining on-chain activity. Additionally, monthly active addresses on Ethereum have trended downward, falling below 15 million in March.
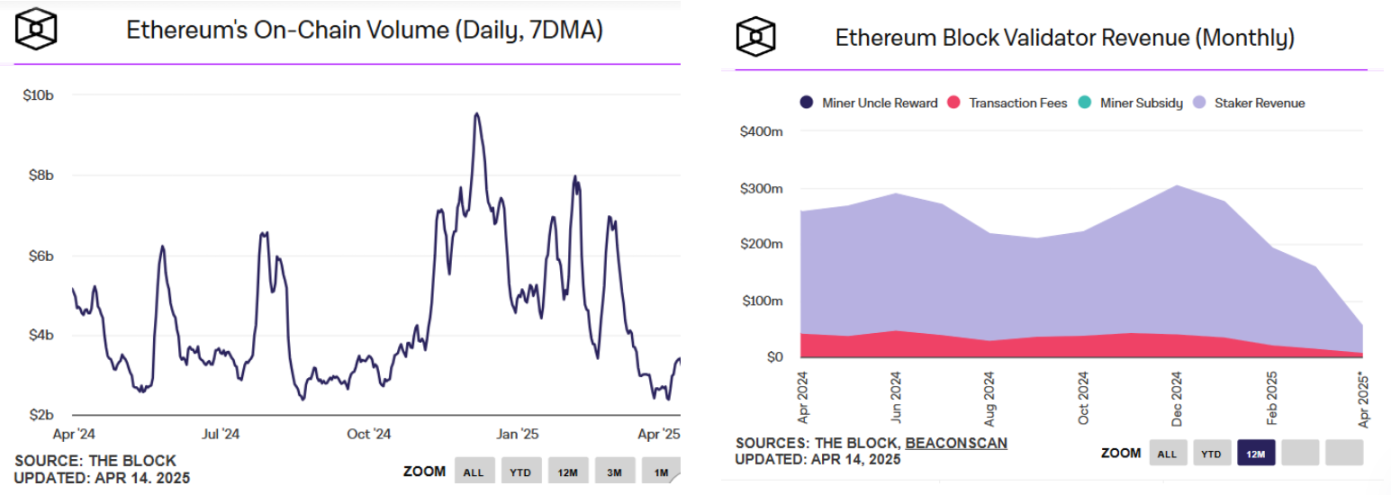
According to The Block, Ethereum’s daily on-chain transaction volume remains below $3 billion. Combined with price pressures, this led to monthly validator revenue on the mainnet dropping below $200 million in March. From a sentiment perspective, limited on-chain opportunities have led some investors to adopt a wait-and-see stance toward Ethereum’s short-term growth potential.
CEX and ETF Data
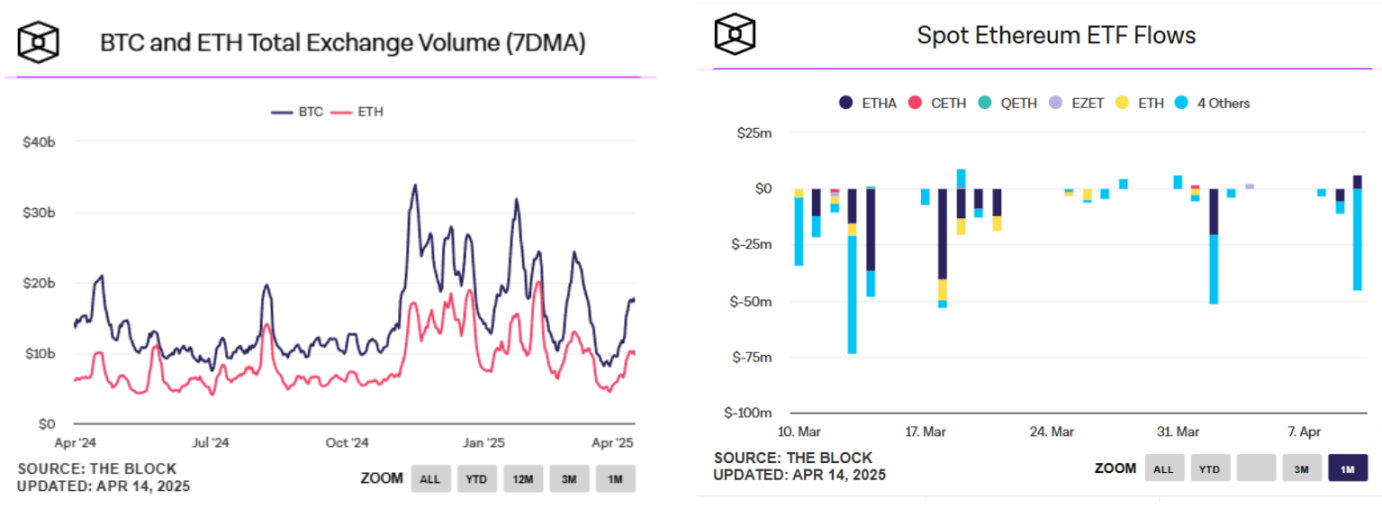
Exchange data shows Bitcoin’s trading volume peaks are significantly higher and more volatile, indicating that capital is increasingly flowing into Bitcoin spot and derivatives markets. Regarding ETFs, Ethereum spot ETFs have recorded outflows for multiple days over the past month, with single-day outflows reaching as high as $75 million. These diverging market performances highlight a clear split in risk appetite across crypto assets. Outflows from Ethereum spot ETFs reflect concerns about a slowdown in the pace of crypto ecosystem development—especially amid intensifying Layer 2 competition and new public chains diverting developer resources—prompting some institutional investors to shift focus elsewhere.
Macroeconomic Environment: Bitcoin Dominates, Ethereum Awaits Its Moment
In a market where Bitcoin acts as a “beta” to U.S. equities, Bitcoin’s share of total crypto market cap is gradually surpassing 60%, reaching 62.46% today. This highlights a clear “Bitcoin season,” with capital highly concentrated and altcoins broadly underperforming BTC. Moreover, the Crypto Fear & Greed Index remains in the “fear” zone, reflecting investor preference for safe-haven assets—of which Bitcoin is now the primary candidate. Furthermore, most U.S. state proposals regarding future strategic reserve programs include only Bitcoin as a reference asset, reinforcing its status as the leading crypto asset. If the ETH/BTC rate falls below 0.018 in Q2 2025, it could trigger further leveraged position liquidations, adding additional downward pressure on price.

Within the Ethereum ecosystem, the anticipated “Trump liquidity” is also drawing market attention. On March 25, the Trump family made a high-profile launch of USD1, a dollar-pegged stablecoin through World Liberty Financial (WLFI), initially issued on both Ethereum and BNB Smart Chain. As one of the stablecoins designed specifically for institutional liquidity, this inflow channel could provide substantial support to Ethereum. The current all-time low in ETH/BTC reflects the market balancing short-term risks (halving-driven capital draw, regulatory uncertainty) against long-term value (ecosystem innovation, market expectations). With key developments ahead—including the upcoming Pectra upgrade and account abstraction—and Vitalik’s vision of building Ethereum L1 into the core of a “world computer,” can we witness Ethereum’s resurgence? Only time will tell.
Join TechFlow official community to stay tuned
Telegram:https://t.me/TechFlowDaily
X (Twitter):https://x.com/TechFlowPost
X (Twitter) EN:https://x.com/BlockFlow_News