









Besides the Federal Reserve's interest rate cuts, another key data point will determine the future of the crypto market.
TechFlow Selected TechFlow Selected
Besides the Federal Reserve's interest rate cuts, another key data point will determine the future of the crypto market.
In addition to closely monitoring the U.S. monetary easing, it is equally important to pay attention to changes in domestic financial data.
 Navigating Web3 tides with focused insights
Author: Blockchain Knight
After a turbulent week of fluctuating tariff tensions, markets finally had some breathing room over the weekend. However, it remains uncertain how long this respite will last, as tariff issues are event-driven incidents that trigger risk-off behavior and temporary sentiment collapse, resulting in high volatility.
Yet once the market confirms any fundamental shifts caused by tariffs and risk aversion subsides, global financial markets can find a new equilibrium. This is why global equities—especially U.S. stocks—closed Friday with gains, ending a volatile week on a positive note. We can observe this trend through changes in the S&P 500’s volatility index (VIX).
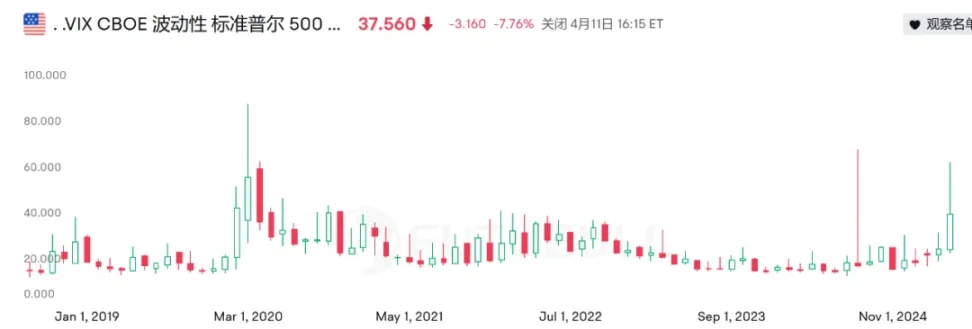
The VIX spiked to a recent high last week. The only comparable extremes in the past few years were Japan's central bank rate hike incident and the 2020 pandemic-induced financial turmoil. This explains the unusually large market swings seen over the past week—truly rare in history.
Now that this period of extreme volatility has temporarily subsided, attention returns to the familiar drivers of crypto market movements: "inflation" and "interest rate cuts." Only rate cuts can unleash a flood of liquidity—the so-called “water flooding金山”—which offers hope for growth in risk assets like BTC.
By comparing the past decade’s trends in global broad money supply (M2) against BTC price movements, we can clearly identify this correlation. As shown below, BTC’s massive gains over the last ten years have been built upon an explosion in global M2, and this relationship is stronger than with any other financial metric.
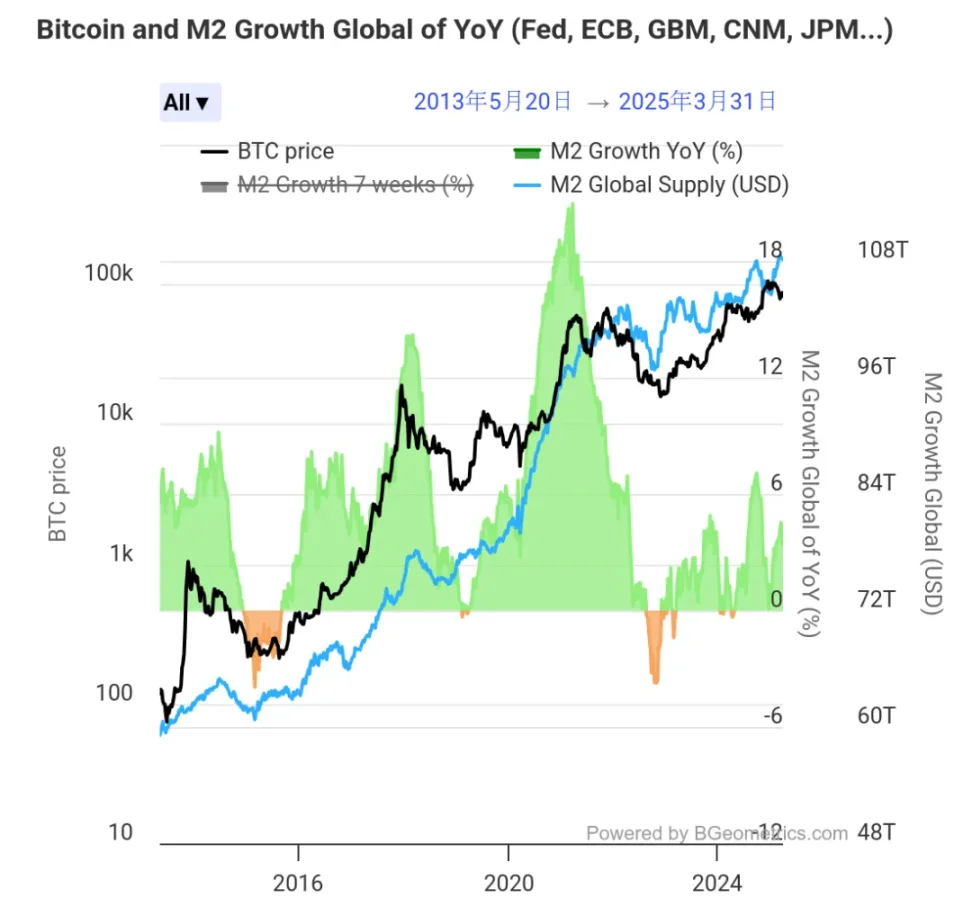
This is why BTC tends to react whenever the U.S. releases inflation or rate decision data—it ultimately affects whether new capital can flow into the crypto space.
However, while most in the crypto market are currently focused solely on the Federal Reserve’s rate cut trajectory, another critical indicator is being overlooked: PBOC asset size, or China’s central bank balance sheet, which reflects domestic monetary liquidity conditions.
While everyone watches financial developments on the West Coast, they neglect our own liquidity dynamics. Yet these are equally significant given China’s status as a global economic powerhouse.
The chart below illustrates BTC’s performance across its past three cycles alongside changes in PBOC asset size. The correlation is evident—nearly every major BTC rally coincides with expansion in PBOC assets, aligning closely with the four-year cycle pattern.
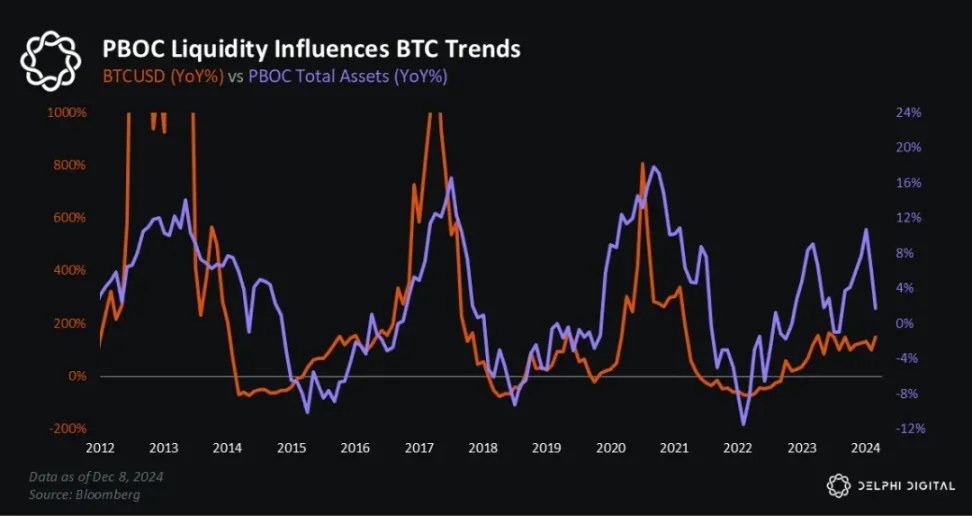
PBOC liquidity played a role during key phases: the 2020–2021 crypto bull run, the 2022 bear market, the recovery from cycle lows between late 2022 and early 2023, the surge in Q4 2023 (before BTC ETF approval), and the pullback from Q2 to Q3 2024.
Similarly, in the months leading up to the 2024 U.S. election, PBOC liquidity turned positive again, contributing to an “election bull run.”
Interestingly, as shown in the next chart, PBOC balance sheet expansion began declining after September 2024, bottomed out by year-end, and has since rebounded to a one-year high. Historically, shifts in PBOC liquidity tend to precede major moves in BTC and broader crypto markets.
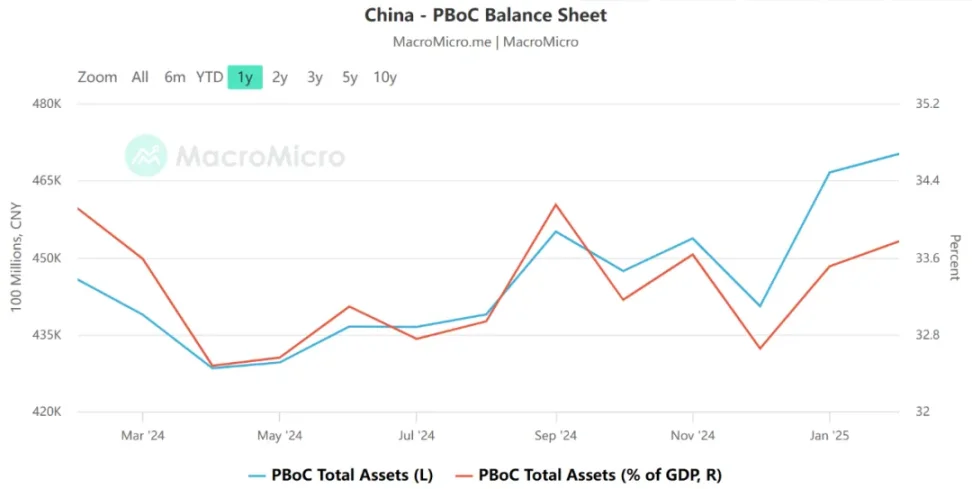
Notably, during the 2017 BTC bull market, the Fed was not easing but instead raised rates three times and maintained quantitative tightening. Yet risk assets like BTC still performed strongly that year—because PBOC balance sheet expansion hit a record high.
In fact, even the S&P 500’s performance shows some correlation with PBOC liquidity. Historical data from 2015 to 2024 shows an annual correlation coefficient of approximately 0.32 between PBOC total assets and S&P 500 returns.
To some extent, this short-term correlation is amplified because the timing of PBOC’s quarterly monetary policy reports overlaps with FOMC meetings.
In summary, while monitoring U.S. monetary easing remains crucial, domestic financial data—particularly PBOC liquidity—deserves equal attention. Just a week ago, news emerged stating: “Monetary tools such as reserve requirement ratio cuts and interest rate reductions have ample room for adjustment and could be introduced at any time.” Our task now is to track this evolution.
Worth noting: as of January 2025, China’s total deposits reached $42.3 trillion, compared to about $17.93 trillion in the U.S. In terms of deposit scale alone, China holds greater financial potential. Should liquidity improve, meaningful shifts may follow.
Another point worth discussing: even if liquidity increases, will it actually flow into crypto markets, given existing restrictions? On this front, Hong Kong has already provided an answer. Policy flexibility and accessibility today are far greater than just a few years ago.
To conclude this week’s commentary, borrowing a famous quote from Lei Jun: “When the wind blows, even pigs can fly.” Riding the wave beats swimming against the current. Beyond waiting, what we must do is climb boldly when the wind rises—and soar.
Join TechFlow official community to stay tuned
Telegram:https://t.me/TechFlowDaily
X (Twitter):https://x.com/TechFlowPost
X (Twitter) EN:https://x.com/BlockFlow_News










