WOO X Research: Panic Index Surges, How to View Its Correlation with Risk Assets?
TechFlow Selected TechFlow Selected
WOO X Research: Panic Index Surges, How to View Its Correlation with Risk Assets?
The tariff war has begun, and the VIX briefly surged past 60.
In 2025, the tariff war escalated comprehensively as the Trump administration announced a minimum 10% tariff on goods from nearly all countries, with additional higher tariffs imposed on about 60 nations experiencing the largest trade imbalances with the U.S., triggering global market panic. The primary logic is:
-
Tariffs increase corporate costs and squeeze profit expectations
-
Disrupt global supply chains, deepening economic uncertainty
-
Trigger retaliatory tariffs, expanding risks of a broader trade war
Under such conditions, capital market participants will:
-
Reduce allocations to risk assets (e.g., equities, cryptocurrencies)
-
Increase allocations to safe-haven assets (e.g., gold, U.S. dollar, Japanese yen)
-
Increase volatility expectations → VIX surges
Tariffs → Rising costs + Disrupted global supply chains + Retaliation risks + Investment pullback + Safe-haven capital flows → Market panic
The fear index VIX spiked to 60 on April 7, what does this mean? Historically, this has only occurred three times—the last time being August 5, 2024, and the first during the 2020 pandemic.
We can confirm that the current VIX level has entered an extreme historical environment. In such circumstances, how can we use VIX to anticipate market movements?
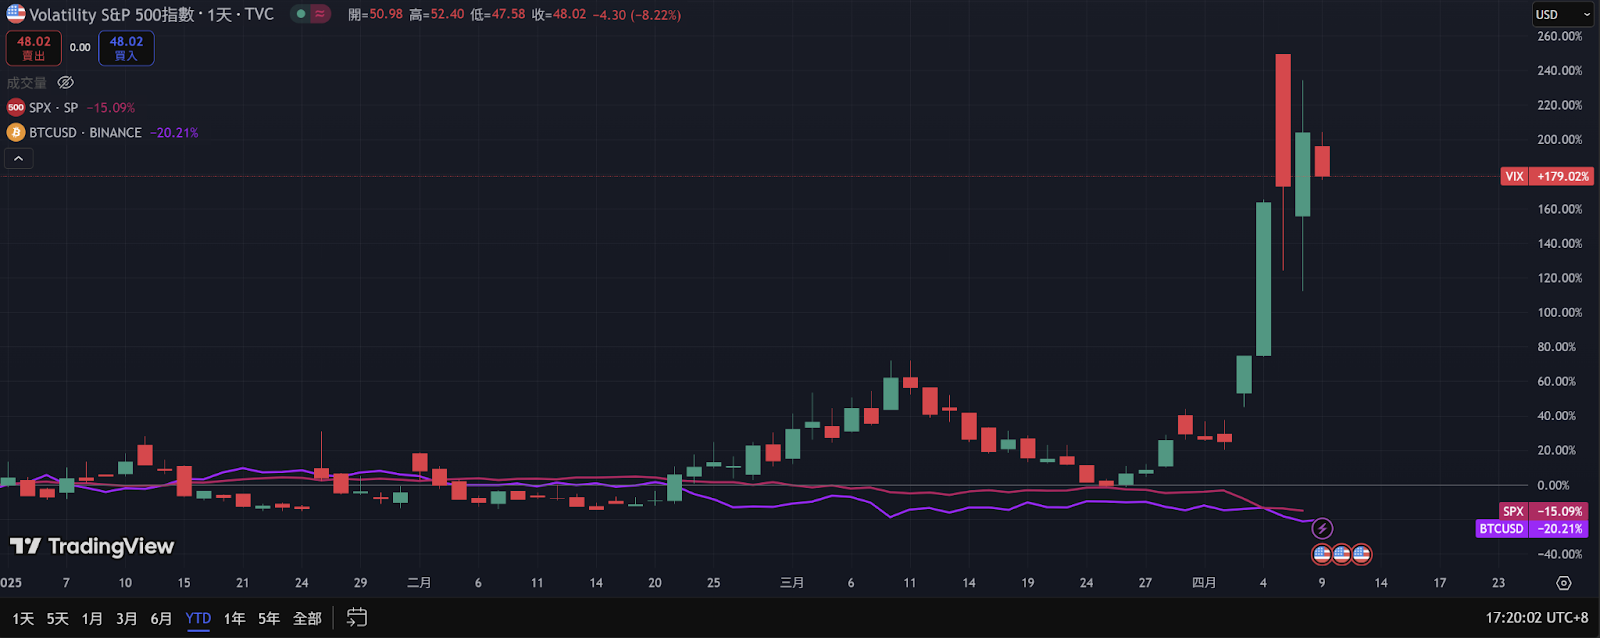
Source: Tradingview
What is VIX?
VIX measures the expected market volatility over the next 30 days, derived from S&P 500 index options prices. It is widely regarded as an indicator of market uncertainty and investor fear.
In simple terms, a higher VIX indicates greater anticipated market volatility and stronger fear sentiment, while a lower VIX reflects market calmness and higher confidence. Historical patterns show that VIX tends to spike during sharp equity sell-offs and decline when markets stabilize. Due to its inverse relationship with stock markets, VIX is often called the "fear index" or the market's emotional thermometer.
The normal VIX range is below 15–20, representing a calm market; when VIX exceeds 25, it signals clear market fear; above 35 indicates extreme fear. During extreme crises—such as financial meltdowns or pandemics—VIX can surge beyond 50, reflecting intense safe-haven demand. Therefore, monitoring VIX helps investors gauge prevailing fear levels and adjust their investment strategies accordingly.
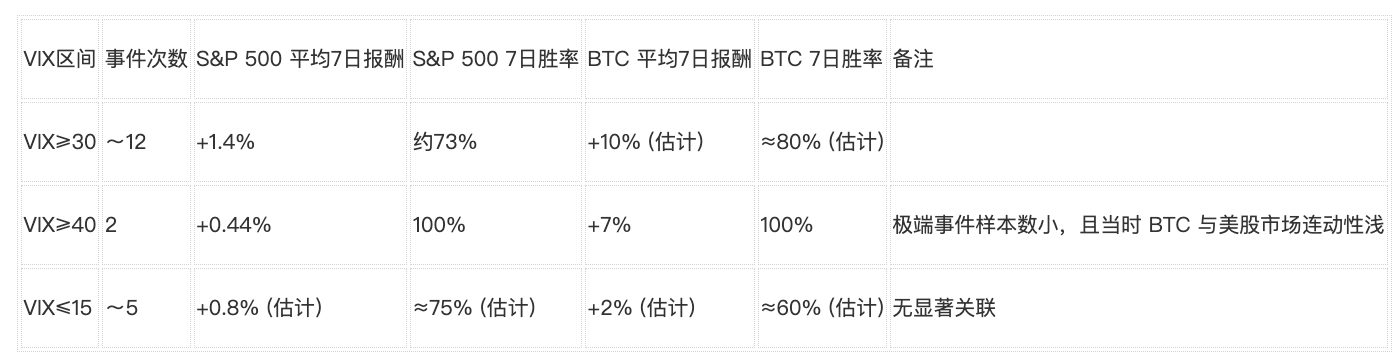
High Volatility / Fear Zone: VIX ≥ 30
When VIX rises above 30, it typically signifies a high fear or panic phase in the market. Such situations are often accompanied by sharp equity declines. However, historical data shows that after episodes of extreme fear, markets tend to rebound.
-
Sample Events: Between 2018 and 2024, there were over ten instances where VIX closed above 30 for the first time, including the February 2018 volatility shock, the December 2018 Christmas Eve selloff, the February–March 2020 pandemic panic, the January 2021 retail investor frenzy, and early 2022 rate hikes combined with geopolitical tensions.
-
S&P 500 Average Performance: Within seven days following these fear events, the S&P 500 tended to post positive rebounds. On average, it gained about 1.4%, with approximately 73% probability of rising one week later.
This suggests that when VIX spikes above 30 (into the fear zone), equities often experience short-term technical rebounds.
-
BTC Average Performance: Bitcoin also tends to stage strong rebounds after extreme fear events. Historical data estimates an average 7-day gain of around 10%, with a win rate of roughly 75–80%. For example, in February 2022, when VIX rose above 30 due to a geopolitical crisis, BTC surged over 20% in the following week, showing a similar pattern of rebound as fear subsides.
Extreme Panic Peak: VIX ≥ 40
Raising the threshold further, VIX ≥ 40 (extreme fear) was extremely rare between 2018 and 2024. Only two cases met this criterion: February 5, 2018, and February 28, 2020, when pandemic fears caused VIX to close above 40 (the first time in four years). Subsequently, VIX soared to an unprecedented 82 in March 2020.
Due to the limited sample size, statistical results are only indicative: After the 2020 event, the S&P 500 saw a slight recovery of about 0.6% within seven days (a volatile week but modest technical bounce), while BTC rebounded approximately 7%. Both had a 100% success rate, but this was solely due to a single event (not guaranteeing future outcomes). Overall, when VIX reaches historic extremes above 40, it often means panic-driven selling pressure is near its peak, increasing the likelihood of a short-term rebound. From a macro perspective, these periods often mark relatively low entry points.
-
February 5, 2018 (VIX intraday surged over 100% to nearly 50): S&P 500 rose only 0.28% a week later, showing no significant lift. However, Bitcoin plunged 16% that day, hitting a local low near $6,900, then recovered to over $11,000 within two weeks, indicating strong rebound momentum. However, at that time, Bitcoin’s correlation with real-world assets was weak, making VIX an inappropriate signal for BTC price direction.
-
Mid-March 2020 (VIX peak at 82): S&P 500 bottomed on March 23 and rebounded over 10% within a week; Bitcoin also surged about 30% from below $4,000.
Although short-term performance post-extreme fear tends to be positive statistically, the small sample size implies high uncertainty. Moreover, Bitcoin’s correlation with U.S. equities was not as strong then as it is today. Practically speaking, VIX above 40 mainly serves as a signal confirming extreme fear, while future direction still requires fundamental analysis.
Low Volatility Zone: VIX ≤ 15
When VIX drops below 15, the market is generally considered calm. Investor sentiment is optimistic, and safe-haven demand is low. However, subsequent market behavior in this range is less consistent than during high-VIX periods:
-
Sample Events: Between 2018 and 2024, VIX fell below 15 multiple times—for example, after the strong equity rally in early 2019, during the stable market period at the end of 2019, during the bull run in mid-2021, and in mid-2023. These periods were marked by historically low volatility (sometimes described as market complacency).
-
S&P 500 Average Performance: Within seven days after VIX dropped into this low range, the S&P 500 averaged a return of about +0.8%, with a win rate of roughly 60–75% (slightly above random chance). Overall, in low-volatility environments, indices tend to rise gradually or trade sideways. For instance, after VIX dipped below 15 in October 2019, the S&P 500 held steady and slightly advanced the following week. In July 2023, with VIX around 13, the index continued a slow climb of about 2% the next week. This suggests that low VIX does not necessarily trigger an immediate pullback—markets may continue rising for some time. However, caution is warranted: extremely low volatility may reflect investor complacency, and any sudden negative news could trigger sharp volatility and larger drawdowns.
-
BTC Average Performance: Bitcoin’s performance during low VIX periods lacks a clear directional pattern. Data shows an average 7-day gain of only about +2%, with a win rate of approximately 60%. Sometimes, low VIX coincided with BTC’s own bull runs (e.g., spring 2019, when BTC surged amid low VIX); other times, BTC declined even as VIX remained low (e.g., early 2018, when BTC was collapsing from a bubble).
Therefore, low VIX offers limited predictive value for BTC’s future moves, requiring additional consideration of crypto-specific funding sentiment and market cycles.
In summary, when VIX is below 15, the S&P 500 typically continues its prevailing trend (usually gradual upward movement), though both gains and win rates are significantly lower than those seen after panic-driven rebounds. Meanwhile, BTC shows no consistent reaction pattern under such conditions, indicating that low traditional market volatility doesn’t necessarily imply synchronized crypto market behavior.
Conclusion: Risk and Opportunity Coexist – Rigid Application is Only for Reference
When VIX surges into the 30–40 range
-
Short-term risks exist, but potential reversal opportunities emerge.
-
BTC usually falls alongside panic-driven selling, but as fear eases, oversold positions may trigger strong technical rebounds.
-
If VIX begins to peak and retreat (gradually falling from 35 back below 30), it may present a potential opportunity to buy BTC on a short-term basis.
-
However, the severity of the underlying event must be assessed—should a major financial crisis unfold, further downside remains possible.
When VIX ≥ 40
-
Indicates the market has entered a state of extreme panic, potentially involving liquidity drying up and massive fund withdrawals.
-
BTC faces a very high probability of sharp short-term declines, but if panic begins to ease within one or two weeks, BTC’s rebound could be exceptionally strong.
-
In such environments, short-term traders should maintain strict risk control and stop-loss discipline, as “playing on the edge” involves both high reward and high danger.
-
From a long-term cycle perspective, these are often relatively low points.
When VIX ≤ 15
-
The market is generally in a neutral state. Whether BTC rises depends more on its own market cycle, funding dynamics, or technical trends.
-
During overly calm periods, watch out for sudden shocks or black swan events that could rapidly push VIX higher, causing BTC to correct sharply afterward.
-
Consider holding some cash/stablecoins in reserve during such times, ready to respond to shifting risk conditions.
The Intermediate Range: VIX 15–30
-
This range is generally seen as “normal volatility.” BTC remains influenced by its own crypto cycle and macro liquidity, with VIX serving as a supplementary indicator.
-
If VIX climbs from above 20 toward 30, rising fear is emerging, warranting moderate risk management. Conversely, if VIX gradually falls from 25 back below 20, fear is dissipating, suggesting BTC may perform more steadily.
At the time of writing, VIX stands at 50. Amid ongoing uncertainty surrounding U.S. tariffs, market sentiment remains in extreme panic. Yet, as history shows, new market rallies are often born in despair.
During the 2020 pandemic, VIX briefly exceeded 80. At that time, the S&P 500 traded around 2,300. Even after recent panic-driven declines, it still hovers near 5,000—a more than 100% return over five years. Meanwhile, Bitcoin presented a prime buying opportunity at just $4,800. That bull run eventually peaked at $110,000—an almost 25-fold increase.
Every major downturn brings market repricing and capital reallocation. Chaos is merely a ladder—whether one can climb it determines success during such turbulent times.
Join TechFlow official community to stay tuned
Telegram:https://t.me/TechFlowDaily
X (Twitter):https://x.com/TechFlowPost
X (Twitter) EN:https://x.com/BlockFlow_News