Bitcoin hovers around the 100,000 mark—six dimensions to analyze which stage of the bull market we're in?
TechFlow Selected TechFlow Selected
Bitcoin hovers around the 100,000 mark—six dimensions to analyze which stage of the bull market we're in?
Greed index nears historical peak, technical indicators such as MVRV and ahr999 approach levels seen in November 21 and March 24, while other dimensions remain mid-cycle.
Author: Nanzhi, Odaily Planet Daily
In the previous article titled "Reviewing Four Years of Market Data: Which Phase of the Bull Market Are We In?", we identified funding rate, active buy volume, and total trading volume as effective leading indicators based on four years of market data starting from 2020. However, these three metrics have delivered two conflicting conclusions: the funding rate suggests that the market has just transitioned from a calm period into a slightly FOMO-driven phase, while active buy volume and total trading volume have already hit record highs, signaling a potential top.
The author believes this divergence stems primarily from the rising popularity of Bitcoin spot ETFs and "MicroStrategy-style" accumulation strategies. These capital inflows originate outside traditional crypto circles and continue to drive up Bitcoin's price and trading volume. At the same time, their trading activities are largely isolated from centralized exchanges like Binance and employ fundamentally different leverage mechanisms, causing a decoupling between funding rates and price movements.
Therefore, this article aims to explore our current position within the bull market using other more universal, intuitive, and historically reliable indicators.
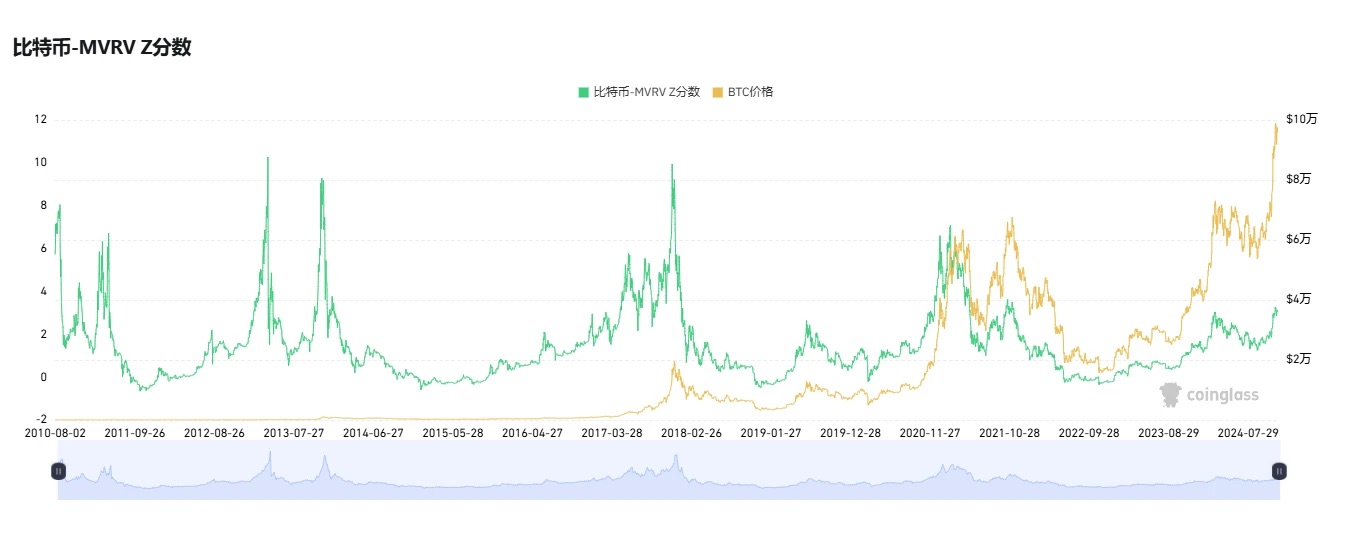
MVRV-Z Score
MVRV (Market Value to Realized Value) is an algorithm used to assess whether the market is overvalued or undervalued by comparing Bitcoin’s current market cap with its realized value.
Market cap refers to circulating market capitalization, while realized value sums up the last movement price for each Bitcoin. For example, if 100,000 BTC were last transferred three years ago at a price of $65,000, this would be recorded as 100,000 × $65,000. The total realized value is calculated similarly across all coins, and MVRV is derived by dividing market cap by realized value.
The MVRV-Z score is calculated as (Circulating Market Cap - Realized Value) ÷ Standard Deviation of Circulating Market Cap. This method filters out short-term price noise and is better suited for capturing extreme market sentiment.
According to Coinglass, the current MVRV-Z value stands at 3.2—approaching the peak seen in November 2021, though still far from the levels reached in the first half of 2021 and late 2017.
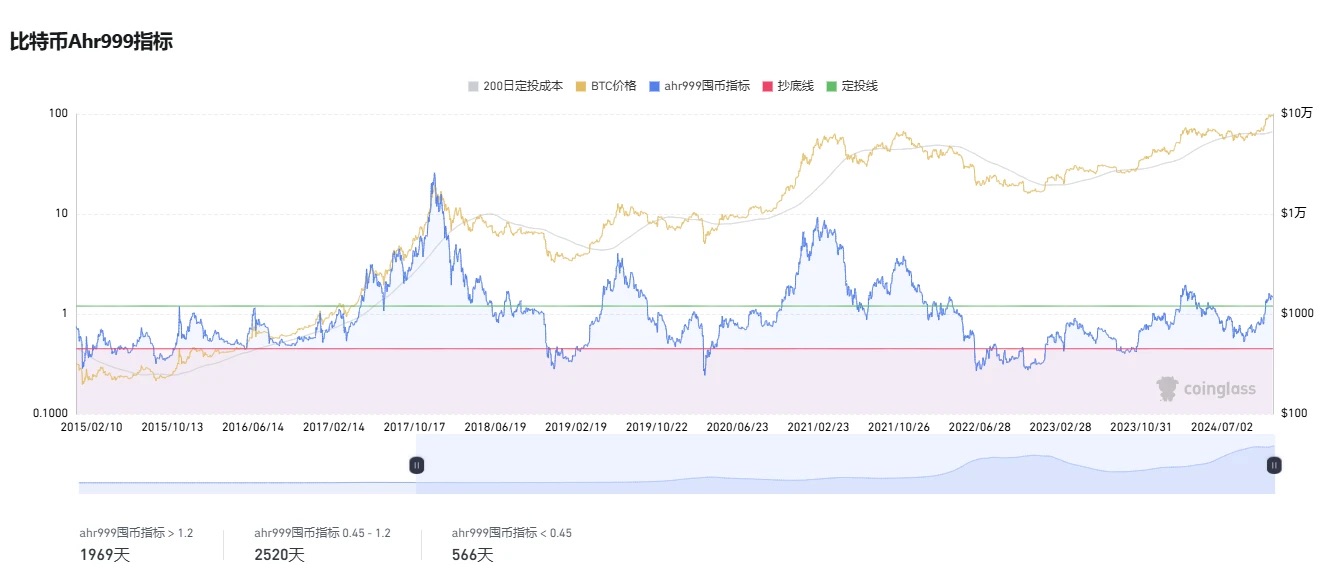
AHR 999 Index
The Bitcoin AHR 999 Index was proposed in 2018 by user ahr999 as a guidance parameter for long-term holding. Based on historical statistics shared by ahr999, the index falls below 0.45 about 8.5% of the time—defined as the ideal accumulation zone; remains between 0.45 and 1.2 for 46.3% of the time—considered the dollar-cost averaging range; and exceeds 1.2 for 29.3% of the time—indicating a pause-investment, wait-and-see phase.
As reported by Coinglass, the current index value is 1.49, relatively close to the high of 1.75 reached in March this year, but still significantly lower than the two peaks of 6 and 3.4 observed in 2021.
PlanB: Bitcoin Will Rise to $150,000 in December
PlanB and his Stock-to-Flow model (S2F) gained legendary status during the 2019–2021 bull run for successfully predicting Bitcoin reaching $55,000 in early 2021. However, the model began deviating in the second half of 2021 and completely failed in 2022.
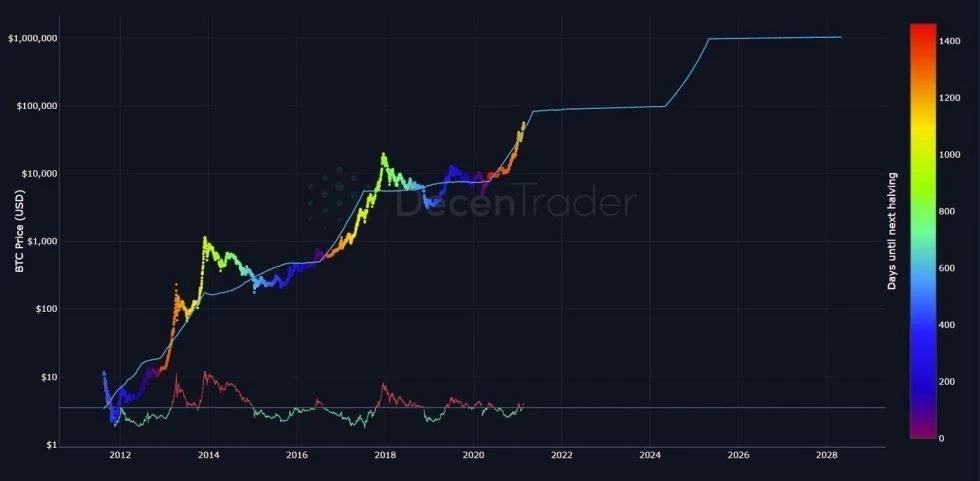
With Bitcoin once again leading the broader market rally, PlanB has re-emerged. Yesterday, PlanB posted on X stating that according to his forecast published at the end of September regarding Bitcoin’s price trajectory over the coming years, BTC has already nearly achieved the first two targets: rising to $70,000 in October and $100,000 in November (reaching $99,800, close enough). The next target is for Bitcoin to rise to $150,000 in December.
Interest Rate Cut Cycle
In the article "Summarizing 35 Years of U.S. Interest Rate Cycle Patterns: Can the Rate Cuts 36 Days Away Trigger Bitcoin’s Second Bull Run?", the author analyzed the performance of U.S. stocks and gold across five previous U.S. rate cut cycles over the past 35 years. The conclusion was that rate cuts themselves are not the fundamental driver behind market movements—their impact depends on the broader economic context. Whether rate cuts are proactively implemented to stimulate growth or forced by black swan events makes a crucial difference. From the perspective of U.S. equities, it reflects a tug-of-war between economic resilience and liquidity expansion pricing.
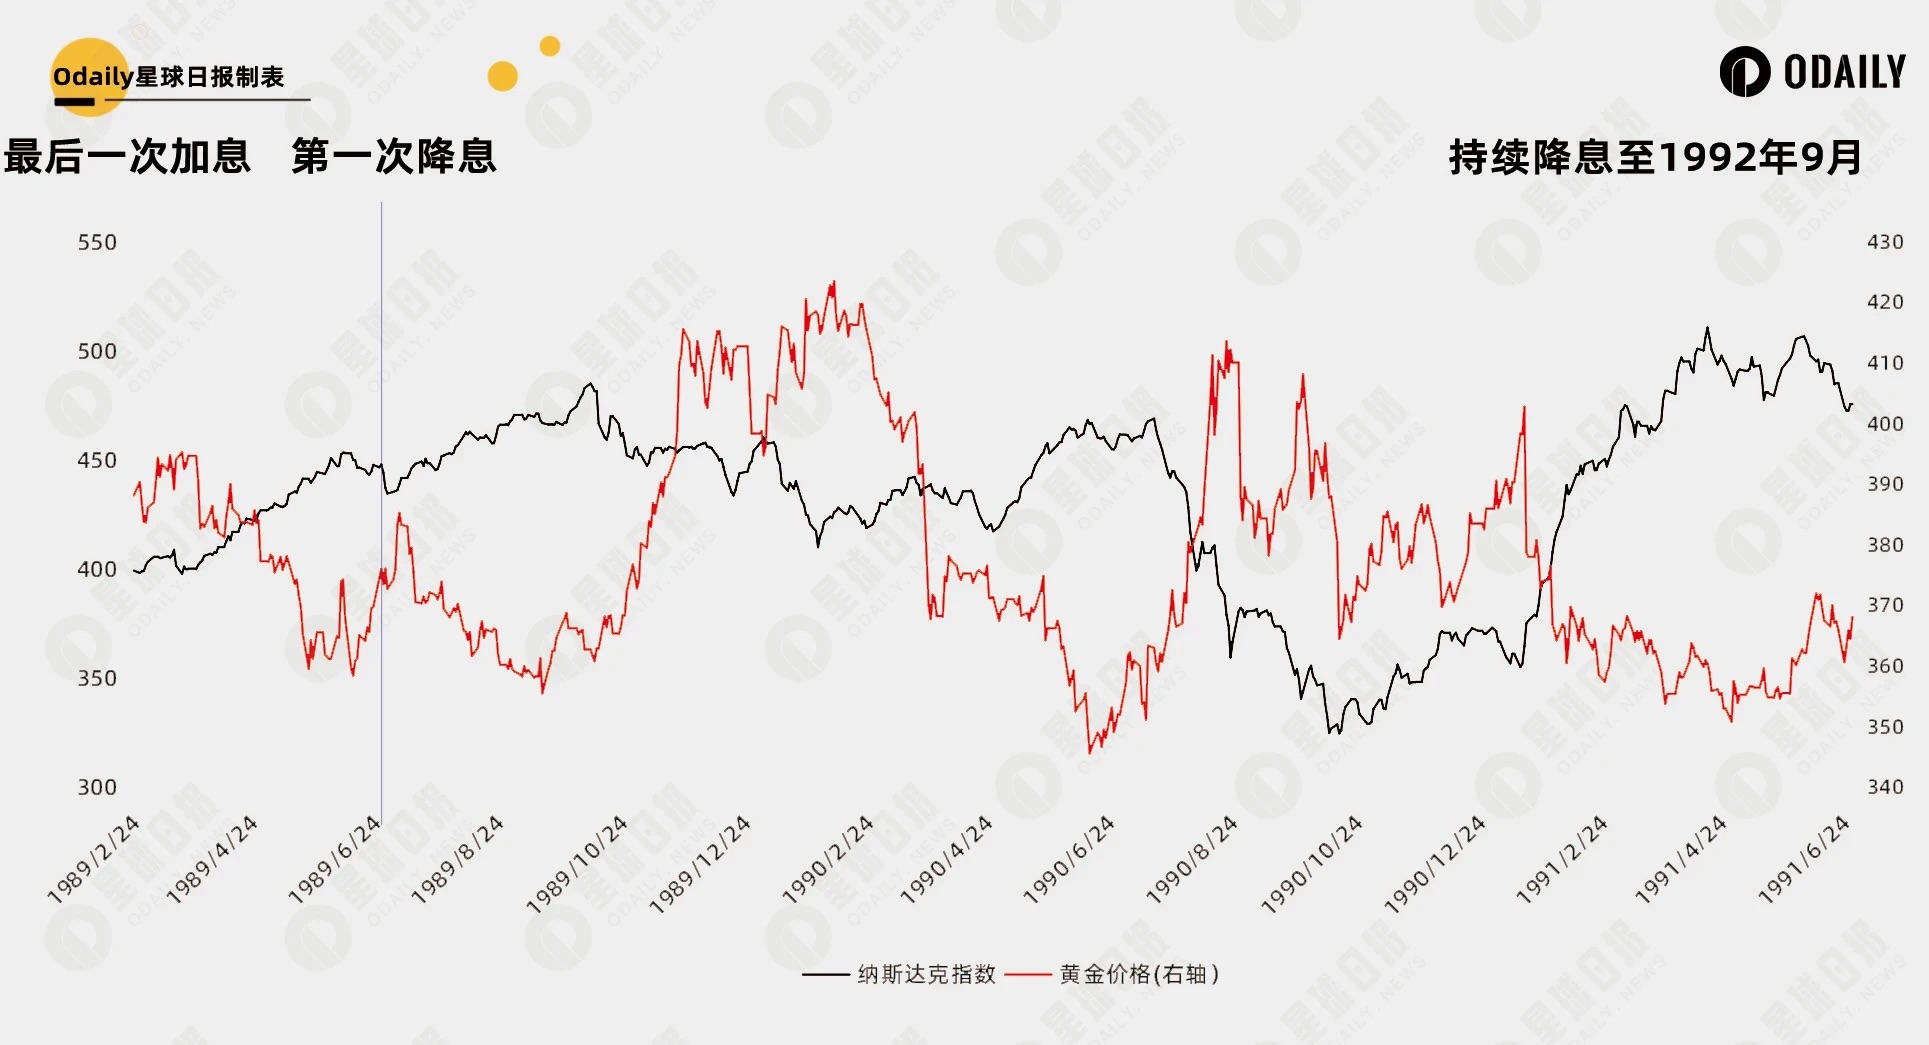
If drawing a direct historical comparison, the current environment most closely resembles the 1989 rate cut cycle. At that time, the U.S. had undergone seven years of economic expansion and faced high inflation pressures in 1988–1989, which were countered by aggressive rate hikes—peaking near 10%. Over the following three years, the Fed embarked on a sustained easing cycle, cutting rates from 9.75% on February 24, 1989, down to 3.00% on September 4, 1992.
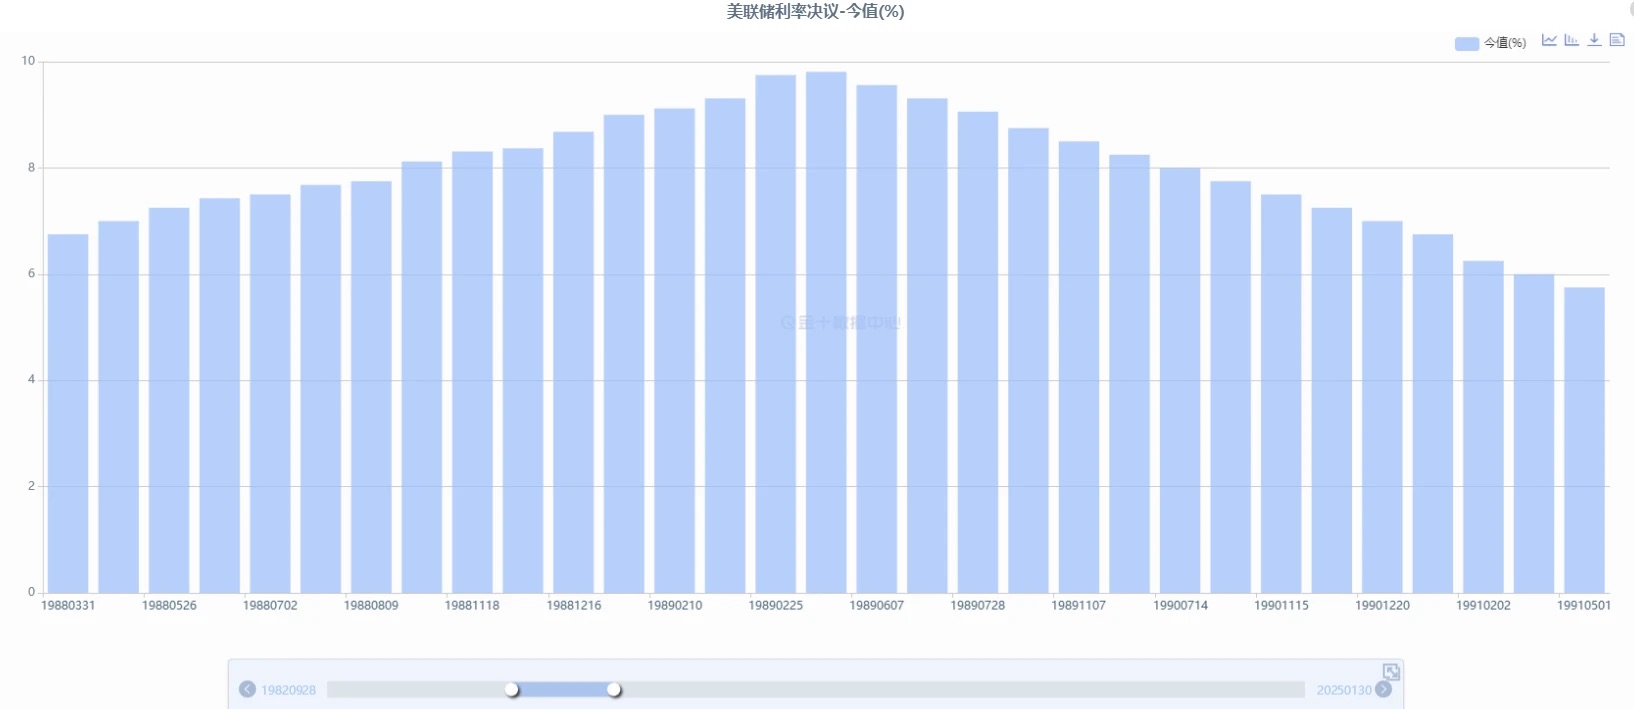
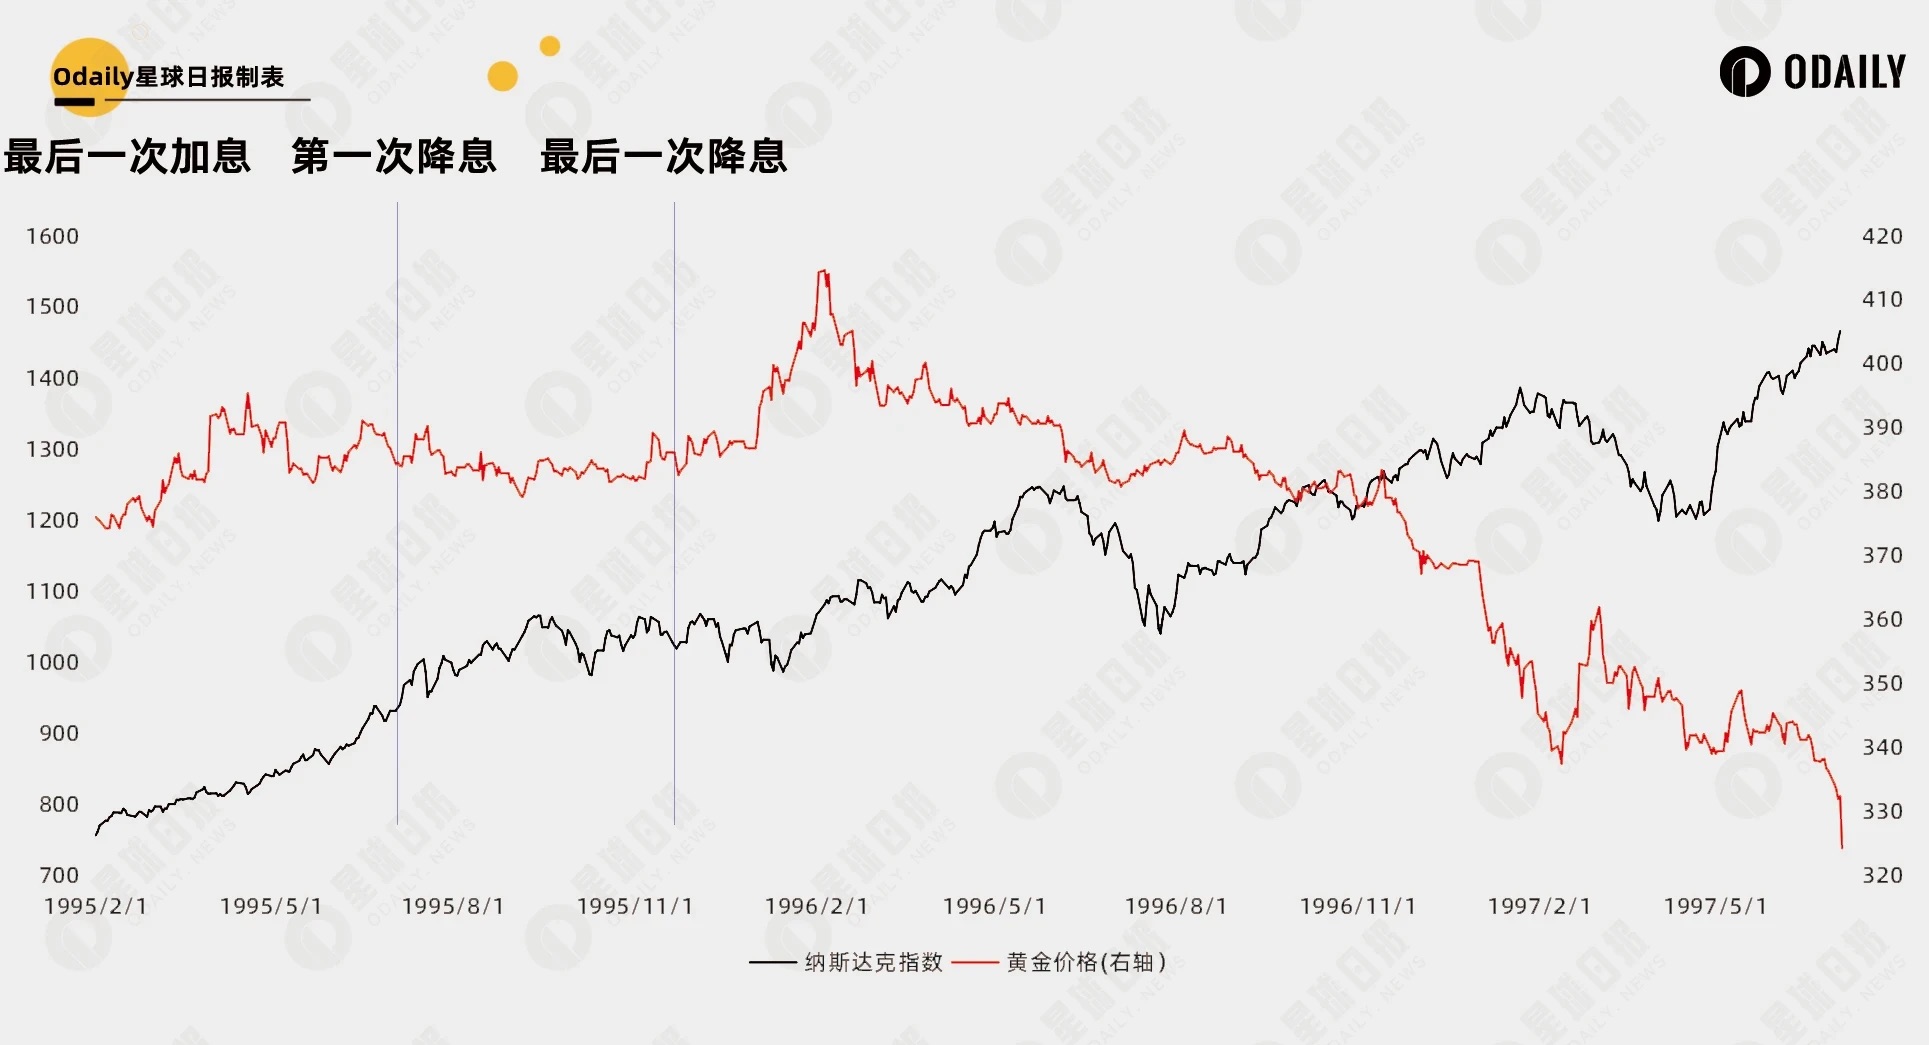
According to the dot plot released in September, the Federal Reserve is expected to reduce interest rates by approximately 2% over the next two years from the current 4.75%. How did markets perform historically after such cuts? Two distinct phases can be identified: 1989 and 1995. During the initial three-year easing cycle, U.S. equities remained volatile. After pausing rate cuts in 1992 and maintaining stable rates for two years, followed by a brief preventive hike in 1994 without further major adjustments, the U.S. stock market entered a prolonged bull run. Therefore, from a macroeconomic fundamentals standpoint, we remain in the early to mid-stages of the cycle.
Other Classic Indicators
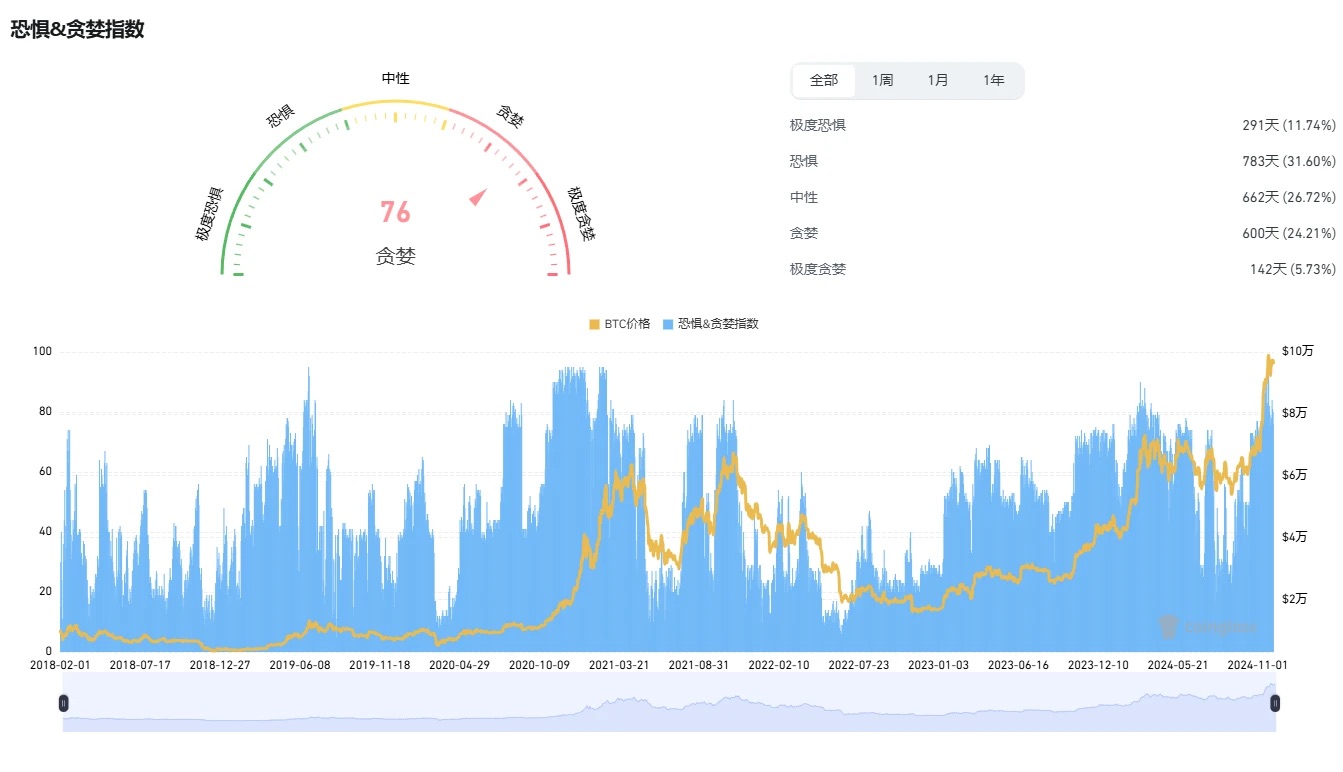
Fear & Greed Index
The current Greed Index stands at 76, down slightly from its recent peak. The highest level was 94 on November 22, when Bitcoin traded at $95,829. This greed level surpasses those seen in November 2021 and March 2024, matching the peak of 95 recorded in February 2021.
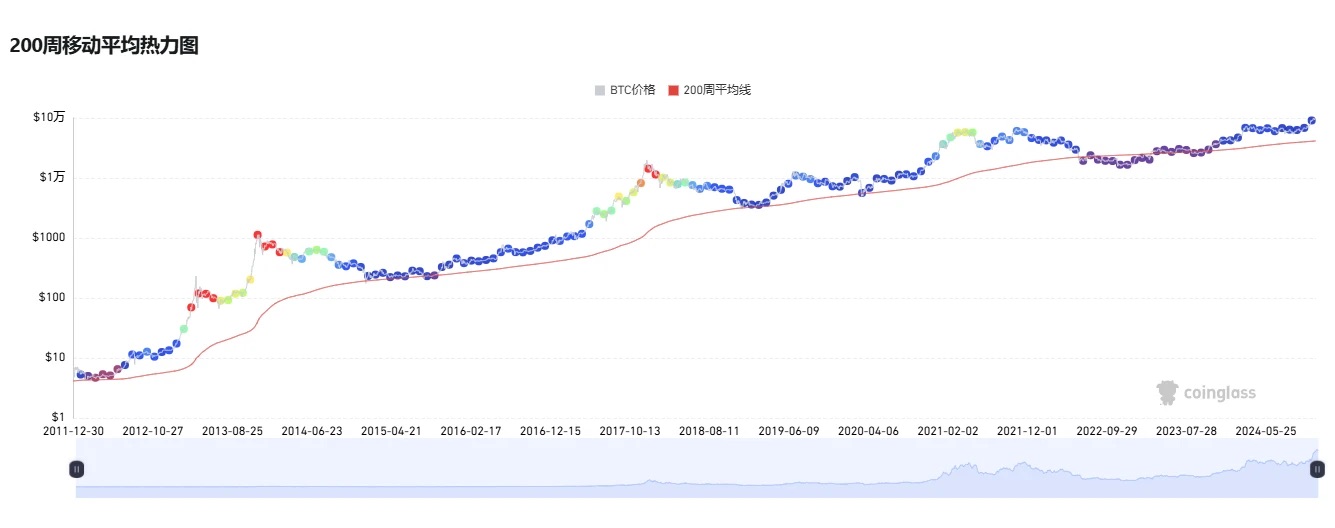
200-Week Moving Average
Historically, Bitcoin prices tend to bottom near the 200-week moving average, while significant deviations above this line often signal market tops. At the 2021 peak, Bitcoin’s price was about four times the 200-week average. Currently, it is roughly double (96,500 vs. 41,500), indicating a relatively low level compared to previous cycles.
Join TechFlow official community to stay tuned
Telegram:https://t.me/TechFlowDaily
X (Twitter):https://x.com/TechFlowPost
X (Twitter) EN:https://x.com/BlockFlow_News