Think of danger in times of peace: A review of Bitcoin bull market downturns
TechFlow Selected TechFlow Selected
Think of danger in times of peace: A review of Bitcoin bull market downturns
The most severe drawdowns often occur at the tail end of a bull market.
 Navigating Web3 tides with focused insights
By: David Canellis
Translation: Baihua Blockchain
We've long learned to accept Bitcoin's wild volatility.
It seems we’ve grown accustomed to the expectation that even during a powerful bull run, sharp pullbacks are inevitable—shattering our hopes, dreams, and wallet balances alike.
So it’s entirely understandable to imagine Bitcoin suddenly plunging 50% on its way to six figures or beyond.
But is this expectation justified?
First, it’s important to clarify: Bitcoin does have a “tradition” of dropping roughly 80% from bull market peaks to bear market troughs. Since its first major rally in 2011, nearly every cycle has followed this pattern.
However, this article isn’t about drawdowns during bear markets (for that, see our earlier analysis). Instead, we’re focusing on pullbacks that occur within bull markets—exactly the kind we’re experiencing now.
The chart below shows Bitcoin’s price performance across six different timeframes, ranging from three days to three months, presented as rolling measurements from each cycle’s starting point (trough) to its all-time high (peak).
Each line represents one timeframe. For example, the dark purple line shows the percentage difference between each daily low and the opening price three days prior, while the green line reflects the same comparison over a three-month window.
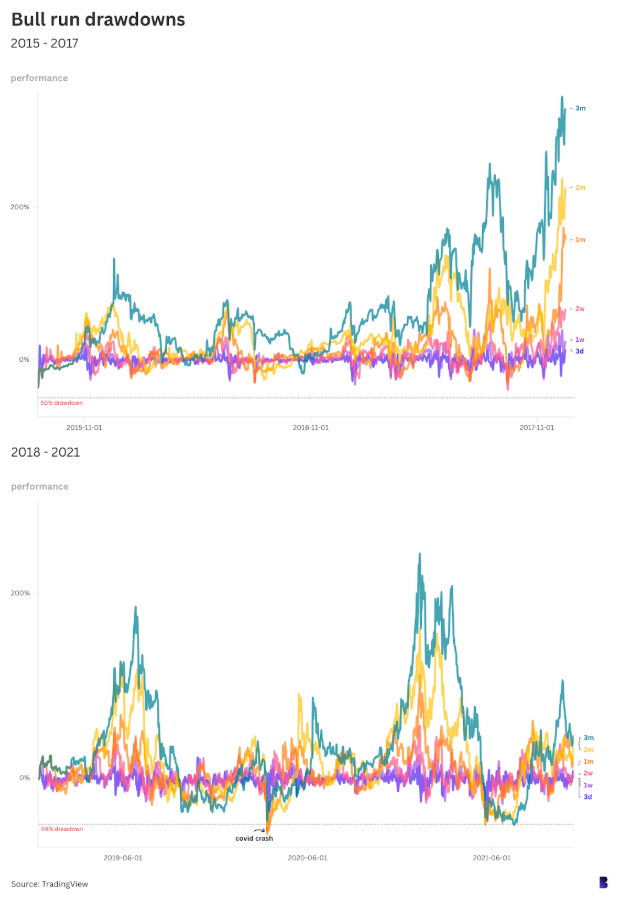
The dashed line at the bottom marks the 50% drawdown level. As shown, during the bull market from August 2015 to December 2017, no such deep correction ever occurred.
In that cycle, the largest drawdown happened near the end of September 2017, when prices dropped 40% over two weeks.
In contrast, the subsequent 2018–2021 bull market saw three separate drawdowns exceeding 50%.
One was triggered by the pandemic-induced market crash in March 2020, when stock markets suffered back-to-back "Black Mondays."
Bitcoin fell 50% or more across nearly all timeframes, with only the three-month window slightly under 50%, at 47%.
The other two major pullbacks occurred in May and July 2021, when Bitcoin dropped from an all-time high above $60,000 to around $30,000. Yet within the following four months, it quickly rebounded to nearly $69,000—a new record high.
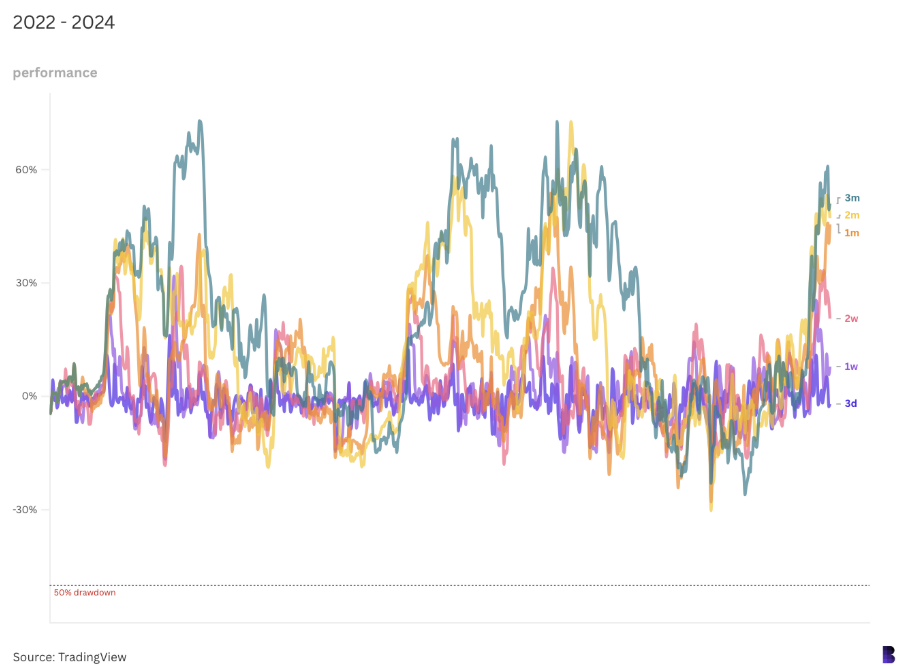
This current correction has been relatively mild. The most notable pullback during this bull run occurred in the first week of August.
Bitcoin declined 30% across multiple timeframes, falling from a June high above $70,000 to a low of $49,200.
Of course, this doesn’t mean Bitcoin has lost its volatility. I still expect bumpy roads ahead.
Notably, history shows the most severe drawdowns tend to happen near the end of bull markets.
Thus, the longer a bull market persists without a major correction, the greater the unease—and uncertainty—about what lies ahead. That, after all, is part of Bitcoin’s unique thrill.
Join TechFlow official community to stay tuned
Telegram:https://t.me/TechFlowDaily
X (Twitter):https://x.com/TechFlowPost
X (Twitter) EN:https://x.com/BlockFlow_News
 Blockworks