

Behind Bitcoin's $90,000: Seven Key Indicators Decoding Bull Market Signals from Global Liquidity to Institutional Moves
TechFlow Selected TechFlow Selected
Behind Bitcoin's $90,000: Seven Key Indicators Decoding Bull Market Signals from Global Liquidity to Institutional Moves
Typically, a 3.7 ratio indicates the top of the crypto market cycle.
Author: S4mmy's Web3 Snippets
Translation: TechFlow

I'll leverage my ten years of experience in traditional finance and corporate sectors to help break down complex topics into digestible pieces.
Following the announcement of the U.S. presidential election results, Bitcoin’s price surged sharply, with expectations that Trump will be inaugurated in January.
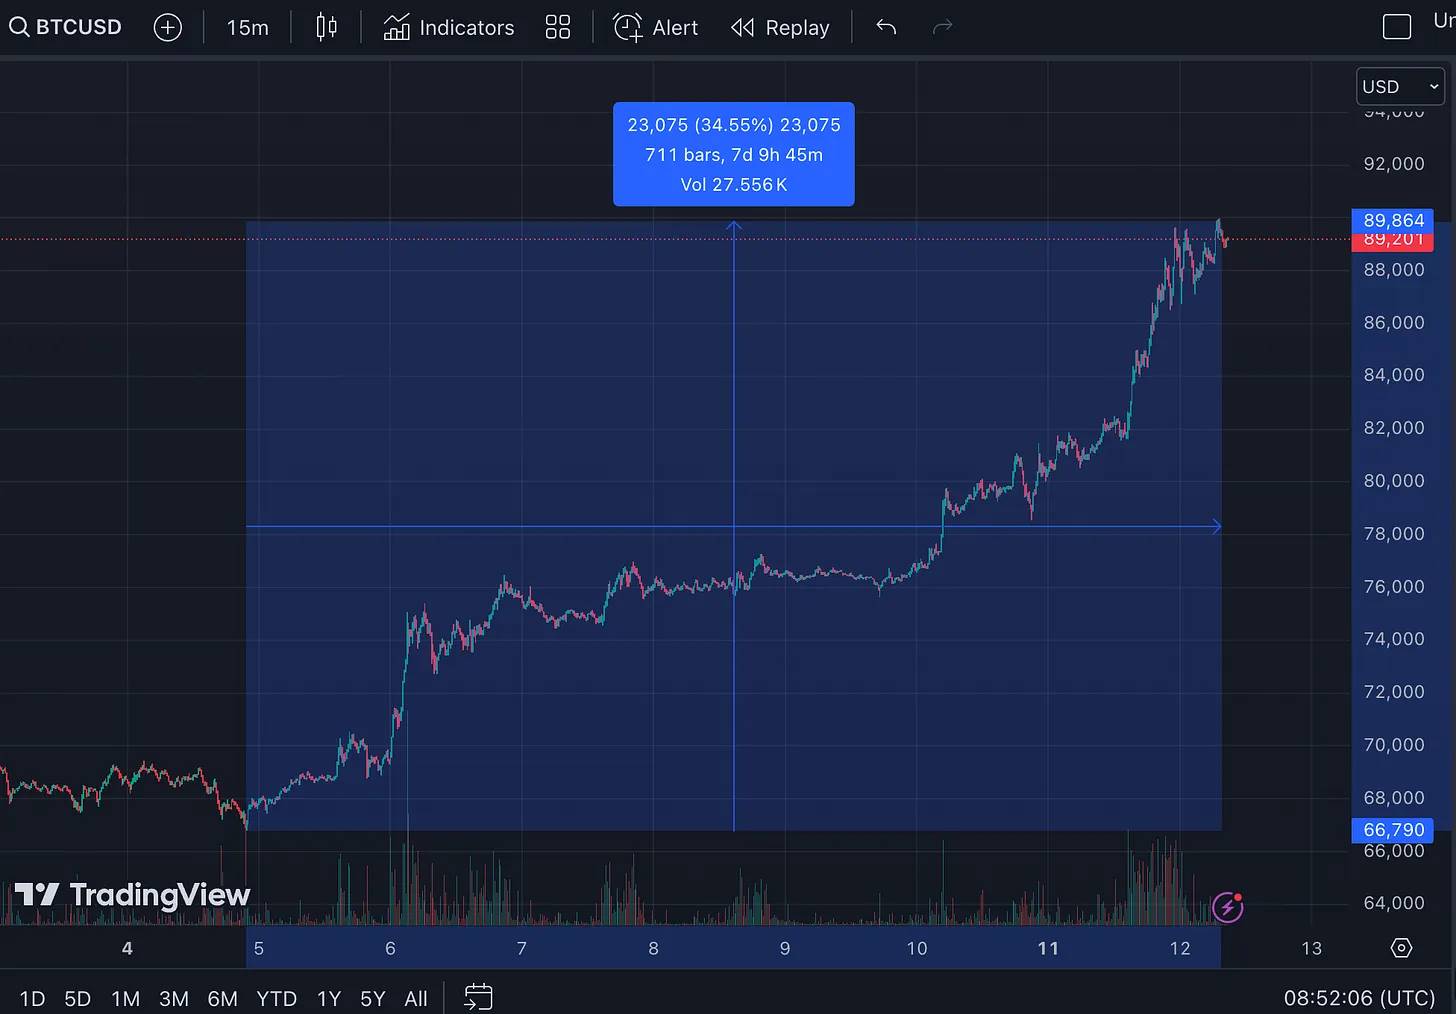
Last week, Bitcoin rose 35%, briefly reaching $90,000 before pulling back slightly. Data source: Trading View.
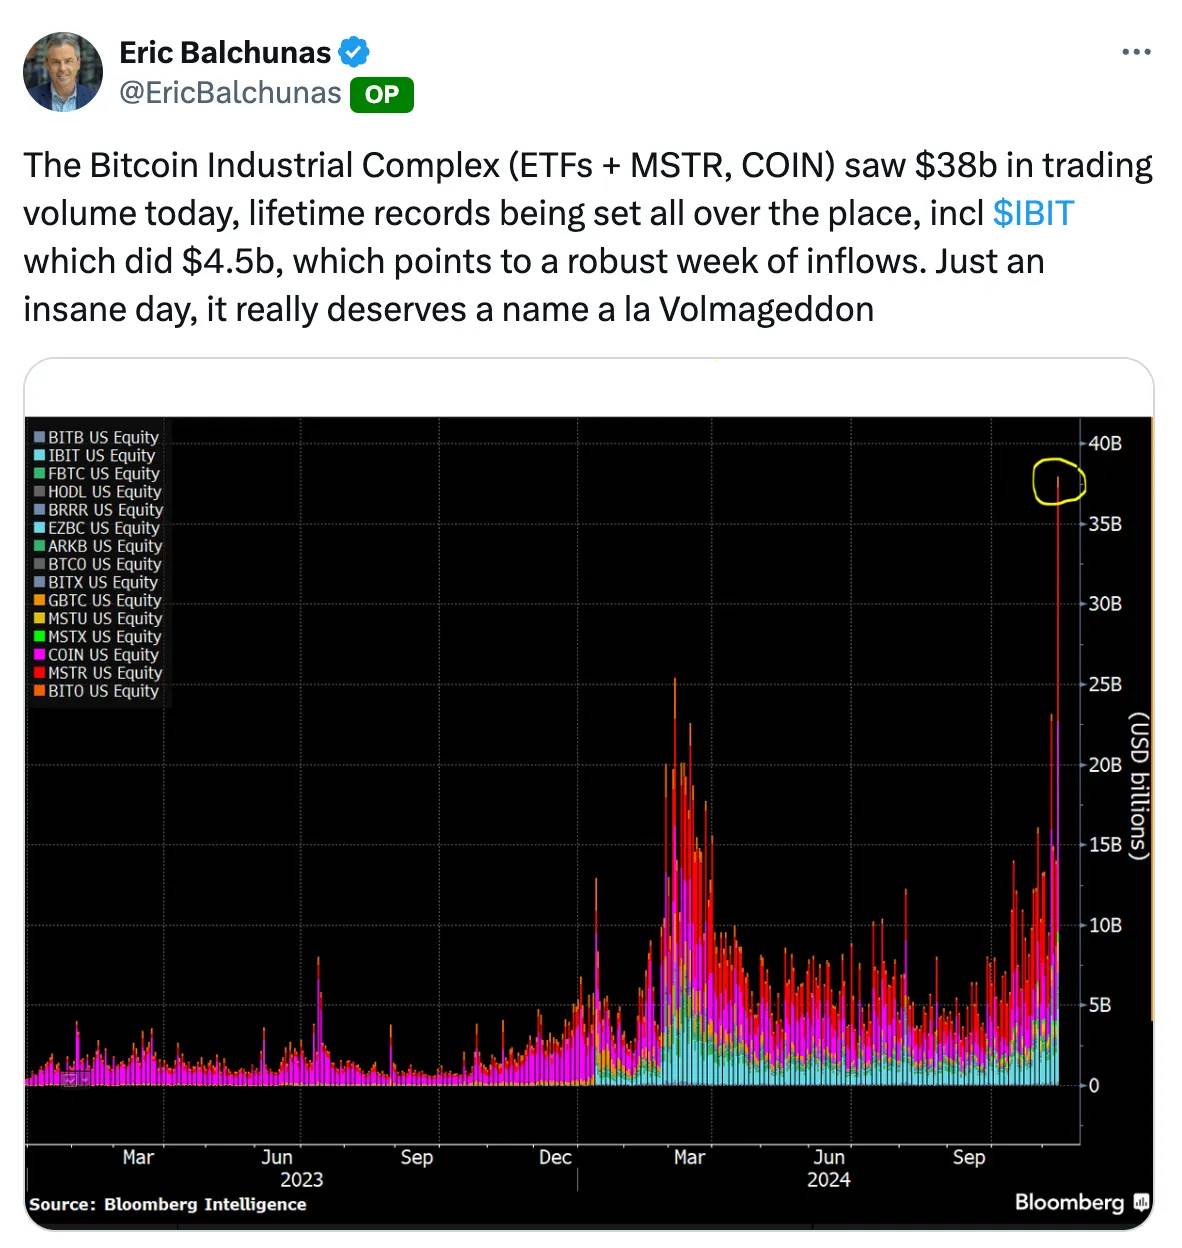
Trading volume for Bitcoin-related products hit $38 billion.
In institutional developments:
-
MicroStrategy now holds over $20 billion worth of Bitcoin, purchasing an additional $2 billion at current market prices.
On the government side, a proposal suggests the U.S. government buy 200,000 BTC annually over the next five years, which would result in holding 6% of total Bitcoin supply by 2030.
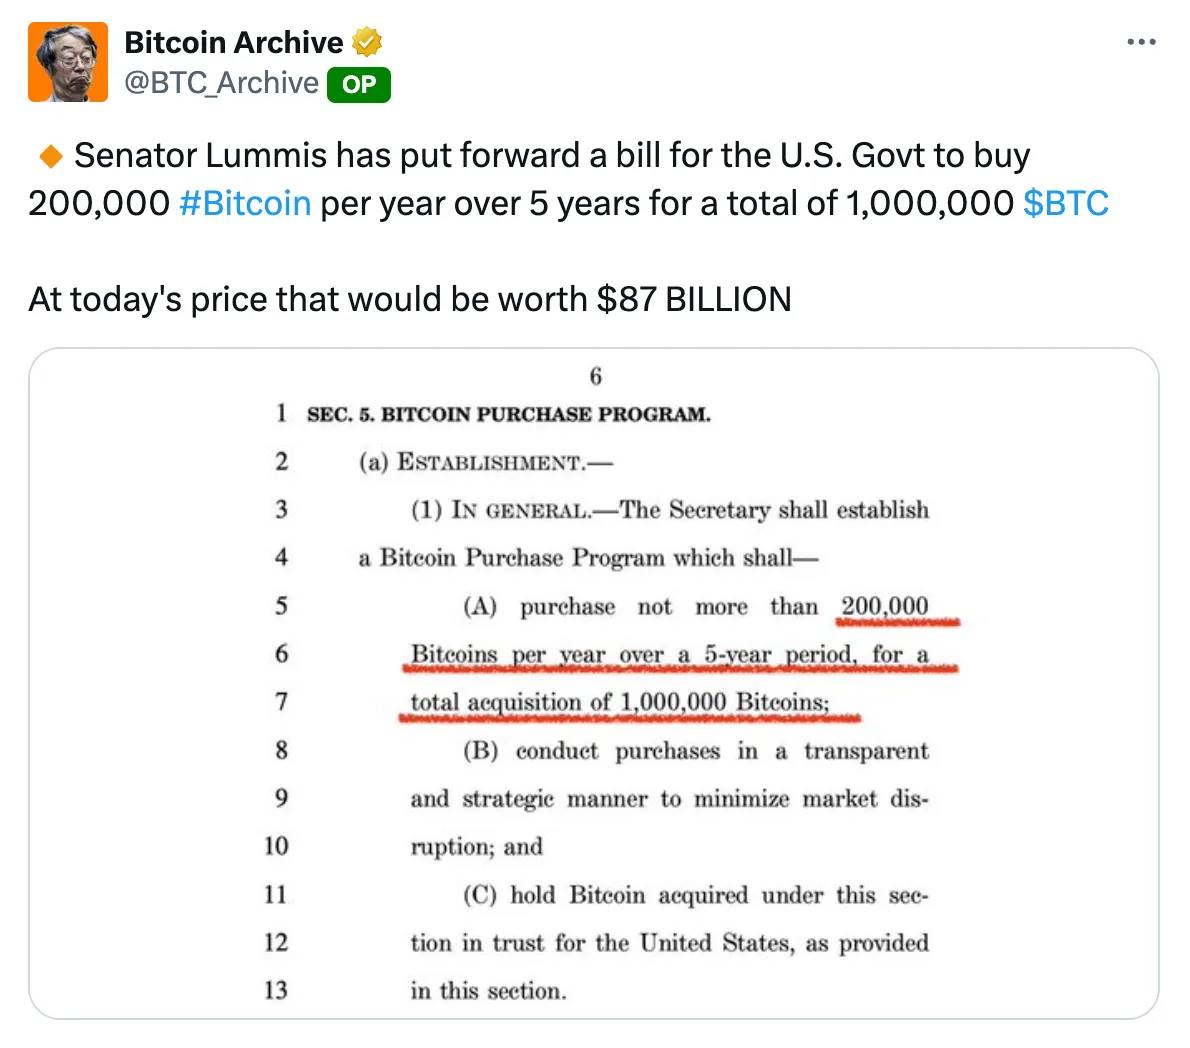
The U.S. is already the largest national holder of 213,000 BTC, representing 2.2% of total supply—though this percentage could grow.
Key Market Indicators to Watch:
Objective indicators signaling market shifts include:
-
Global Liquidity (measured via M2 Supply)
Tracking certain correlated assets or metrics—M2 supply (with a 3-month lag) shows strong correlation with Bitcoin price.
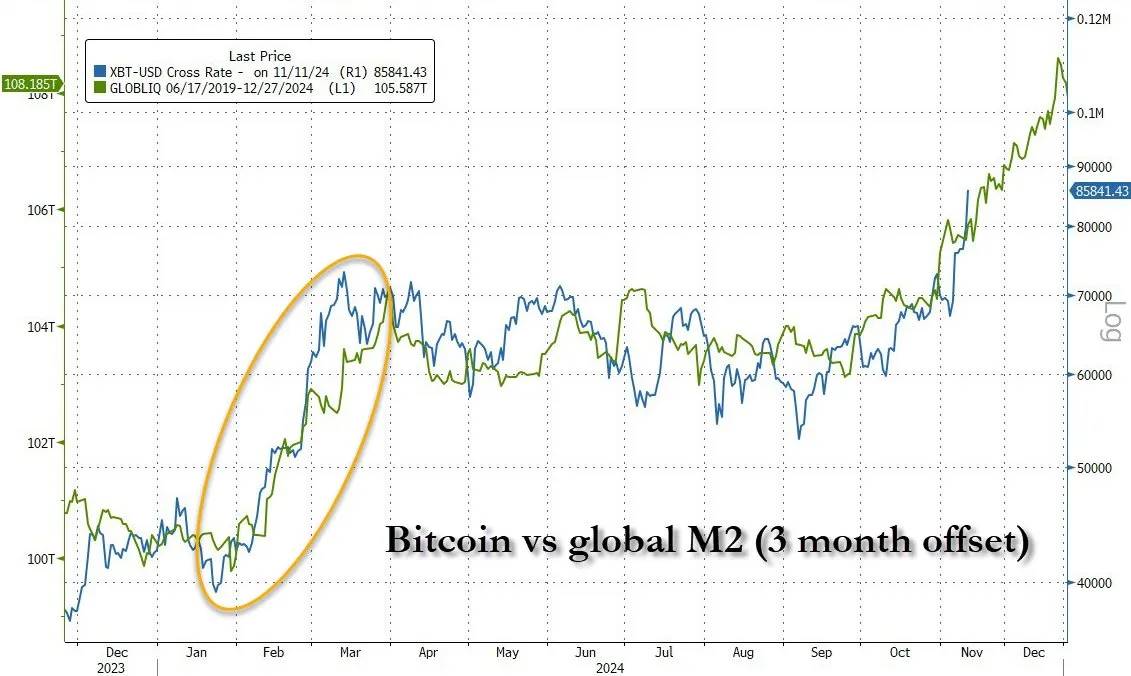
Data source: Zero Hedge.
What does this mean? It serves as a proxy for global liquidity. According to theories by Lyn Alden and Raoul Pal, when excess liquidity floods financial markets, it flows into risk assets with about a three-month delay. This correlation suggests that if Bitcoin continues tracking M2 without significant deviation, we may see Bitcoin reach $100,000 by year-end.
-
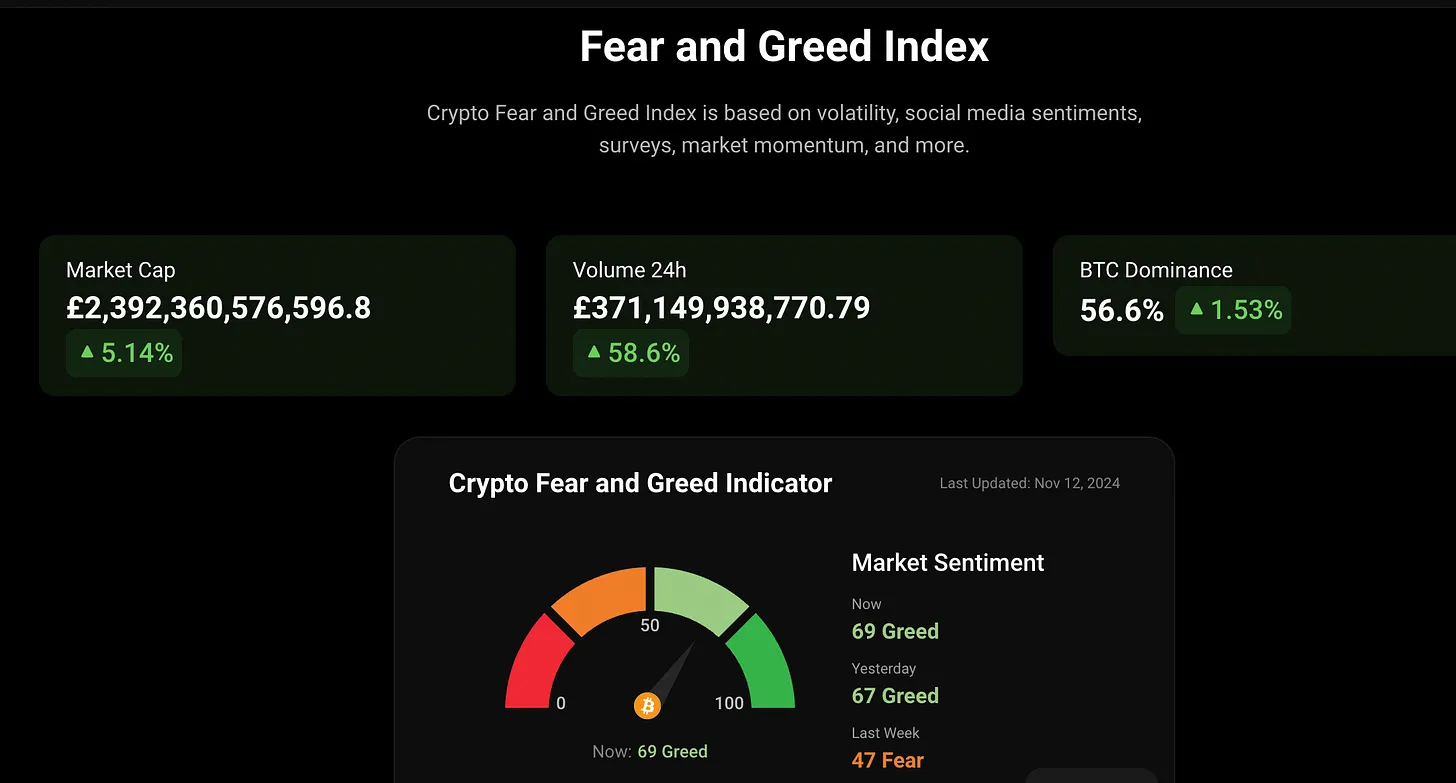
Fear & Greed Index (69, "Nice")
View Link
Source: Coin Glass
Be mindful of methodological differences across indices, as some are more sensitive than others. Coin Stats offers a relatively balanced approach that aligns well with actual market conditions.
-
Coinbase wallet downloads increased by 12% in the past 24 hours
View Link
Historically, when Coinbase becomes a trending app on Apple’s App Store or Google Play, it often signals a meaningful market inflection point—worth monitoring closely.
Currently, Coinbase ranks #81 on the Apple App Store.
-
Google Trends search interest for "Bitcoin" is at "79"
View Link
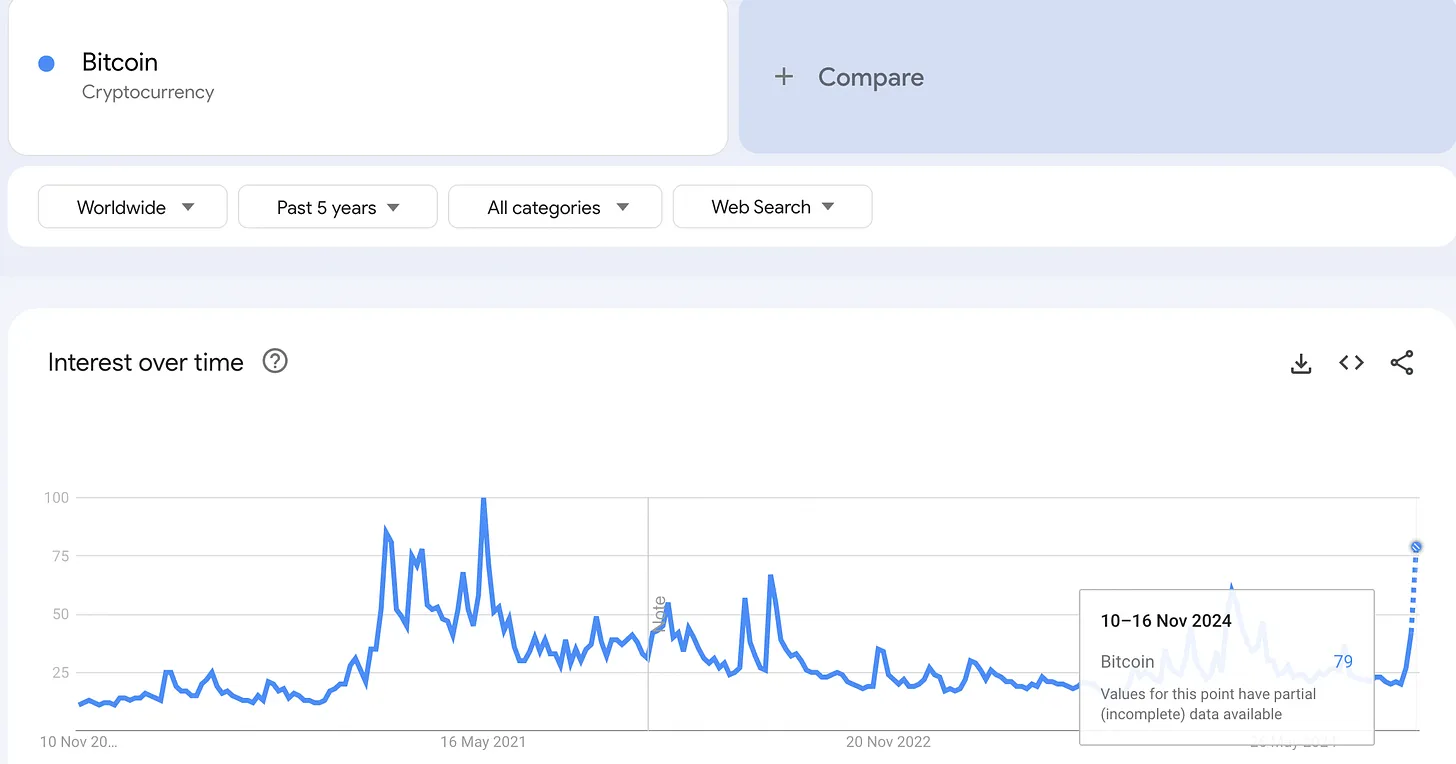
Source: Google Trends. This is a notable indicator—we can't predict where the "new 100" might land—but current search volume stands at 79% of the peak seen in May 2021. As more users enter the crypto space, this cycle could see substantial growth.
-
Venture Capital Funding Levels in Crypto
View Link
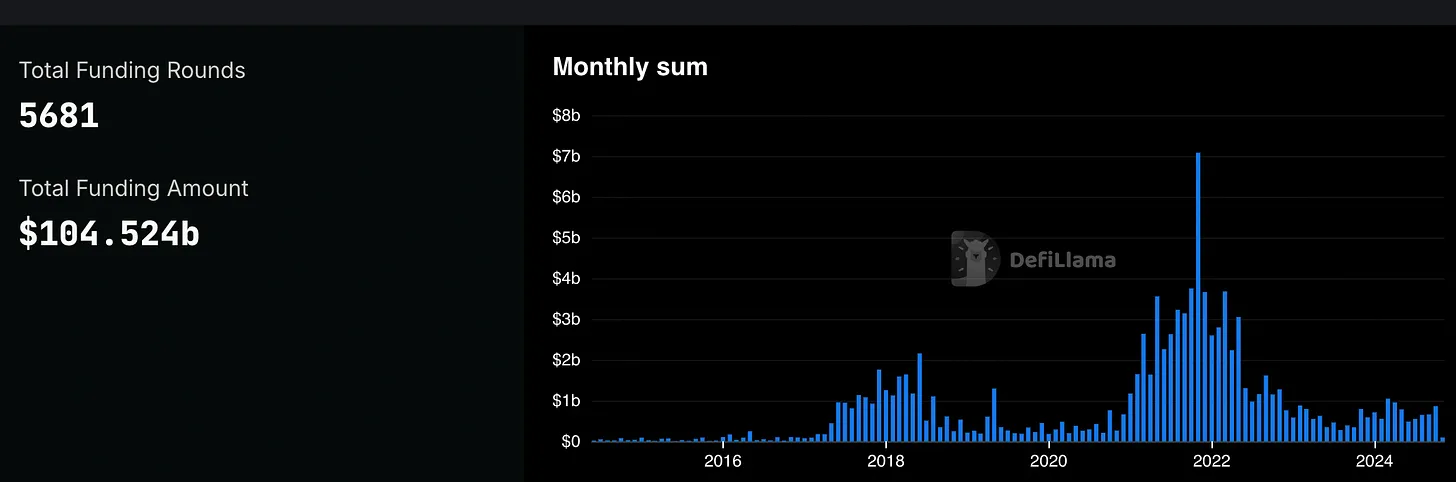
Source: Defi Llama. We can observe that fundraising trends are rising. When these levels approach or exceed the $7 billion raised in October 2021, we may be nearing a market top. Bitcoin peaked in November 2021, suggesting a potential multi-month lag.
-
Exchange Net Flows Remain Neutral
View Link
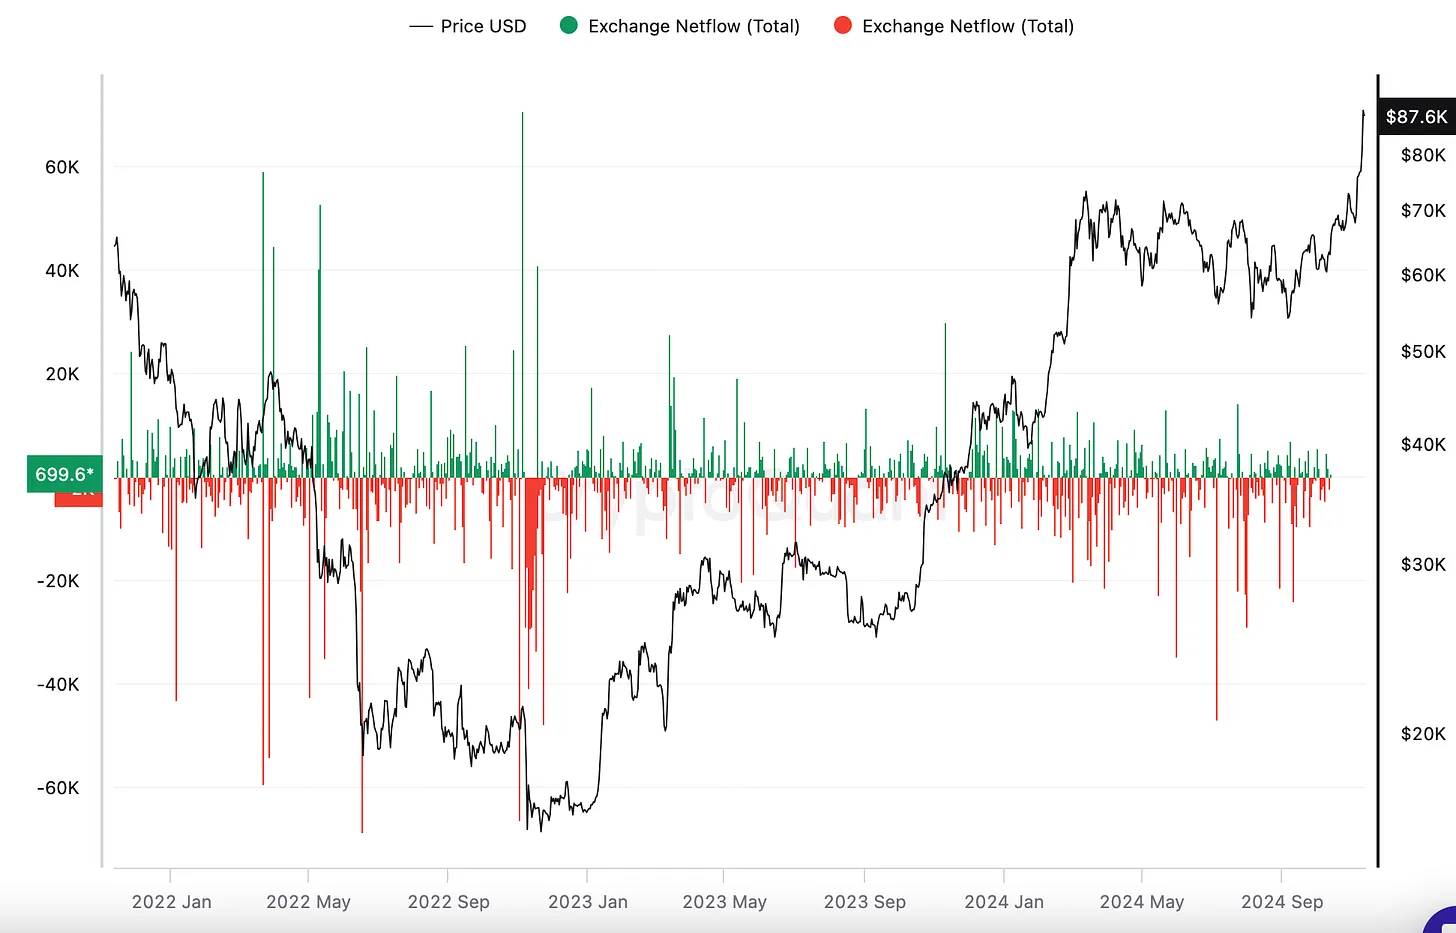
During market tops or bottoms, exchange net flows typically show sharp volatility. Currently, flows remain neutral, indicating that many investors are comfortable holding spot positions or keeping funds on-chain.
-
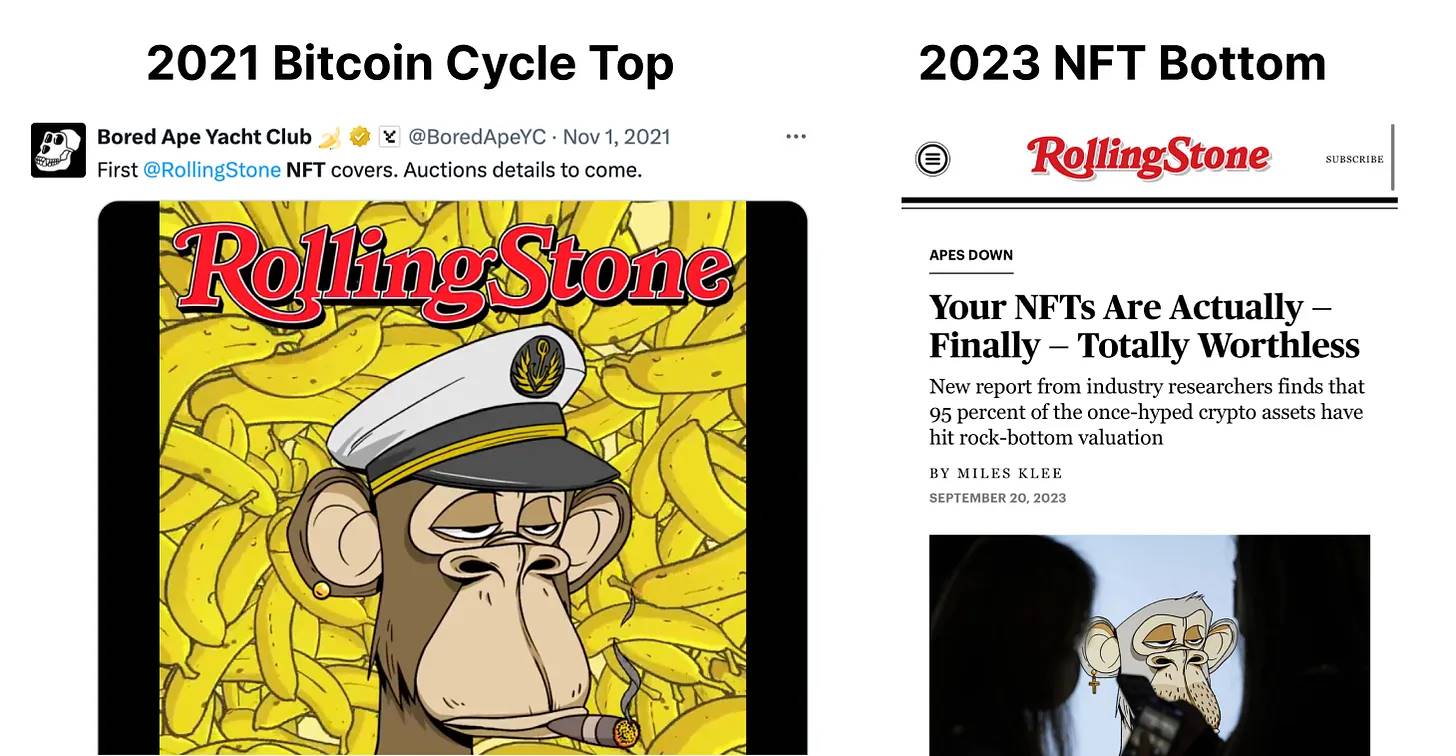
YouTube Views for Crypto-Related Content

As retail traders notice Bitcoin and crypto gaining mainstream media coverage, crypto-focused YouTube channels may become primary information sources for non-crypto natives. Contrarian strategies—selling when mainstream media embraces crypto—can be effective near market tops. For example, Rolling Stone magazine was a telling signal during the NFT bear market bottom.
Other indicators to monitor:
-
Bitcoin Halving: The time gap between halving events and historical price peaks—supply shocks are now embedded in market demand dynamics, and miners are also holding large inventories.
-
Technical indicators like RSI, Pi Cycle, and MACD suggest certain crypto assets may be oversold or undervalued.
-
Market Value to Realized Value (MVRV) Ratio: A ratio of 3.7 typically indicates a market top. This compares market price against realized value—the weighted average price of coins based on their last on-chain transaction.
Check out the latest episode of Modern Market for broader discussion.
Content cannot be displayed outside Feishu Docs at this time.
I’ll compile a step-by-step analysis report tracking these indicators and provide weekly updates—stay tuned.
Join TechFlow official community to stay tuned
Telegram:https://t.me/TechFlowDaily
X (Twitter):https://x.com/TechFlowPost
X (Twitter) EN:https://x.com/BlockFlow_News


