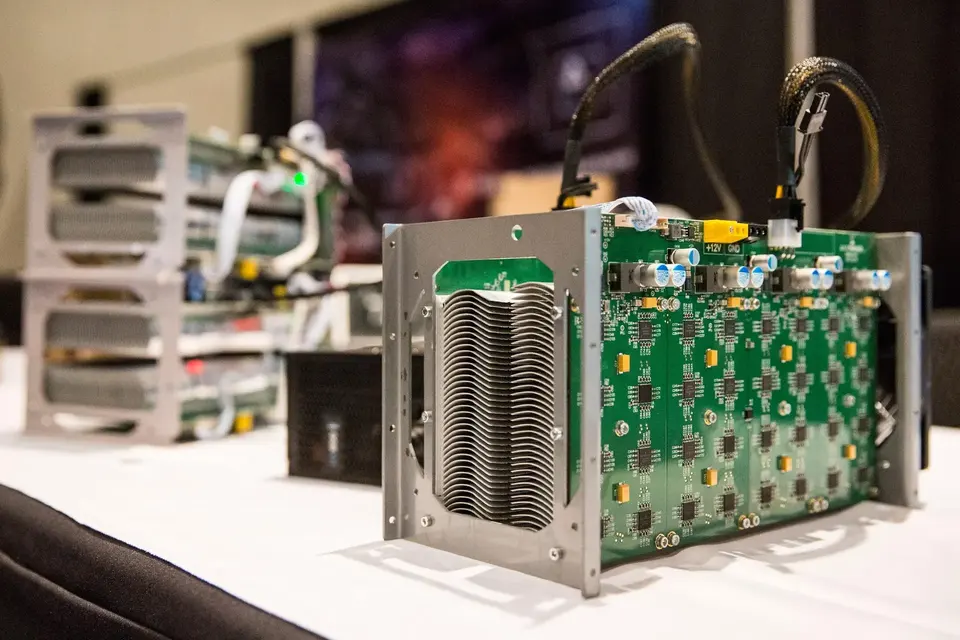
Bitcoin, the barometer of global liquidity
TechFlow Selected TechFlow Selected
Bitcoin, the barometer of global liquidity
Among all major asset classes, Bitcoin has the highest correlation with global liquidity.
 Navigating Web3 tides with focused insights
Written by: Sam Callahan
Translated by: Luffy, Foresight News
Summary
-
Bitcoin aligns with global liquidity direction 83% of the time over any given 12-month period—a higher rate than any other major asset class—making Bitcoin a true barometer of liquidity.
-
While Bitcoin has a high correlation with global liquidity, it is not immune to short-term deviations caused by idiosyncratic events or internal market dynamics.
-
Combining global liquidity conditions with on-chain valuation metrics for Bitcoin provides a more nuanced understanding of Bitcoin cycles, helping investors identify when internal market dynamics may decouple Bitcoin from global liquidity trends.
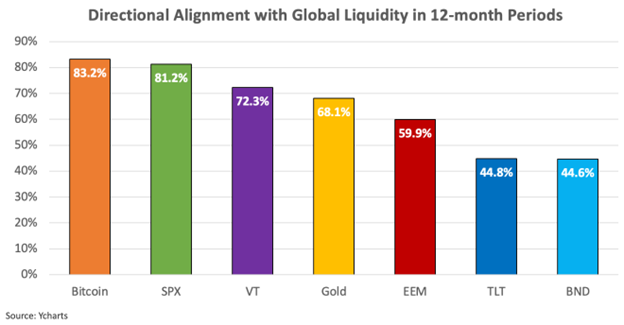
Correlation of major asset classes with global liquidity
Introduction
For investors seeking to enhance returns and manage risk effectively, understanding how asset prices respond to changes in global liquidity has become essential. In today’s markets, asset prices are increasingly driven by central bank policies that directly affect liquidity conditions. Fundamentals are no longer the primary driver of asset prices.
This phenomenon has grown more pronounced since the global financial crisis. Since then, unconventional monetary policies have become the dominant force behind asset price movements. Central bankers have leveraged liquidity to turn markets into a grand game, as economist Mohamed El-Erian put it: central banks have become "the only game in town."
Stanley Druckenmiller echoed this sentiment, stating: "Earnings don't move the overall market; it's the Fed... Focus on central banks and the flow of liquidity... Most people in the market are focused on earnings and traditional indicators. Liquidity is what drives markets."
This is especially evident in the S&P 500 Index.
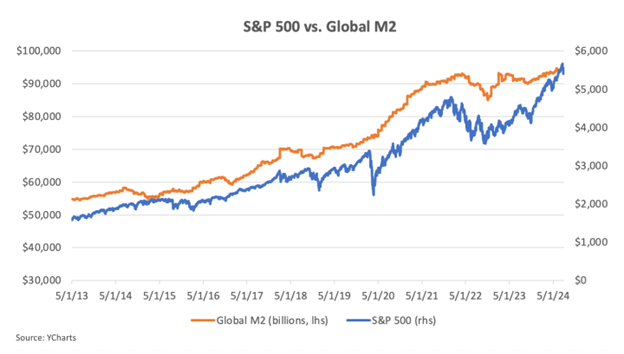
S&P 500 Index vs. Global M2 Trends
The correlation shown above can be reduced to simple supply and demand. When more money is available to purchase assets—be it stocks, bonds, gold, or Bitcoin—those asset prices typically rise. Since 2008, central banks have injected vast amounts of fiat currency into the financial system, and asset prices have responded accordingly. In other words, monetary inflation fuels asset price inflation.
In this context, investors must understand how to measure global liquidity and how different assets react to shifts in liquidity conditions in order to better navigate these liquidity-driven markets.
How to Measure Global Liquidity
There are many ways to measure global liquidity. In this report, we use Global M2—a broad measure of money supply that includes physical currency, checking accounts, savings deposits, money market securities, and other forms of readily accessible cash.
Bitcoin Magazine Pro provides a global M2 metric aggregating data from the eight largest economies: the United States, China, the Eurozone, the UK, Japan, Canada, Russia, and Australia. It serves as a solid proxy for global liquidity because it reflects the total amount of funds globally available for spending, investing, and lending. Another way to view it is as a measure of total credit creation and central bank money printing across the global economy.
A key nuance here is that global M2 is denominated in U.S. dollars. As Lyn Alden explained in a previous article, this matters:
Dollar denomination is important because the U.S. dollar is the world’s reserve currency and thus the primary unit of account for global trade, contracts, and debt. When the dollar strengthens, countries' debts become harder. When the dollar weakens, their debts become softer. Dollar-denominated global broad money acts as a critical indicator of global liquidity—capturing both the pace of fiat issuance and the relative strength of the dollar against other currencies.
When global M2 is measured in dollars, it captures both the relative strength of the dollar and the speed of credit creation, making it a reliable gauge of global liquidity conditions.
Why Bitcoin May Be the Purest Liquidity Barometer
Over the years, one asset has demonstrated a strong correlation with global liquidity: Bitcoin. Bitcoin tends to thrive when global liquidity expands and suffers when liquidity contracts. This phenomenon has led some to refer to Bitcoin as a "liquidity barometer."
The chart below clearly shows how Bitcoin’s price tracks changes in global liquidity.
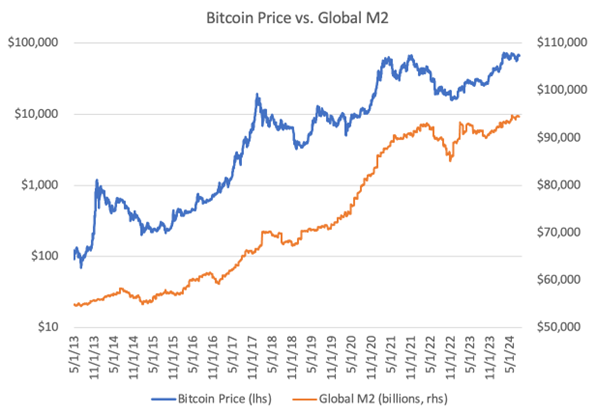
Likewise, comparing year-over-year percentage changes in Bitcoin and global liquidity highlights their synchronicity: Bitcoin prices rise when liquidity increases and fall when liquidity declines.
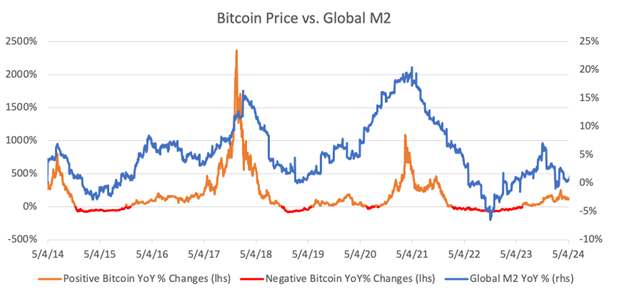
From the chart, it’s clear that Bitcoin’s price is highly sensitive to changes in global liquidity. But is it the most sensitive asset in today’s market?
Risk assets generally exhibit higher correlation with liquidity conditions. In environments of abundant liquidity, investors tend to adopt risk-on strategies, shifting capital toward higher-risk/higher-return assets. Conversely, when liquidity tightens, investors typically move capital into assets perceived as safer. This explains why assets like equities often perform well during periods of increasing liquidity.
However, stock prices are also influenced by factors beyond liquidity conditions. For example, equity performance is partly driven by earnings and dividends. This can weaken the correlation between stocks and global liquidity.
Additionally, the U.S. stock market benefits from structural buying via passive inflows through retirement accounts like 401(k)s, which continue regardless of liquidity conditions. These passive flows can buffer the U.S. equity market during liquidity fluctuations, potentially reducing its sensitivity to global liquidity.
The relationship between gold and liquidity is more complex. On one hand, gold benefits from increased liquidity and a weaker dollar. On the other, gold is viewed as a safe-haven asset. During periods of liquidity contraction and rising risk aversion, investor demand for safety can boost gold prices. This means gold can perform well even amid weakening liquidity. Thus, gold’s performance may not be as tightly linked to liquidity conditions as other assets.
Like gold, bonds are considered safe-haven assets, so their correlation with liquidity conditions may also be lower.
Finally, we return to Bitcoin. Unlike stocks, Bitcoin generates no earnings or dividends, nor does it have structural buying pressures affecting its performance. Unlike gold and bonds, at this stage of its adoption cycle, most institutional pools still treat Bitcoin as a risk asset. Compared to other assets, Bitcoin’s correlation with global liquidity is the purest.
If true, this is a valuable insight for Bitcoin investors and traders. For long-term holders, understanding Bitcoin’s link to liquidity offers deeper insight into the drivers of its price over time. For traders, Bitcoin offers a tool to express views on the future direction of global liquidity.
This article aims to explore in depth the correlation between Bitcoin and global liquidity, compare it with other asset classes, identify periods of correlation breakdown, and share how investors can use this information to profit in the future.
Quantifying the Correlation Between Bitcoin and Global Liquidity
When analyzing the correlation between Bitcoin and global liquidity, it’s important to consider both the magnitude and direction of the relationship.
The magnitude indicates the strength of the association between two variables. A higher correlation suggests that changes in global M2 more predictably influence Bitcoin’s price. Understanding this degree of association is key to measuring Bitcoin’s sensitivity to shifts in global liquidity.
Data from May 2013 to July 2024 reveals Bitcoin’s strong sensitivity to liquidity. Over this period, Bitcoin’s price showed a correlation of 0.94 with global liquidity, indicating a very strong positive relationship. This suggests Bitcoin’s price was highly responsive to changes in global liquidity over this timeframe.
Looking at 12-month rolling correlation, the average drops to 0.51. This remains a positive correlation but is notably lower than the overall figure.
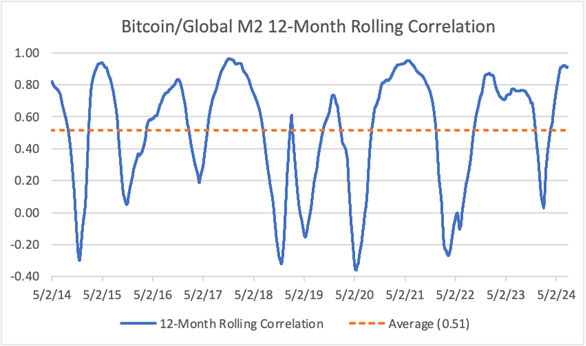
Examining the 6-month rolling correlation, it further declines to 0.36.
This indicates that over shorter timeframes, Bitcoin’s price increasingly deviates from its long-term liquidity trend, suggesting short-term price movements are more likely influenced by internal Bitcoin-specific factors rather than liquidity conditions.
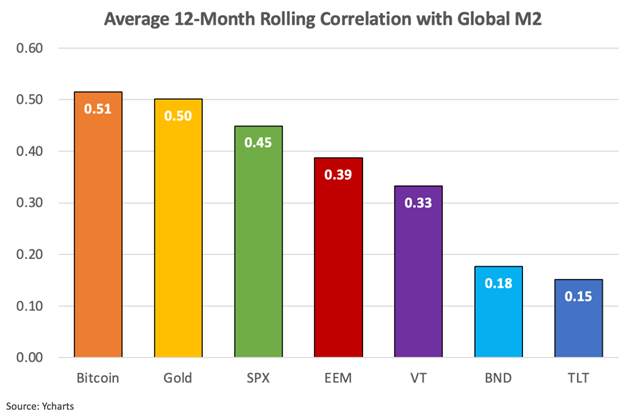
To better understand Bitcoin’s correlation with global liquidity, we compared it with other assets: SPDR S&P 500 ETF (SPX), Vanguard Total World Stock ETF (VT), iShares MSCI Emerging Markets ETF (EEM), iShares 20+ Year Treasury Bond ETF (TLT), Vanguard Total Bond Market ETF (BND), and gold.
In terms of 12-month rolling correlation, Bitcoin ranks highest, followed by gold, then equity indices, while bond indices show the weakest correlation with liquidity.
When analyzing year-over-year percentage changes, equity indices show slightly stronger correlation with global liquidity than Bitcoin, followed by gold and bonds.
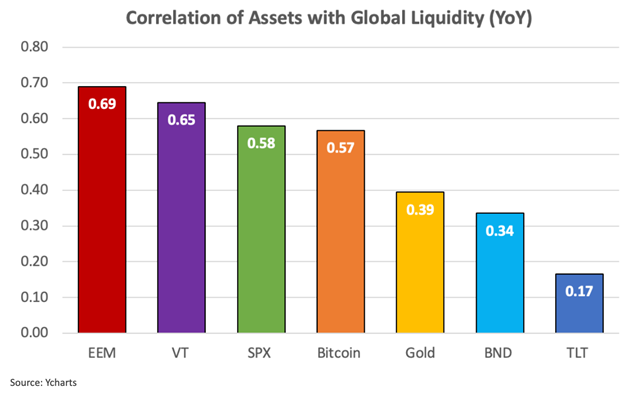
One reason equities may show higher year-over-year correlation than Bitcoin is Bitcoin’s high volatility. Bitcoin’s price often swings dramatically within a year, which can distort its correlation with global liquidity. In contrast, equity index prices typically fluctuate less sharply, aligning more closely with year-over-year changes in global M2. Nevertheless, Bitcoin still maintains a relatively strong correlation with global liquidity based on year-over-year changes.
The data above highlights three key points: 1) Equities, gold, and Bitcoin all perform closely with global liquidity; 2) Bitcoin shows the strongest overall correlation and the highest 12-month rolling correlation compared to other asset classes; 3) Bitcoin’s correlation with global liquidity weakens as the time horizon shortens.
Bitcoin’s Directional Alignment With Liquidity Sets It Apart
As previously mentioned, a strong positive correlation does not guarantee two variables always move in the same direction over time. This is especially true when an asset like Bitcoin—highly volatile—temporarily deviates from the long-term correlation with a less volatile metric like global M2. This is why combining both aspects (magnitude and direction) provides a more complete picture of how Bitcoin and global M2 interact over time.
Directional consistency helps us assess the reliability of their correlation. This is particularly valuable for those interested in long-term trends. If you know Bitcoin tends to follow the direction of global liquidity most of the time, you can have greater confidence predicting Bitcoin’s future price direction based on liquidity shifts. Among all analyzed assets, Bitcoin shows the highest directional alignment with global liquidity.

The chart below further illustrates Bitcoin’s 12-month rolling directional consistency with global liquidity compared to other asset classes.
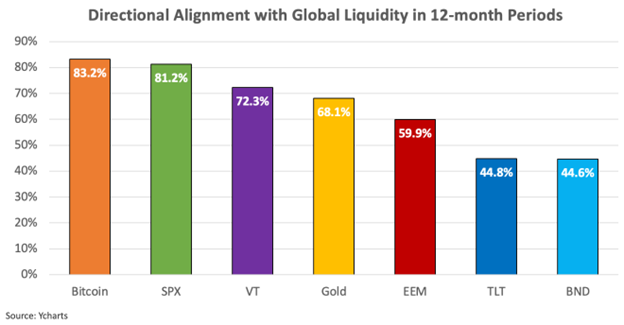
This shows that despite varying correlation strength across timeframes, Bitcoin’s price movement usually aligns with the direction of global liquidity. Moreover, its price direction tracks global liquidity more closely than any other traditional asset analyzed.
The relationship between Bitcoin and global liquidity is not only strong in magnitude but also consistent in direction. The data further supports the idea that Bitcoin is more sensitive to liquidity conditions than other traditional assets, especially over longer time horizons.
For investors, this means global liquidity may be a key driver of Bitcoin’s long-term price performance and should be considered when assessing Bitcoin market cycles and forecasting future price movements. For traders, Bitcoin offers a highly sensitive instrument to express views on global liquidity, making it a preferred reference for those with strong convictions about liquidity trends.
Limitations in Bitcoin’s Correlation With Liquidity
Although Bitcoin shows a strong overall correlation with global liquidity, findings suggest that over shorter rolling periods, Bitcoin’s price often diverges from liquidity trends. These deviations may occur when internal market dynamics exert greater influence during certain phases of the Bitcoin market cycle than global liquidity conditions, or due to idiosyncratic events specific to the Bitcoin industry.
Idiosyncratic events refer to occurrences within the cryptocurrency sector that rapidly shift market sentiment or trigger mass liquidations—such as major corporate bankruptcies, exchange hacks, regulatory crackdowns, or the collapse of Ponzi schemes.
Looking back at periods when Bitcoin’s 12-month rolling correlation with global liquidity weakened, it’s clear that Bitcoin’s price often decoupled from global liquidity trends during major industry events.
The chart below illustrates how Bitcoin’s correlation with liquidity breaks down during significant industry events.
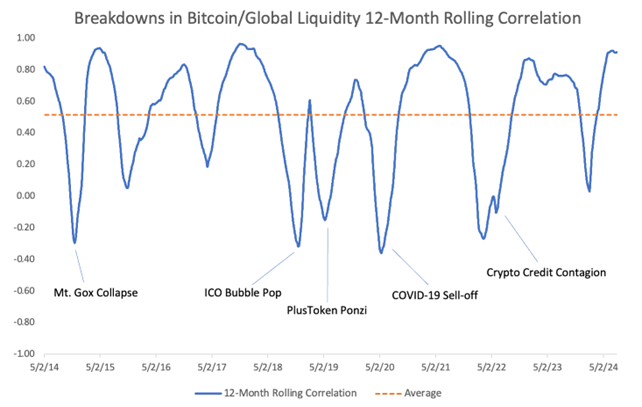
Critical events such as the Mt. Gox collapse, the PlusToken Ponzi scheme implosion, and the Terra/Luna crash triggered panic and sell-offs in crypto that were largely disconnected from global liquidity trends.
The 2020 COVID-19 market crash is another example. Amid widespread panic selling and flight-to-safety behavior, Bitcoin initially dropped sharply. However, as central banks responded with unprecedented liquidity injections, Bitcoin quickly rebounded—highlighting its sensitivity to liquidity shifts. The temporary breakdown in correlation at that time was attributable to sudden shifts in market sentiment, not changes in liquidity conditions.
While it’s important to understand how such idiosyncratic events impact Bitcoin’s correlation with global liquidity, their unpredictability makes them difficult for investors to act upon. That said, as the Bitcoin ecosystem matures, infrastructure improves, and regulation becomes clearer, I expect the frequency of such "black swan" events to decline over time.
How Supply-Side Dynamics Affect Bitcoin’s Liquidity Correlation
Besides idiosyncratic events, another notable pattern during periods of weakened correlation between Bitcoin and liquidity is that they often coincide with times when Bitcoin reaches extreme valuations followed by sharp drawdowns. This was evident during the bull market peaks of 2013, 2017, and 2021, when Bitcoin’s correlation with liquidity broke down as prices fell sharply from highs.
While liquidity primarily affects the demand side of the equation, understanding supply-side distribution patterns can help identify periods when Bitcoin may deviate from its long-term correlation with global liquidity.
The main source of supply comes from older holders realizing profits as Bitcoin’s price rises. Newly issued coins from block rewards also add supply, though in much smaller quantities, and this issuance continues to decrease with each halving event. During bull markets, long-term holders typically reduce positions and sell to new buyers until demand saturates. This saturation point often marks the peak of a bull run.
A key metric for assessing this behavior is Bitcoin 1-Year HODL Waves, which measures the percentage of Bitcoin held by long-term holders (at least one year) relative to total circulating supply. In other words, it gauges the proportion of total available supply held by long-term investors at any given time.
Historically, this metric declines during bull markets as long-term holders sell, and rises during bear markets as they accumulate. The chart below shows this behavior, with red circles indicating cycle peaks and green circles indicating bottoms.
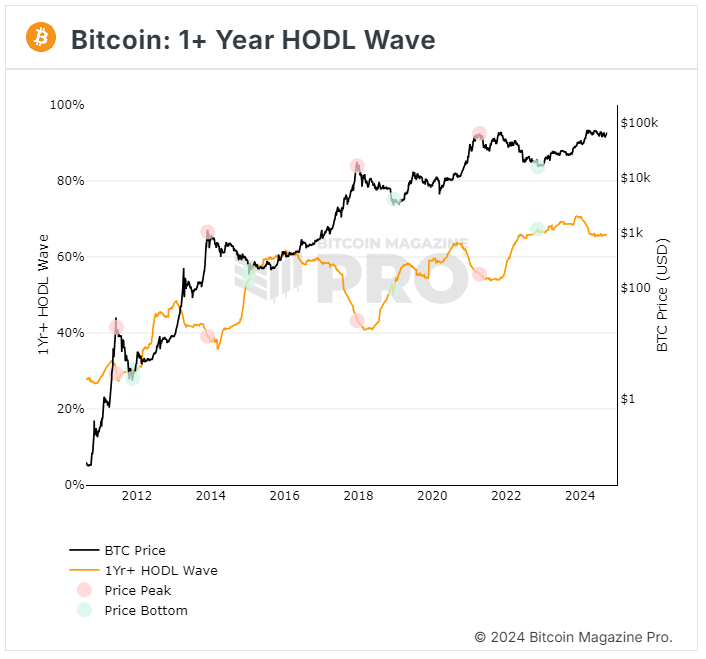
This illustrates long-term holder behavior throughout Bitcoin cycles. When Bitcoin appears overvalued, long-term holders tend to sell for profit. When it appears undervalued, they tend to accumulate.
The question then becomes: "How do you determine when Bitcoin is undervalued or overvalued to better predict when supply will flood the market or be absorbed?"
Although the dataset is still relatively small, the Market Value to Realized Value Z-Score (MVRV Z-Score) has proven to be a reliable tool for identifying when Bitcoin reaches extreme valuation levels. The MVRV Z-Score is based on three components:
1) Market Value: Current market cap, calculated by multiplying Bitcoin’s price by the total number of Bitcoins in circulation.
2) Realized Value: The average price at which each Bitcoin or UTXO last transacted on-chain, multiplied by total circulating supply—essentially the cost basis of Bitcoin holders.
3) Z-Score: This measures how far market value deviates from realized value in standard deviations, highlighting periods of extreme overvaluation or undervaluation.
When the MVRV Z-Score is high, it means there is a large gap between market price and realized price, indicating many holders are sitting on unrealized profits. While intuitively positive, this may signal that Bitcoin is overbought or overvalued—making it an ideal time for long-term holders to sell and take profits.
When the MVRV Z-Score is low, it means market price is near or below realized price, indicating Bitcoin is oversold or undervalued—an ideal time for investors to start accumulating.
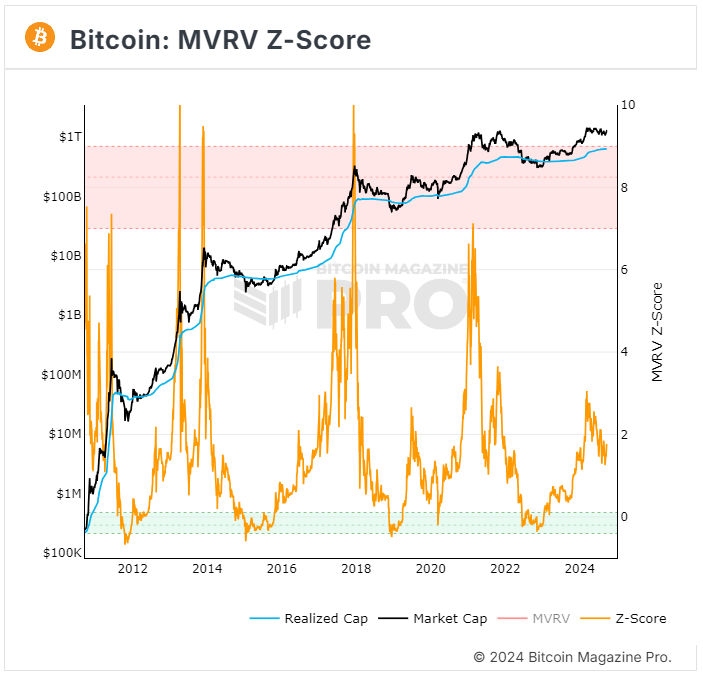
When the MVRV Z-Score is overlaid with the 12-month rolling correlation between Bitcoin and global liquidity, a pattern emerges. When the MVRV Z-Score begins to drop sharply from historical highs, the 12-month rolling correlation appears to break down. Red rectangles indicate these periods.
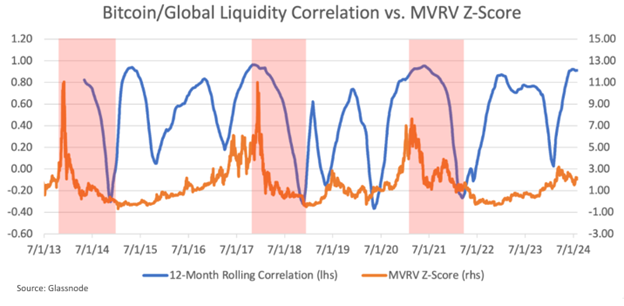
This suggests that when Bitcoin’s MVRV Z-Score starts falling from elevated levels and correlation with liquidity breaks down, internal market dynamics—such as profit-taking and panic selling—may exert a stronger influence on Bitcoin’s price than global liquidity conditions.
At extreme valuation levels, Bitcoin’s price tends to be driven more by market sentiment and supply-side dynamics than by global liquidity trends. This finding is valuable for traders and investors, as it helps identify when Bitcoin may diverge from its long-term correlation with global liquidity.
For example, suppose a trader strongly believes the U.S. dollar will weaken and global liquidity will rise over the next year. Based on this analysis, Bitcoin would be the best instrument to express that view, as it is currently the purest liquidity barometer in the market.
However, before executing the trade, the trader should first assess Bitcoin’s MVRV Z-Score or similar valuation metrics. If the MVRV Z-Score indicates overvaluation, the trader should remain cautious even in a liquidity-rich environment, as internal market dynamics could override liquidity conditions and trigger a price correction.
By monitoring both Bitcoin’s long-term correlation with global liquidity and metrics like the MVRV Z-Score, investors and traders can better anticipate how Bitcoin’s price may respond to changes in liquidity conditions. This approach enables market participants to make more informed decisions and potentially increase their odds of success when investing in or trading Bitcoin.
Conclusion
Bitcoin’s strong correlation with global liquidity makes it a macroeconomic barometer for investors and traders. Compared to other asset classes, Bitcoin not only exhibits a strong correlation with global liquidity but also the highest degree of directional consistency. One can view Bitcoin as a mirror reflecting the pace of global money creation and the relative strength of the U.S. dollar. Unlike traditional assets such as stocks, gold, or bonds, Bitcoin’s correlation with liquidity is the purest.
However, Bitcoin’s correlation is not perfect. Research shows that the strength of this correlation diminishes in the short term and highlights the importance of identifying periods when Bitcoin decouples from global liquidity.
Internal Bitcoin market dynamics—such as idiosyncratic events or extreme valuation levels—can cause it to temporarily detach from global liquidity influences. These periods are critical for investors, as they often mark price corrections or accumulation phases. Combining global liquidity analysis with on-chain metrics like the MVRV Z-Score offers deeper insight into Bitcoin’s price cycles and helps determine when its price may be driven more by sentiment than liquidity trends.
Michael Saylor once famously said, "All your models are destroyed." Bitcoin represents a paradigm shift in money itself. Therefore, no statistical model can perfectly capture the complexity of the Bitcoin phenomenon, but some models can serve as useful guides. As the old adage goes, "All models are wrong, but some are useful."
Since the global financial crisis, central banks have distorted financial markets through unconventional policies, making liquidity the primary driver of asset prices. Understanding shifts in global liquidity is therefore crucial for any investor aiming to successfully navigate today’s markets. Macro analyst Luke Gromen once described Bitcoin as "the last functioning smoke alarm" due to its ability to signal changes in liquidity conditions.
When Bitcoin’s alarm sounds, investors would be wise to listen—to manage risk and position themselves strategically to capitalize on future market opportunities.
Join TechFlow official community to stay tuned
Telegram:https://t.me/TechFlowDaily
X (Twitter):https://x.com/TechFlowPost
X (Twitter) EN:https://x.com/BlockFlow_News
 @samcallah