2024 Global Crypto Adoption Survey: South and Central Asia and Oceania Lead the World in Crypto Adoption
TechFlow Selected TechFlow Selected
2024 Global Crypto Adoption Survey: South and Central Asia and Oceania Lead the World in Crypto Adoption
Central, South Asia, and Oceania (CSAO) dominate our 2024 Index, with seven countries from the region ranking in the top 20.
Author: Chainalysis Team
Translation: TechFlow
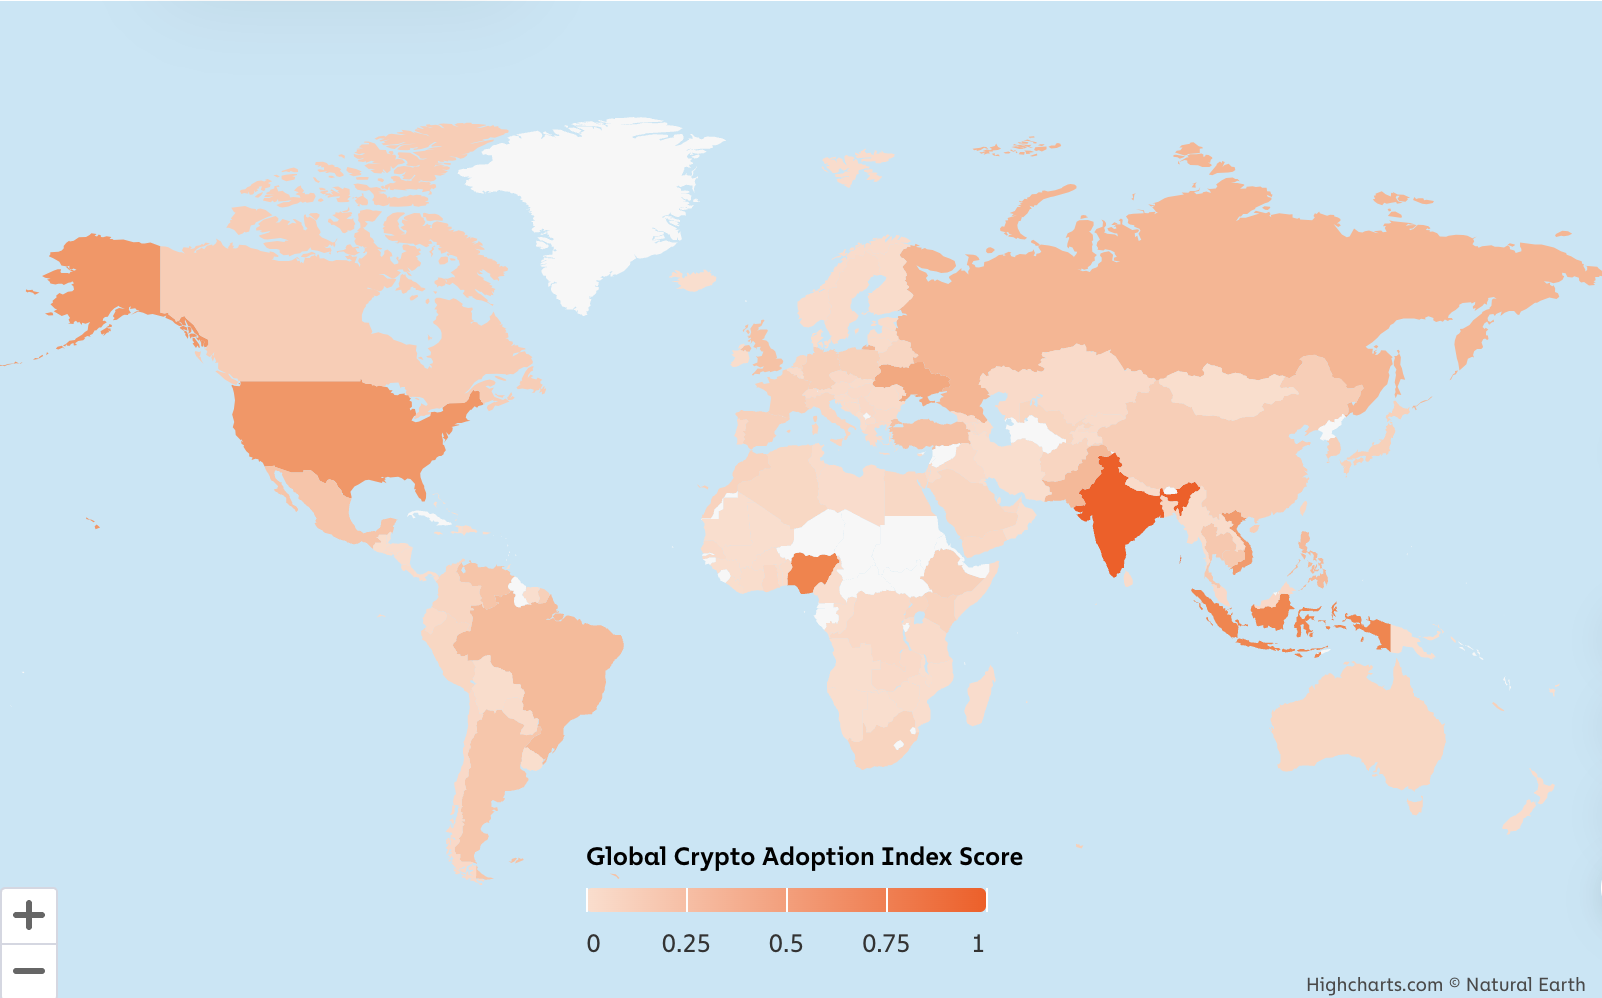
Use our interactive map to see how your country ranks in the 2024 Chainalysis Global Crypto Adoption Index.
This article is excerpted from our 2024 Geography of Cryptocurrency Report.
We are excited to share the fifth annual Chainalysis Global Crypto Adoption Index. In each year’s report, we analyze on-chain and off-chain data to identify which countries are leading in grassroots cryptocurrency adoption. Our research highlights countries where unique crypto use cases are emerging and explores why people around the world choose to adopt cryptocurrency.
Keep reading to learn more:
Our Methodology for the Global Crypto Adoption Index
The Global Crypto Adoption Index consists of four subindexes, each based on a country's usage of different types of cryptocurrency services. We rank all 151 countries that have sufficient data across each subindex. We weight rankings by characteristics such as population size and purchasing power, calculate the geometric mean of each country’s scores across the four subindexes, then normalize the final result to a 0–1 range, assigning each country a score to determine its overall ranking. The closer a country's final score is to 1, the higher its rank.
To compute our subindexes, we estimate transaction volumes for various crypto services and protocols in each country based on web traffic patterns to the websites of these services and protocols. We acknowledge certain limitations of web traffic data, as some crypto users may use tools like VPNs to obscure their true physical location. However, given that our index covers hundreds of millions of cryptocurrency transactions and over 13 billion webpage visits, any misattributed transaction volume due to VPN usage is negligible within such a large dataset. We also validate our findings against insights from local crypto experts and operators worldwide, further strengthening our confidence in this methodology.
Below are descriptions of the subindexes and how they are calculated, along with improvements we’ve made to our methodology since last year.
Subindex Category 1: On-chain value of cryptocurrency received by centralized services, adjusted per capita GDP at PPP
We introduced this subindex to rank countries based on the total value of cryptocurrency received by users on centralized services, weighting the rankings to favor countries where this amount is relatively high compared to average income. To calculate this, we estimate the total on-chain value received by users of centralized services in each country and weight it by per capita GDP adjusted for purchasing power parity (PPP), reflecting average resident income. A higher ratio of received on-chain value to PPP-adjusted per capita GDP results in a higher ranking. In other words, if two countries receive the same amount of cryptocurrency via centralized services, the one with lower per capita GDP will rank higher.
Subindex Category 2: On-chain retail value of cryptocurrency received by centralized services, adjusted per capita GDP at PPP
We also estimate activity based on non-professional individual crypto users’ behavior on centralized services, comparing the value of their transactions to average purchasing power. We do this by estimating the amount of cryptocurrency received by users in each country on centralized services, but only counting retail transactions below $10,000 in value. We then rank countries based on this metric, weighting rankings to favor countries with lower PPP-adjusted per capita GDP.
Subindex Category 3: On-chain value of cryptocurrency received through decentralized finance (DeFi) protocols, adjusted per capita GDP at PPP
We rank countries based on their DeFi transaction volume and weight the rankings to favor countries with lower PPP-adjusted per capita GDP.
Subindex Category 4: On-chain retail value of cryptocurrency received through decentralized finance (DeFi) protocols, adjusted per capita GDP at PPP
We rank countries based on their DeFi transaction volume for retail-sized transfers (i.e., cryptocurrency transfers valued under $10,000), again weighting rankings to favor countries with lower PPP-adjusted per capita GDP.
Methodology Changes
Methodology Change 1: Measuring Decentralized Finance (DeFi) Activity
The main methodological change this year involves how we measure the value of cryptocurrency received by decentralized protocols. For DeFi services, we now only consider received value originating from individual wallets flagged as suspicious, excluding incoming value from other known DeFi wallets. This new approach ensures that total received value isn't inflated by intermediary steps required by certain smart contracts.
Here’s an example of how a typical DeFi transfer works:
-
An individual wallet initiates a swap on DeFi protocol A, transferring Ethereum (ETH) from the personal wallet to the router contract address of DeFi protocol A.
-
ETH is deposited into the Wrapped Ether (wETH) token contract from the router contract address.
-
The router contract receives wETH.
-
A transfer occurs from the router contract to a decentralized exchange (DEX) pool contract.
-
A transfer occurs from the DEX pool contract back to the router contract.
-
Finally, funds are transferred from the router contract back to the individual wallet.
Under our new methodology, we only count the first transfer in the above example when calculating the total value received by DeFi protocols. This way, we eliminate intermediate transfers between contracts operated by the same service provider. While this process reduces our estimated received value, it now provides a more accurate measurement.
Methodology Change 2: Removal of the P2P Exchange Subindex
In previous years, we included peer-to-peer (P2P) cryptocurrency transaction volume in our calculations, weighted by PPP-adjusted per capita income and internet user numbers, to compute the overall Global Crypto Adoption ranking. This year, we decided to remove this subindex due to a significant decline in P2P exchange activity. Notably, LocalBitcoins.com, one of the oldest P2P exchanges, shut down last year, contributing to this drop.
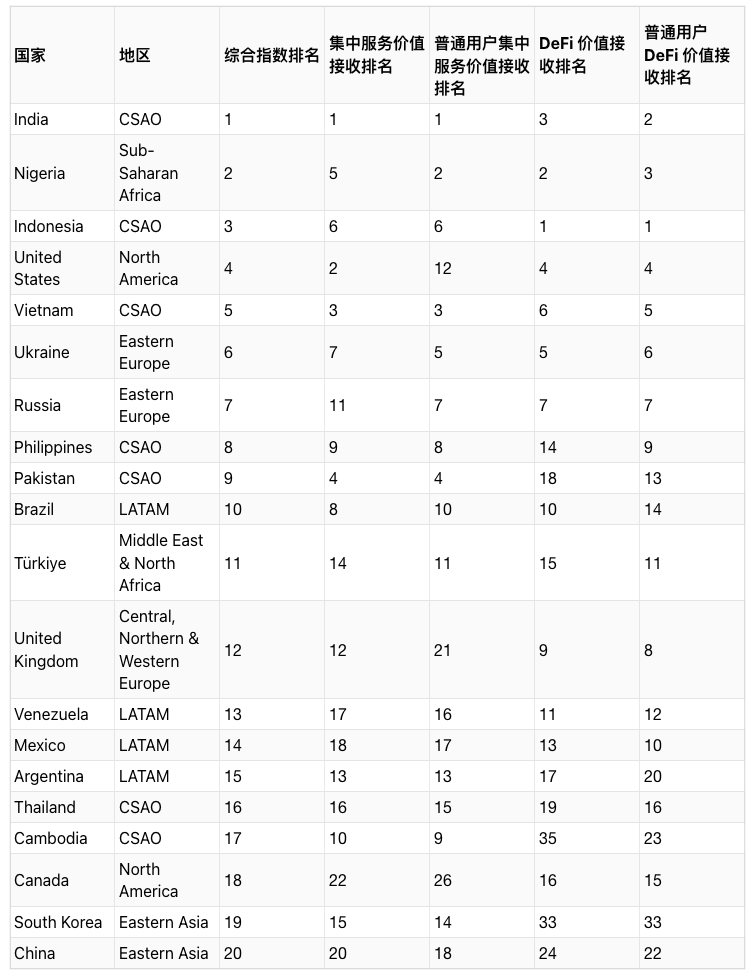
Top 20 Countries in the 2024 Global Crypto Adoption Index
Central and Southern Asia and Oceania (CSAO) dominate our 2024 index, with seven countries in the top 20. As discussed in our full report, CSAO features a diverse set of crypto markets, with high levels of activity on local crypto exchanges, as well as strong engagement in merchant services and decentralized finance (DeFi).
Global Crypto Activity Continues to Grow
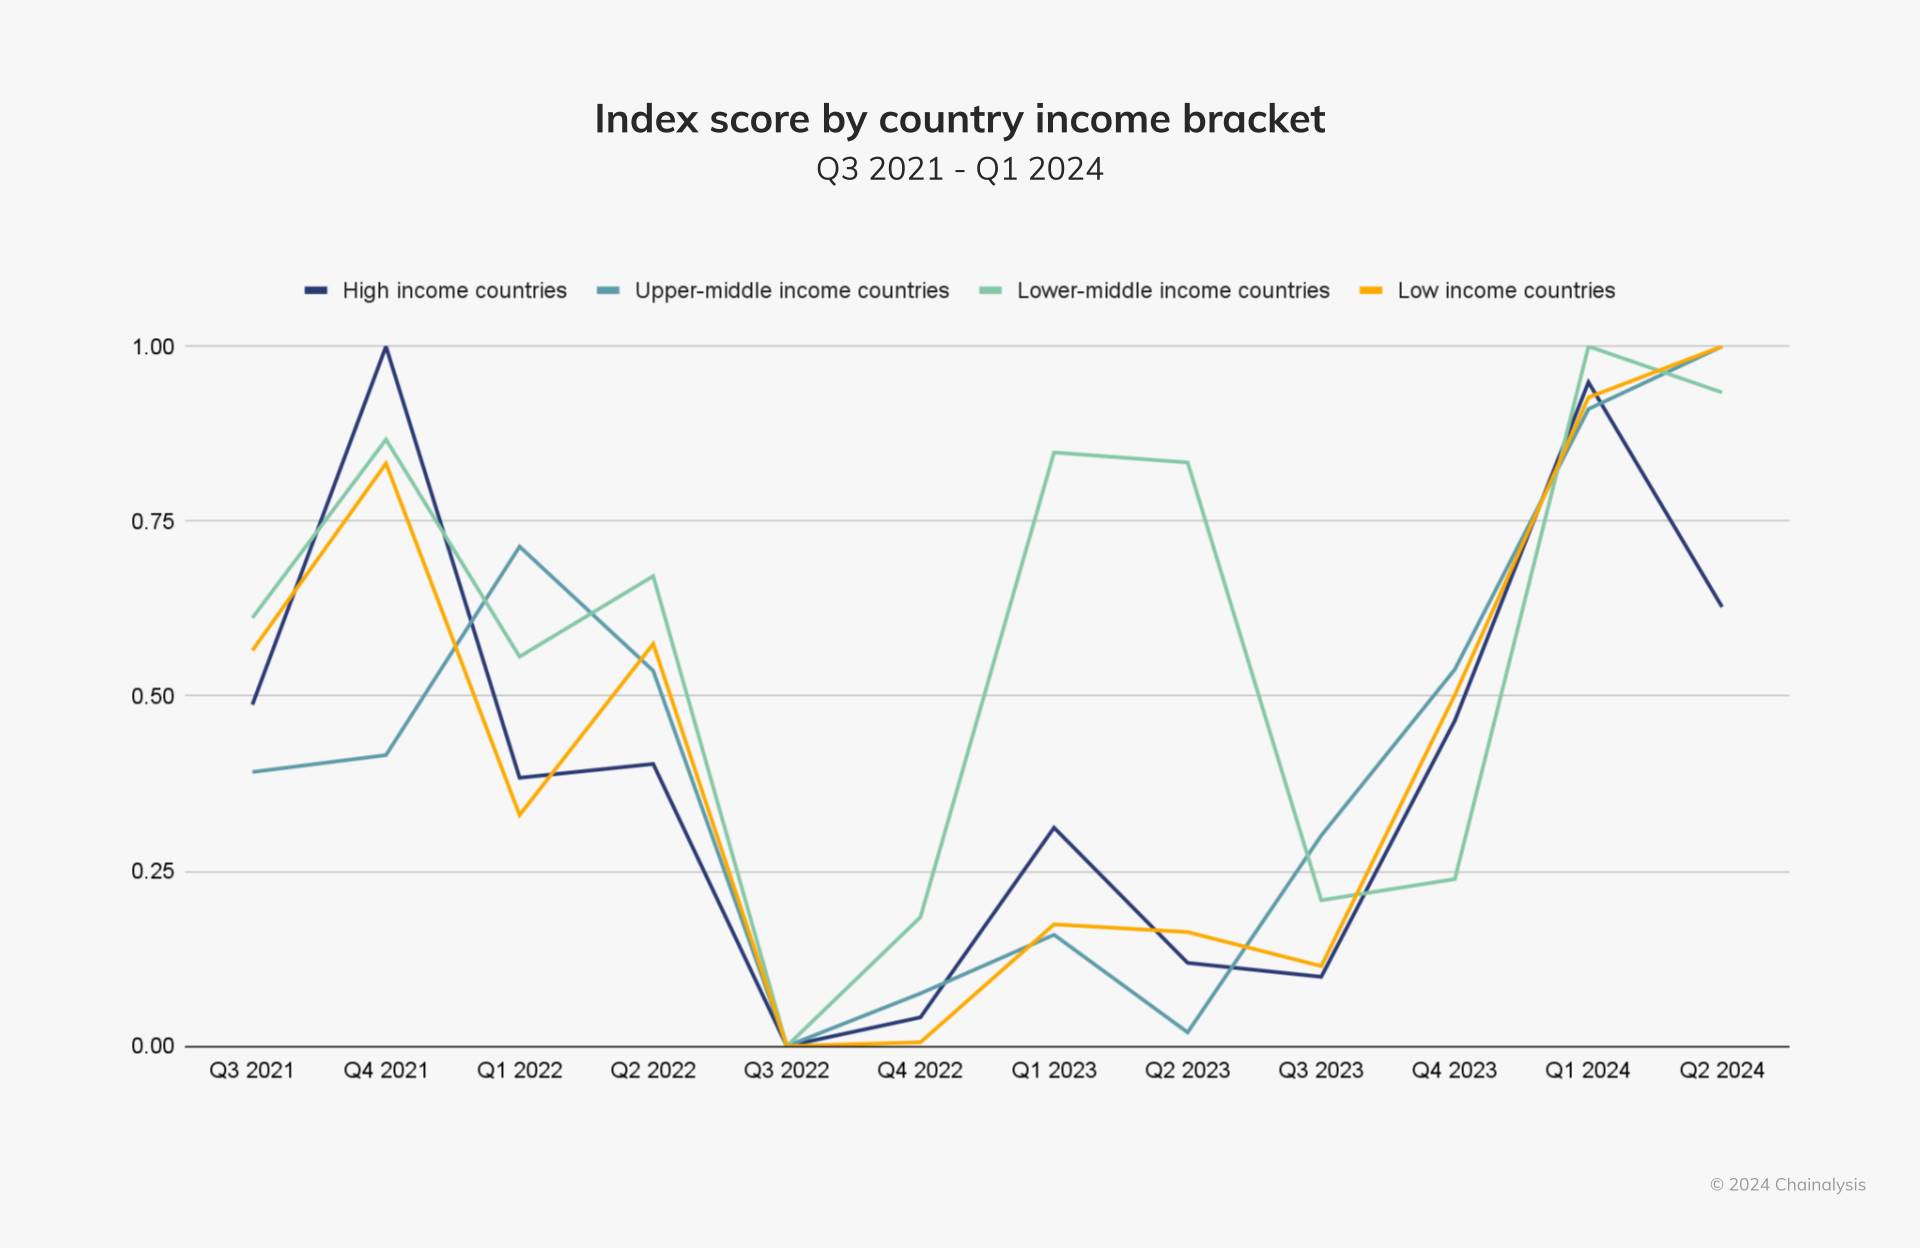
Between Q4 2023 and Q1 2024, the total value of global crypto activity surged significantly, reaching levels higher than those seen during the 2021 crypto bull market. We can observe this trend in the chart below, where we aggregate index scores across 151 countries from Q3 2021 to Q2 2024, then re-index the data to illustrate the growth in global adoption.
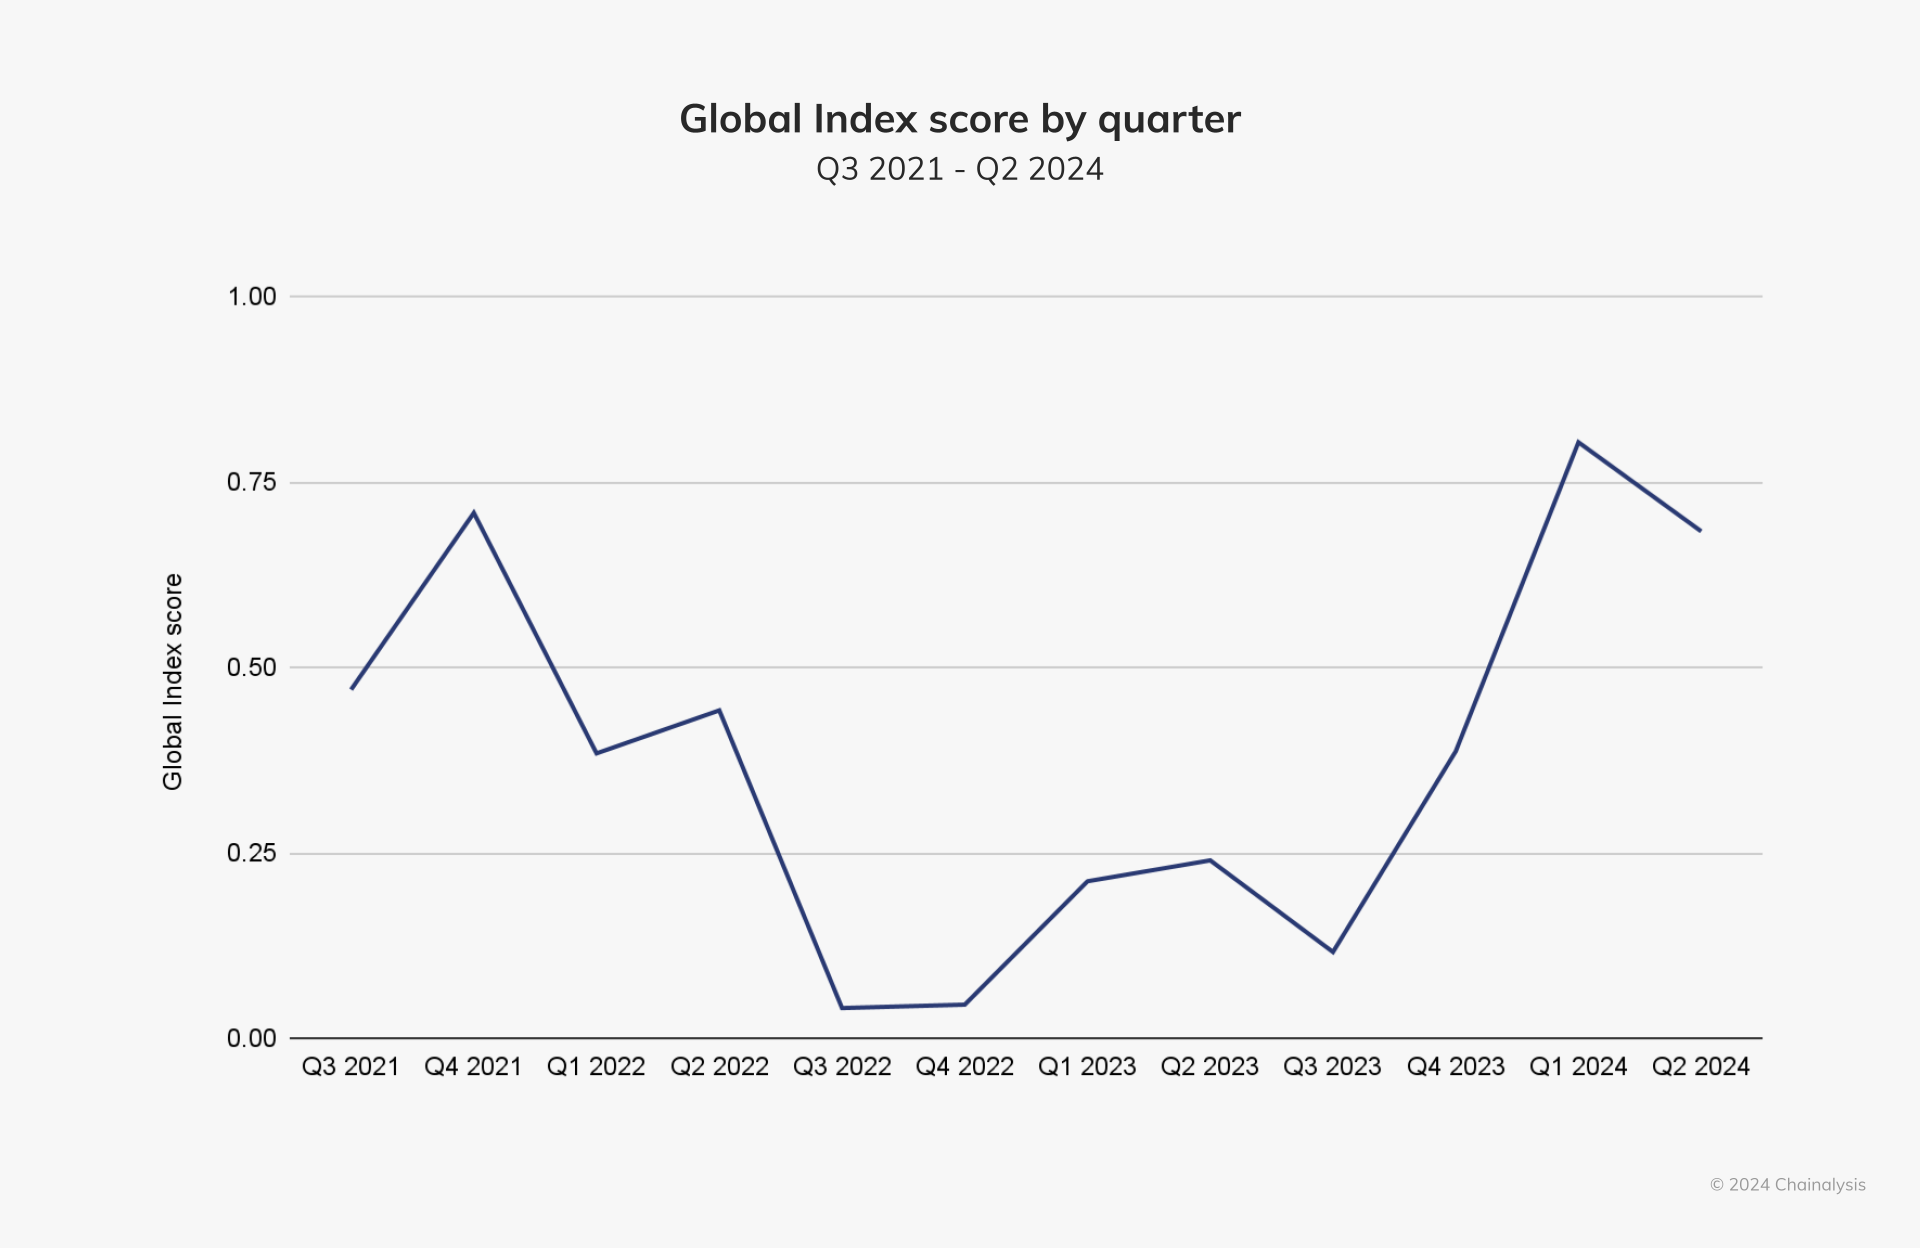
Last year, growth in crypto adoption was primarily driven by lower-income countries. However, this year, crypto activity has increased across all income groups, though high-income countries have seen a pullback since early 2024.
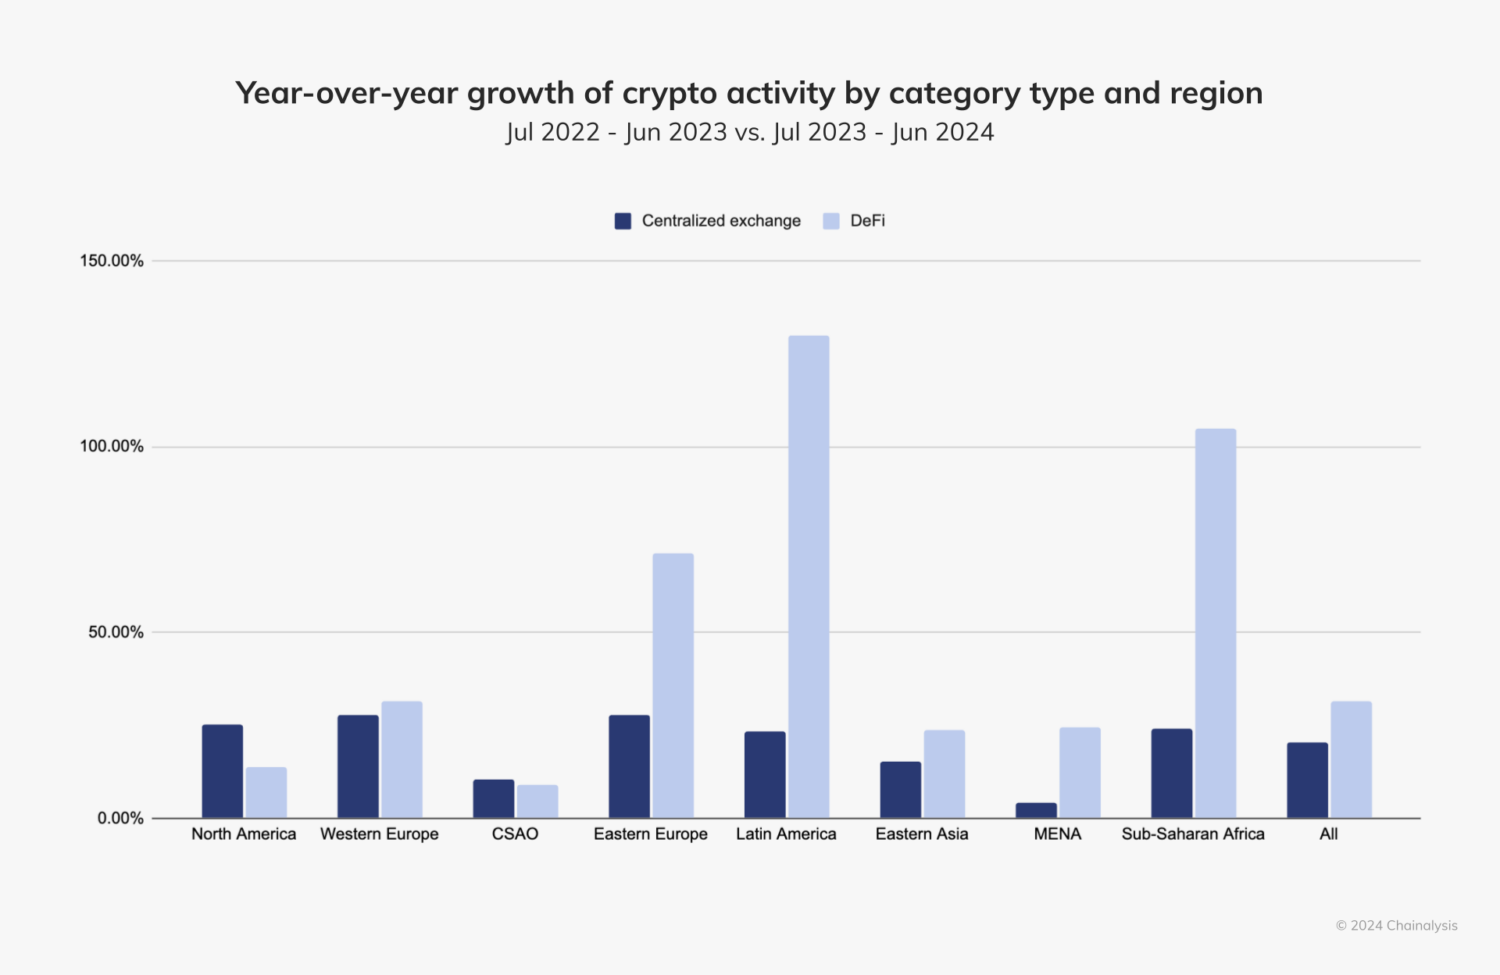
When examining year-over-year growth by service type, decentralized finance (DeFi) activity shows significant increases in Sub-Saharan Africa, Latin America, and Eastern Europe. As shown in the chart above, this growth may be driving increased altcoin activity in these regions.
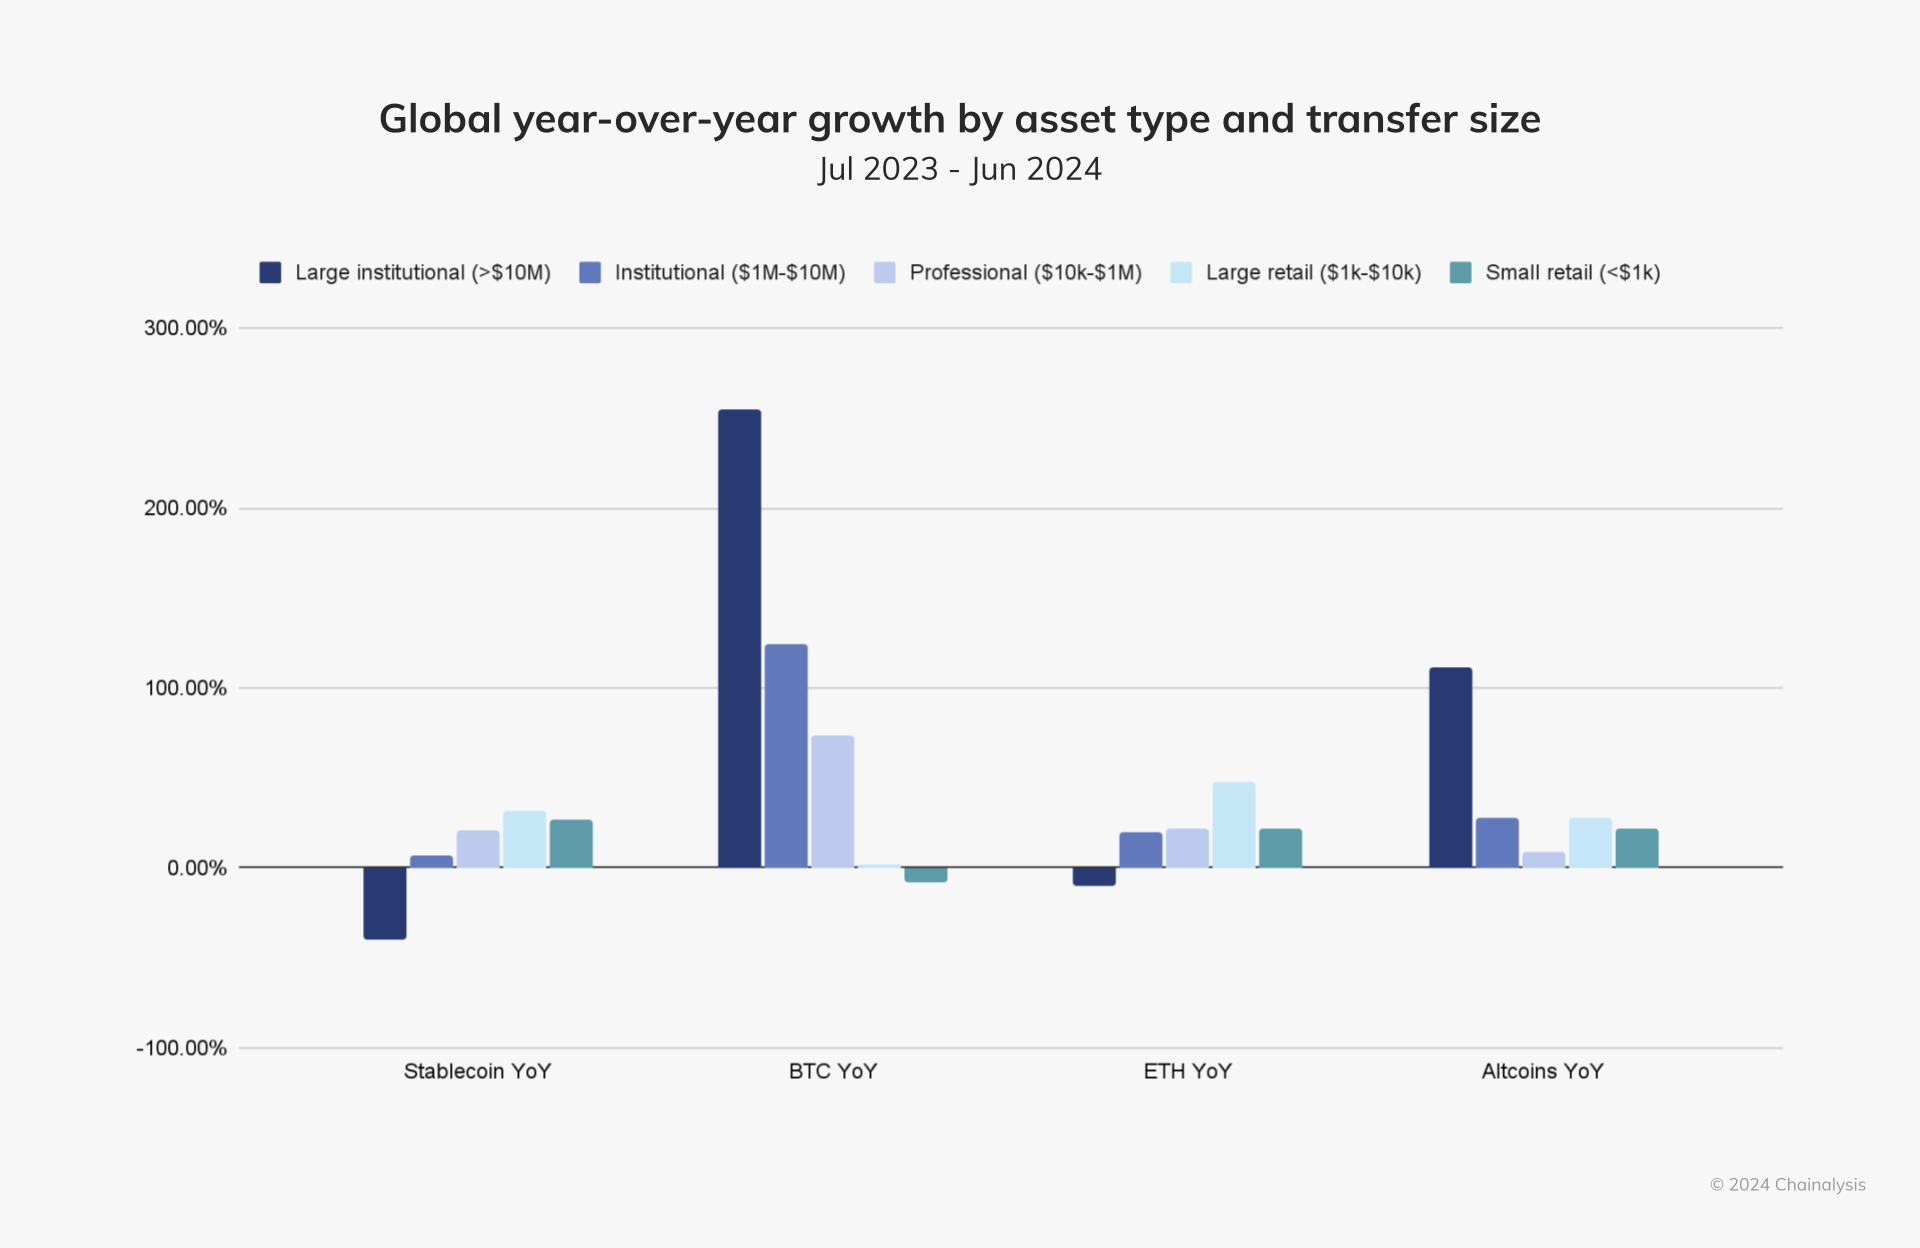
When observing year-over-year growth by service type, decentralized finance (DeFi) activity has grown substantially in Sub-Saharan Africa, Latin America, and Eastern Europe. As shown in the chart above, this growth may be fueling increased altcoin activity in these regions.
To learn more about these trends, recent regulatory developments, and how people around the world are using cryptocurrency, read the full 2024 Geography of Cryptocurrency Report.
Join TechFlow official community to stay tuned
Telegram:https://t.me/TechFlowDaily
X (Twitter):https://x.com/TechFlowPost
X (Twitter) EN:https://x.com/BlockFlow_News