Strategy Test 01 | OKX and AICoin Research Institute: Dollar-Cost Averaging Strategy
TechFlow Selected TechFlow Selected
Strategy Test 01 | OKX and AICoin Research Institute: Dollar-Cost Averaging Strategy
In the simplest way, we'll guide you through classic strategies.
OKX, in collaboration with the premium data platform AICoin, has launched a series of classic strategy research initiatives aimed at helping users better understand and learn different trading strategies through core dimensions such as data-driven testing and strategy characteristics, minimizing blind usage.
Dollar-cost averaging (DCA) is one of the most classic strategies in algorithmic trading. In simple terms, algorithmic trading is a tool that enables automated trading for users, offering advantages over manual trading such as risk reduction and operational simplification. DCA is a method of regular fixed-amount transactions that spreads out the risk of investing a lump sum into the market all at once and smooths transaction costs. By consistently adhering to fixed-amount investments over the long term, investors can leverage the power of compounding to achieve profitability.
Episode 01 introduces the DCA strategy and conducts real-world tests on BTC DCA using two major data models:
1) Analyze the returns generated by dollar-cost averaging since Bitcoin's inception across different halving cycles
2) Analyze annual DCA returns over the past four years
This episode’s data test adopts a time-based DCA model with the following parameters: weekly investment every Monday at 0:00 (UTC+8), amount per investment: 0.1 BTC. Before each investment, profits from the previous round are settled, while the total principal invested so far is retained.
In one sentence: For long-term BTC holders, the market rewards sustained value over time.
Pros and Cons Comparison
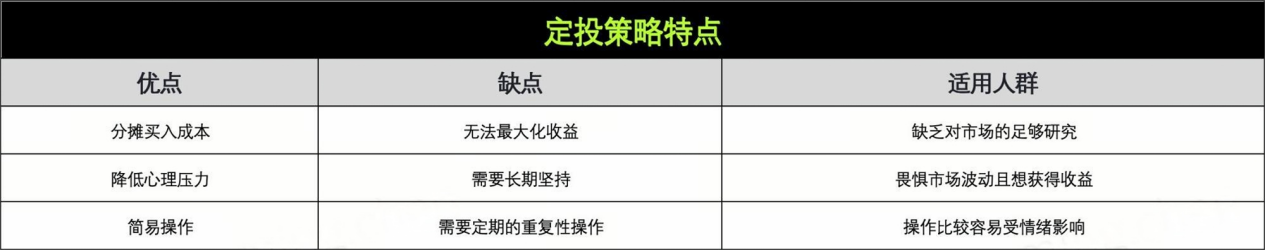
Overall, the DCA strategy is a long-term trading approach suitable for ordinary traders, effectively smoothing market volatility and fostering disciplined trading habits, though it requires patience and a long-term perspective.
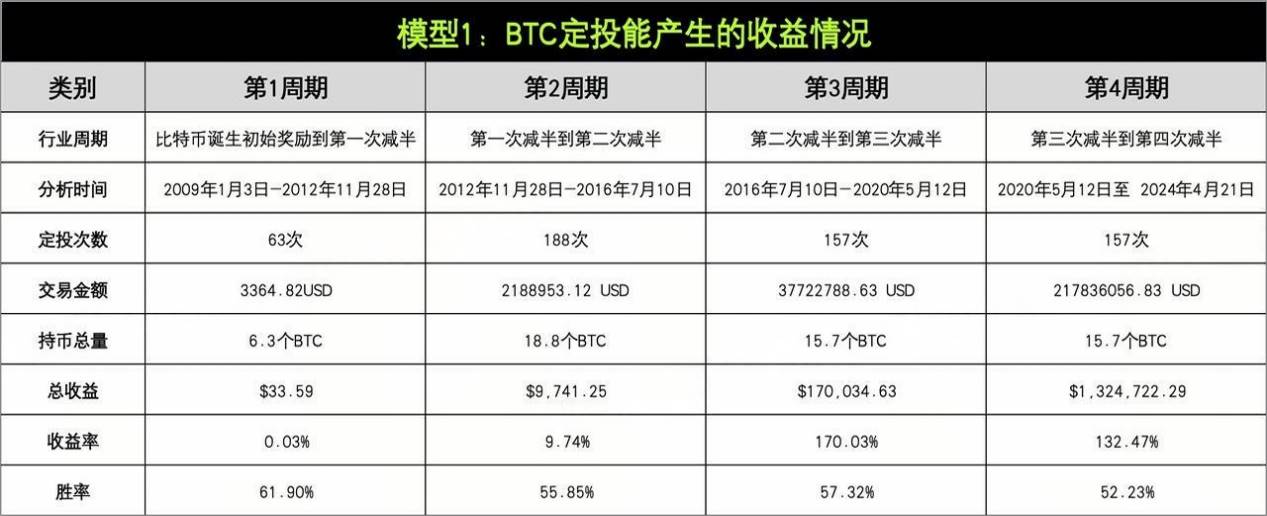
Model One
Analyze DCA returns across different Bitcoin halving cycles since inception
Note: Due to backtesting system settings, transaction amounts include both buying and selling BTC fees. For example, if 0.1 BTC is purchased on the first DCA date, on the second DCA date 0.1 BTC is sold while simultaneously purchasing 0.2 BTC, and so on.
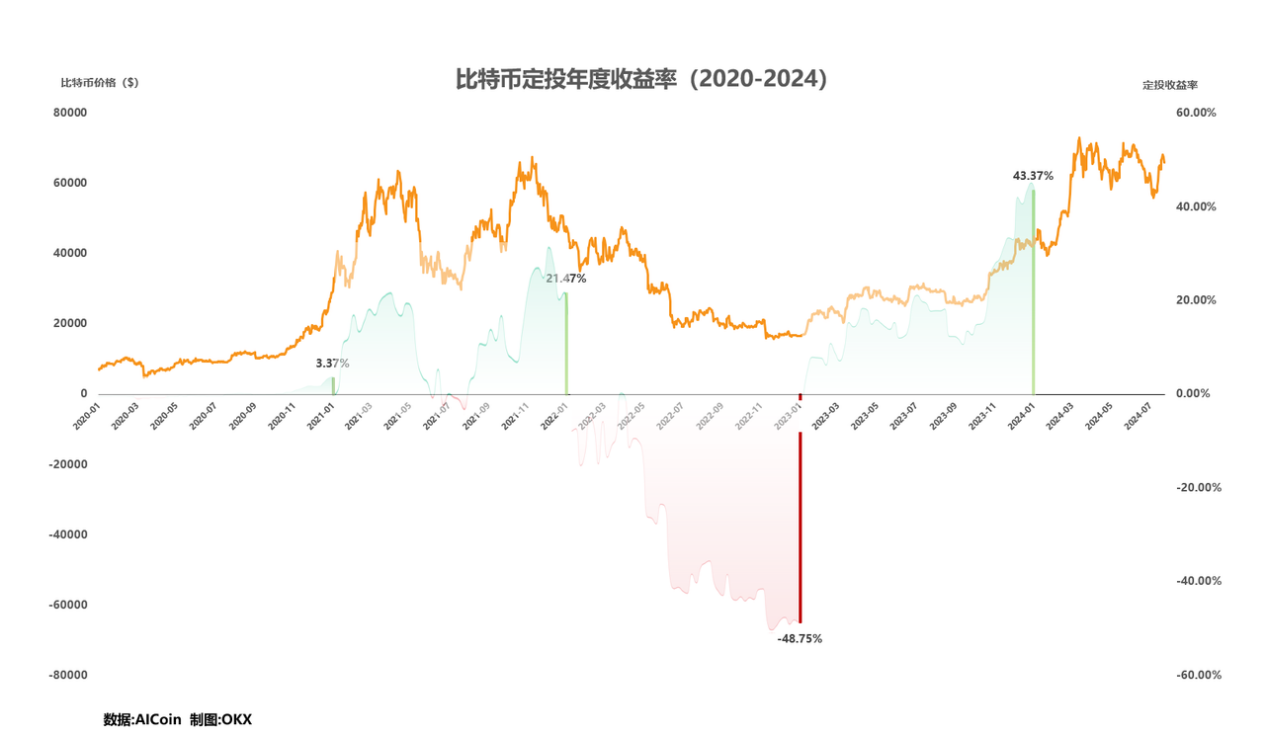
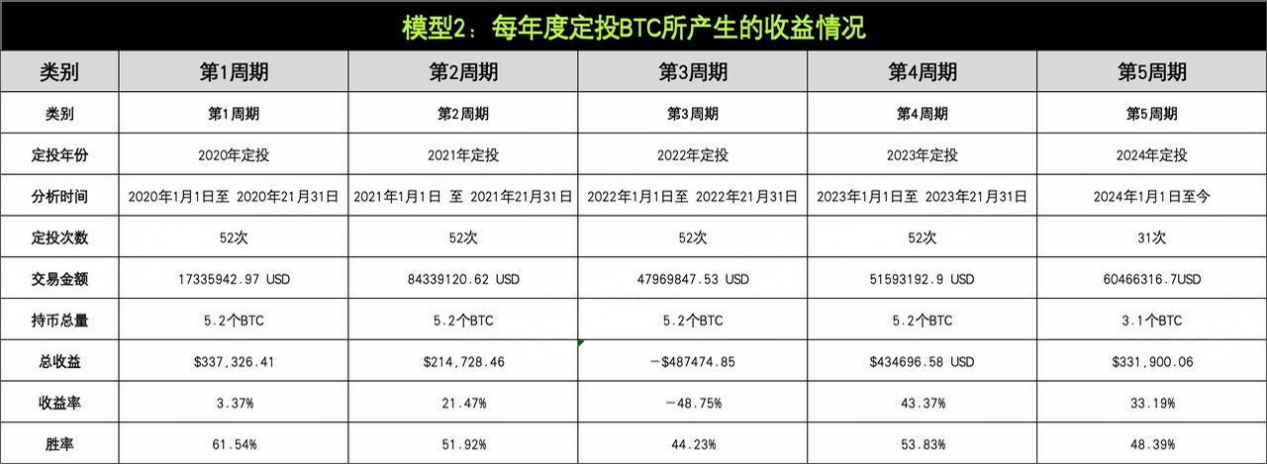
Model Two
Analyze annual DCA returns over the past four years
Note: Due to backtesting system settings, transaction amounts include both buying and selling BTC fees. For example, if 0.1 BTC is purchased on the first DCA date, on the second DCA date 0.1 BTC is sold while simultaneously purchasing 0.2 BTC, and so on.
Analysis and Summary
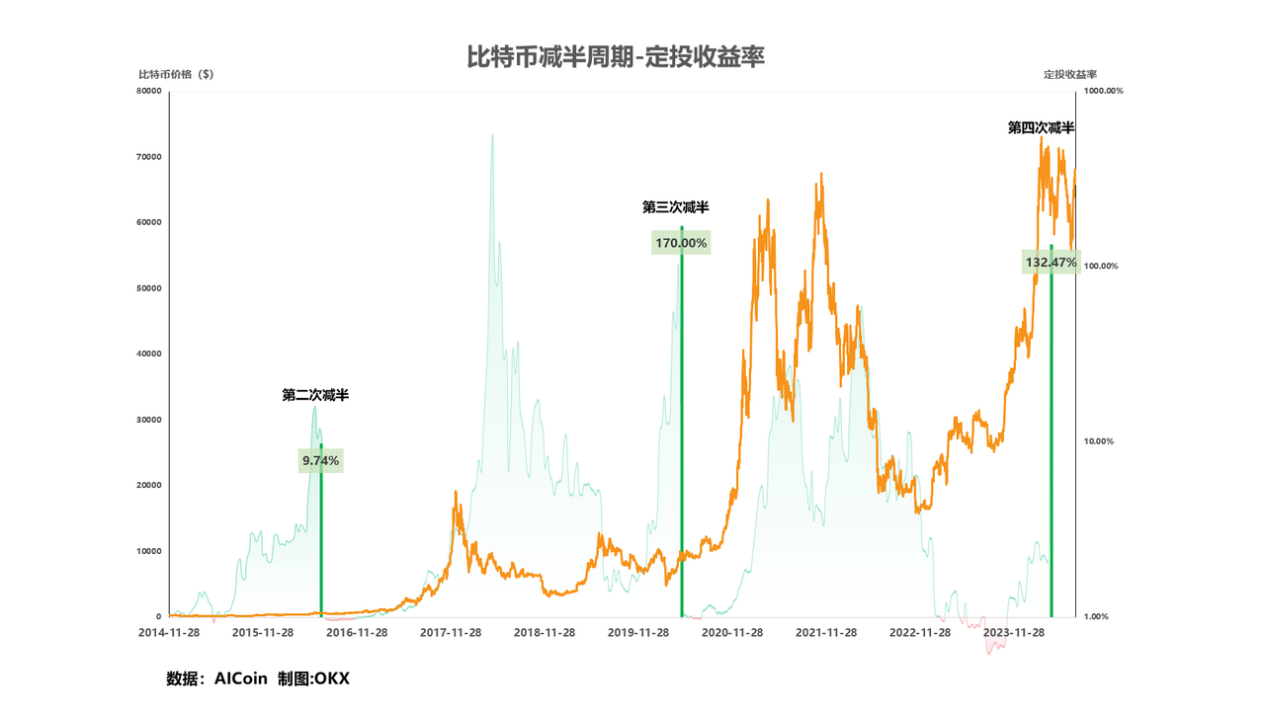
Model One's DCA strategy is based on Bitcoin's industry cycles, spanning four cycles from Bitcoin’s initial block reward to the third halving. The number of DCA entries, transaction volumes, and returns vary across each cycle. Model One shows that returns significantly increase over time alongside rising Bitcoin prices, although it fails to capture maximized gains. For instance, the second cycle yielded a return of 9.74%, whereas the third cycle surged to 170.03%. This model suits long-term traders who gradually accumulate Bitcoin over extended periods, smoothing market fluctuations to ultimately achieve substantial long-term gains. While win rates fluctuate across cycles, they remain above 50% overall, demonstrating high stability and risk resilience. Despite high returns, the inherent large price swings of Bitcoin reduce stability, highlighting the impact of market volatility on performance.
Model Two's DCA strategy operates on an annual basis, analyzing Bitcoin DCA returns from 2020 to 2023. Each year involves exactly 52 DCA entries, maintaining a total holding volume around 5.2 BTC. Annual DCA returns show significant volatility—for example, 2021 achieved a 21.47% return, while 2022 recorded a negative return of -48.75%. This indicates that annual DCA is heavily influenced by short-term market fluctuations. Model Two highlights that even short-term (e.g., one-year) DCA strategies face the risk of negative returns, making them suitable for traders monitoring short-term market behavior. Annual DCA allows quick market assessment and timely strategy adjustments. Although win rates stay around 50%, recent years have seen lower returns compared to Model One, with short-term win rates and returns less stable than long-term approaches.
From a risk-return perspective, Model One delivers exceptionally high returns in certain cycles but exposes investors to significant Bitcoin price volatility—high returns come with high risks. Model Two shows that annual DCA experiences greater short-term volatility, making it unsuitable for conservative investors seeking stable returns, as short-term strategies carry considerable uncertainty. Overall, DCA is better suited for long-term traders who can tolerate market swings and maintain a long-term outlook. Between the two models, Model One’s long-cycle DCA strategy proves more favorable due to its higher win rate and returns across multiple cycles. In conclusion, while DCA is generally robust, different models yield notably different outcomes in both risk and return profiles, requiring users to carefully differentiate when applying DCA strategies.
OKX & AICoin DCA Strategy
The DCA strategy, also known as the average cost method, is one of the most straightforward trading strategies. OKX’s DCA strategy simplifies the implementation of Dollar-Cost Averaging (DCA), supporting purchases across more than 20 different crypto assets. Users can use their USDT balance to periodically invest in a single cryptocurrency at set intervals, or according to preferred portfolios, simultaneously invest in multiple cryptocurrencies at custom ratios to average their purchase prices.
Currently, OKX’s DCA strategy has added new features including pause/resume functionality, switching between tradable assets, setting price ranges for DCA assets (allowing users to define price bands within which DCA executions occur), parameter editing, and viewing historical records—making DCA trading more convenient and efficient.
How to access OKX’s algorithmic trading? Users can navigate via the OKX app or official website to the "Algorithmic Trading" section under trading, then click on "Strategy Plaza" or "Create Strategy" to get started. In addition to creating custom strategies, the Strategy Plaza offers “Premium Strategies” and “Top Performer Strategies,” allowing users to copy or follow these strategies directly.
OKX algorithmic trading offers multiple core advantages including ease of use, low fees, and strong security safeguards.
In terms of usability, OKX provides intelligent parameter recommendations to help users set trading parameters more scientifically, along with图文 and video tutorials to enable fast onboarding and mastery. Regarding fees, OKX has comprehensively upgraded its fee structure, significantly reducing trading costs. On security, OKX employs a world-class security team capable of delivering bank-grade protection.
Currently, OKX algorithmic trading offers convenient and diverse strategy options, including:
• Grid strategies: Spot grid, futures grid, infinite grid
• Average cost: Futures martingale (futures DCA), spot martingale (spot DCA), DCA strategy
• Portfolio arbitrage: Staking Vault, Bottom-Finder, Top-Exit, Arbitrage Orders
• Large order splitting: Iceberg strategy, Time-weighted strategy
• Signal trading: Signal strategy
Among these, grid-type strategies and periodic investment products like Staking Vault are the simplest and most user-friendly. Meanwhile, arbitrage orders, iceberg strategies, and time-weighted strategies are better suited for high-net-worth users, as they involve more complex risk scenarios.
Additionally, AICoin offers various algorithmic trading tools, enabling users to access and understand current market conditions faster and more intuitively. Users can find the "Custom Indicators / Backtesting / Live Trading" option under the "Market" tab in the left sidebar of AICoin products. Clicking there and searching for "DCA" in "Community Indicators" will reveal DCA strategy code.
Disclaimer
This article is for informational purposes only and reflects the author's views, not necessarily those of OKX. This article does not constitute (i) trading advice or recommendations; (ii) an offer or solicitation to buy, sell, or hold digital assets; or (iii) financial, accounting, legal, or tax advice. We do not guarantee the accuracy, completeness, or usefulness of the information provided. Holding digital assets (including stablecoins and NFTs) involves high risk and may experience significant price fluctuations. You should carefully consider whether trading or holding digital assets is suitable for you based on your financial situation. For specific circumstances, please consult your legal/tax/trading professionals. You are solely responsible for understanding and complying with applicable local laws and regulations.
Join TechFlow official community to stay tuned
Telegram:https://t.me/TechFlowDaily
X (Twitter):https://x.com/TechFlowPost
X (Twitter) EN:https://x.com/BlockFlow_News