Digital Gold vs Global Computer: A Comparison of Bitcoin and Ethereum Spot ETFs
TechFlow Selected TechFlow Selected
Digital Gold vs Global Computer: A Comparison of Bitcoin and Ethereum Spot ETFs
How much upside potential can Ethereum ETFs provide?
Author: Andrew Kang
Translation: J1N, Techub News
The approval of spot Bitcoin ETFs has opened the door for many new buyers to enter the cryptocurrency market and allocate Bitcoin in their portfolios. However, the impact of a spot Ethereum ETF is less clear.
When BlackRock filed its spot Bitcoin ETF application, I became strongly bullish on Bitcoin’s price—at that time around $25,000. Since then, Bitcoin has returned 2.6x, while Ethereum has returned 2.1x. From cycle lows, both Bitcoin and Ethereum have seen approximately 4x returns. So how much upside can an Ethereum ETF provide? I believe unless Ethereum develops new models to improve its economics, there won’t be significant room for growth.
On June 19, 2023, I stated, “The approval probability of BlackRock’s spot Bitcoin ETF application is as high as 99.8%—the most positive signal we’ve heard recently, potentially unlocking the floodgates for tens of billions in capital flows. Yet, Bitcoin’s price rose only 6%, underperforming expectations.”
Flow Analysis
Overall, while spot Bitcoin ETFs have accumulated $50 billion in AUM (assets under management), when you exclude pre-existing GBTC AUM and replacement flows (selling futures or spot to buy spot ETFs), the net inflow since launch amounts to $14.5 billion. However, these are not truly organic inflows, as numerous delta-neutral flows must be considered—such as basis trades (short futures, long spot ETF) and selling spot to buy spot ETF. By analyzing CME data and ETF holder behavior, I estimate about $4.5 billion of net flow stems from basis trading. ETF experts indicate large holders like BlockOne have converted substantial spot Bitcoin into spot ETFs—estimated at roughly $5 billion. After deducting these flows, real net purchases by spot Bitcoin ETFs amount to approximately $5 billion.
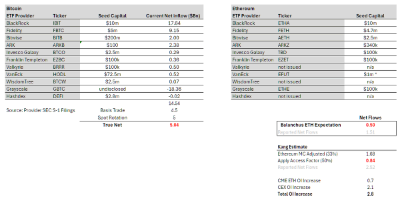
Using this framework, we can extrapolate what Ethereum flows might look like. Bloomberg ETF analyst @EricBalchunas estimates Ethereum flows could reach 10% of Bitcoin's. This implies $500 million in true net buying over six months, with reported net flows of $1.5 billion. Although @EricBalchunas isn't always accurate, his view likely reflects broader sentiment among traditional financial institutions.
Personally, I think Ethereum flows may reach 15% of Bitcoin’s. Starting from Bitcoin’s $5 billion in real net purchases (as noted above), adjusting for Ethereum’s market cap (33% of Bitcoin’s) and an “access coefficient” of 0.5, we arrive at $840 million in true net buying and $2.52 billion in reported net inflows. There are reasonable arguments that ETHE (Grayscale Ethereum Trust) carries less premium than GBTC, so an optimistic scenario could yield $1.5 billion in true net purchases and $4.5 billion in reported net inflows—about 30% of Bitcoin’s flow.
In any case, even the optimistic estimate of $1.5 billion in true net buying for spot Ethereum ETFs remains far below the current $2.8 billion in inflows into Ethereum derivatives—not including front-running spot demand (buying ahead of expected bullish momentum). This means pre-launch capital flows into Ethereum already exceed projected ETF inflows, implying the price impact of a spot Ethereum ETF is largely priced in.
“Access Coefficient”: An adjustment based on ETF liquidity and differing investor bases. Bitcoin clearly benefits more than Ethereum due to its appeal to institutions facing access barriers—macro funds, pensions, endowments, sovereign wealth funds—for which Bitcoin serves as a macro asset. Ethereum, conversely, resembles a tech asset more attractive to VCs, crypto-native funds, technologists, and retail investors who face fewer access constraints. The 50% factor comes from comparing Ethereum’s and Bitcoin’s CME open interest (OI) relative to market cap.
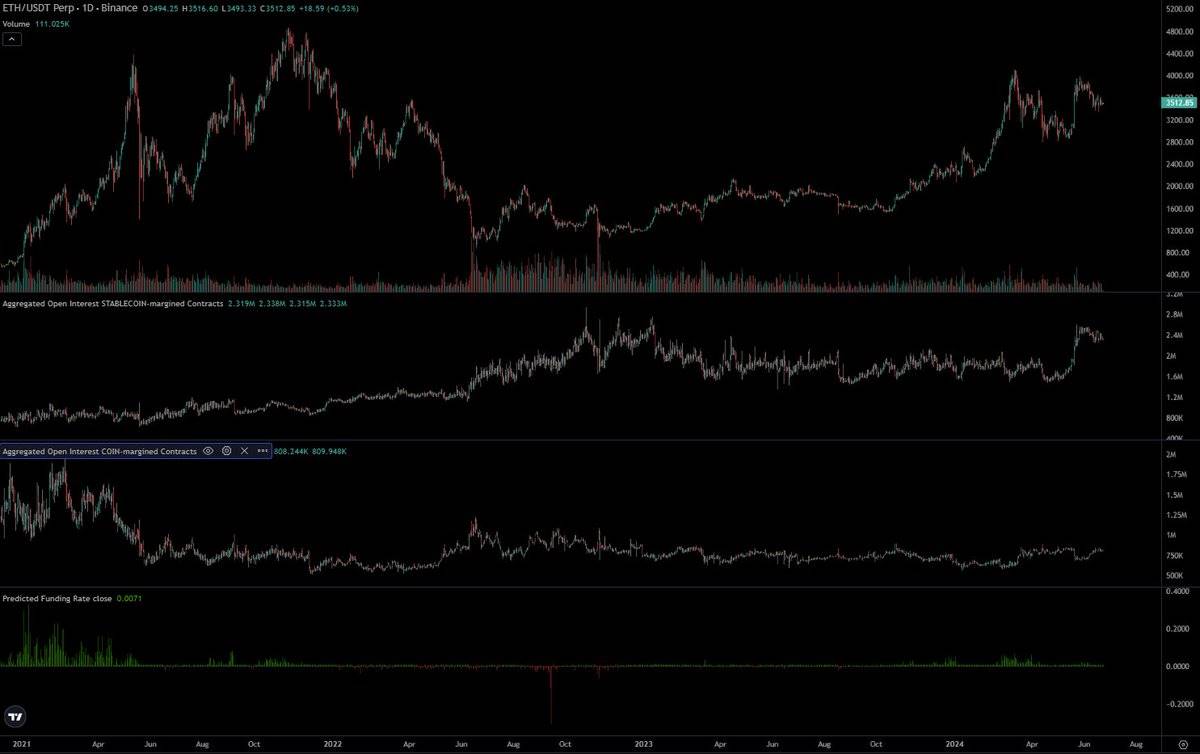
Looking at CME data, Ethereum’s OI was notably lower than Bitcoin’s before the launch of spot ETFs. OI represented about 0.3% of supply versus 0.6% for Bitcoin. Initially, I saw this as early-stage development, but it could also reflect limited interest from traditional finance in Ethereum ETFs. Wall Street traders favor Bitcoin spot ETFs—they often have first-hand information—so their lack of similar positioning in Ethereum suggests valid reasons, possibly insufficient clarity on Ethereum’s liquidity profile.
How Did $5 Billion Push Bitcoin from $40K to $65K?
The clearest answer is: $5 billion alone couldn’t do it. There were many other buyers in the spot market. Bitcoin is globally recognized as a key portfolio asset, held long-term by major institutions such as Saylor, Tether, family offices, and high-net-worth individuals. While Ethereum also has institutional holders, I believe they are fewer in scale compared to Bitcoin.
Recall that Bitcoin had already reached an all-time high of $69,000—over $1.2 trillion in market cap—before spot ETFs existed. Market participants and institutions already held massive amounts of spot crypto. Coinbase custodied $193 billion, with $100 billion coming from other institutions. In 2021, Bitgo reported $60 billion in AUC; Binance held over $100 billion. Six months after launch, spot Bitcoin ETFs held 4% of Bitcoin’s total supply.
On February 12, I tweeted about the scale of the crypto market: “I estimate long-term annual Bitcoin demand this year will exceed $40–130 billion. One of the biggest blind spots among crypto investors is underestimating global wealth, income levels, capital liquidity, and their potential impact on crypto. We constantly hear stats about gold, equities, and real estate valuations—crypto may seem small in comparison. Many in crypto live in echo chambers, but the more you travel and meet entrepreneurs, business owners, and HNWIs, the more you realize just how unimaginably vast the pool of USD capital is—and how much of it could eventually flow into Bitcoin or other cryptos.”
Let me illustrate with a rough demand-sizing exercise. The average U.S. household income is $105,000. With 124 million households, total U.S. personal income reaches $13 trillion annually. The U.S. accounts for 25% of global GDP, so global income is ~$52 trillion. Assume 10% global crypto ownership (15% in the U.S., up to 25–30% in UAE). If crypto owners allocate just 1% of annual income, that’s $52 billion per year spent on BTC—about $150 million daily.
At the time of the spot Bitcoin ETF launch, MSTR (MicroStrategy) and Tether bought billions in Bitcoin, along with early entrants whose cost basis was low. At the time, many believed the ETF approval would trigger profit-taking. As a result, billions in short-, medium-, and long-term positions were sold and now need to be repurchased. Crucially, once spot ETF flows established a strong upward trend, short sellers had to cover. Prior to the ETF launch, open interest actually declined—which is remarkable.
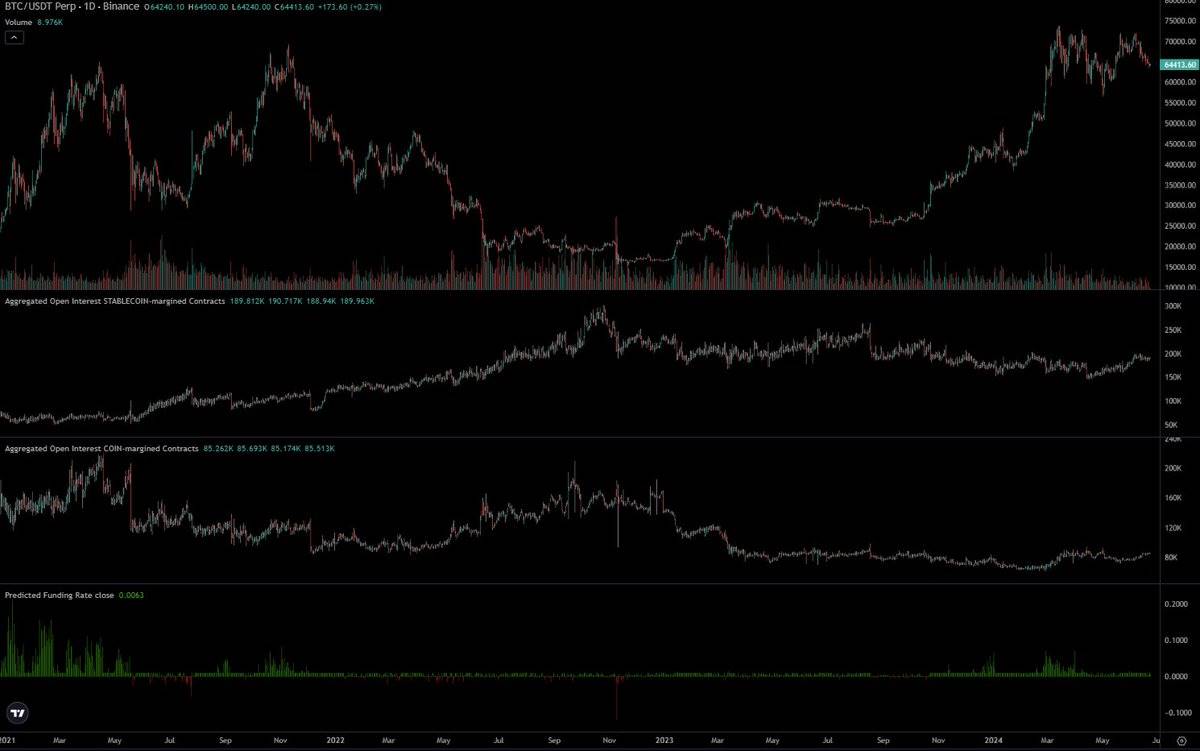
The setup for spot Ethereum ETFs is very different. Ethereum’s price is now 4x its pre-ETF-launch low, whereas Bitcoin is up 2.75x. Native CEX OI has increased by $2.1 billion, bringing it close to ATH levels. The market is efficient. Naturally, many crypto natives observed the success of spot Bitcoin ETFs and positioned similarly for Ethereum.
Personally, I believe crypto-native expectations are exaggerated and disconnected from actual preferences in traditional finance. This leads those deeply embedded in crypto to overestimate Ethereum’s psychological share and purchase volume. In reality, for many large non-crypto-native capital groups, Ethereum’s allocation as a core portfolio holding is significantly smaller.
A common narrative in traditional finance is that Ethereum is a “tech asset”—a global computer, Web3 app store, decentralized financial settlement layer, etc. It’s a compelling story, and one I bought into during the last cycle. But when examining actual revenues, it becomes hard to justify.
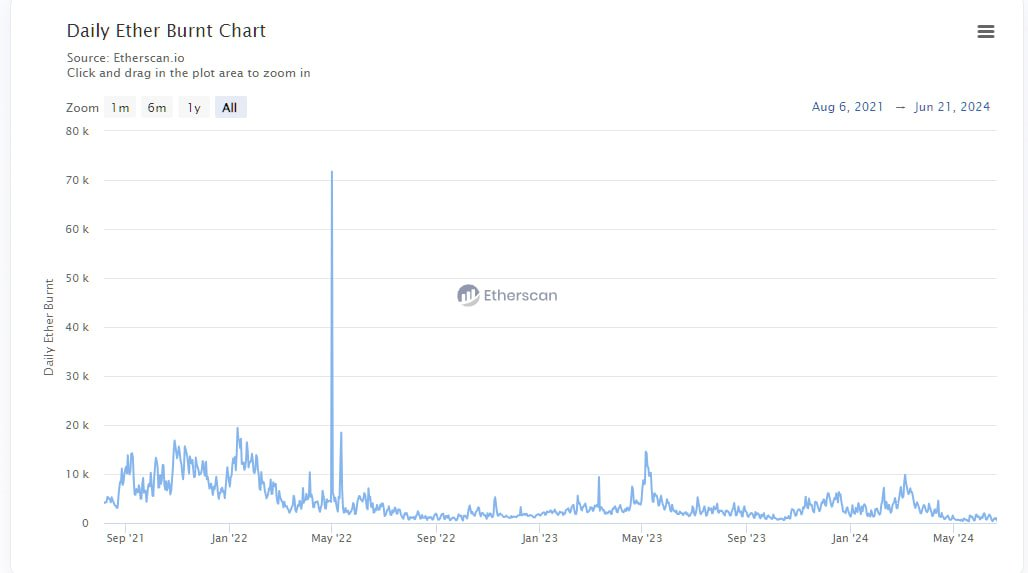
In the previous cycle, you could point to growing fee revenue and argue convincingly for Ethereum as a tech investment—similar to tech stocks—based on DeFi and NFT activity generating cash flows. But in this cycle, quantifying fees backfires. Most charts show flat or negative growth. Ethereum is essentially a money machine that, at annualized rates, generates $1.5 billion in revenue over 30 days—trading at a P/E of 300x, or negative P/E after inflation. How can analysts justify this valuation to their family office or macro fund bosses?
I even expect initial fugazi (phantom volume not backed by real capital inflows) flows to be lower, for two reasons. First, the spot Ethereum ETF approval came as a surprise—issuers didn’t have enough time to convince large holders to convert their ETH into ETF shares. Second, the incentive to convert is weaker because holders would have to give up staking yields or DeFi returns. Note, however, that only 25% of Ethereum is currently staked.
Does this mean Ethereum will go to zero? Absolutely not. At some price, it becomes fairly valued. And when Bitcoin rises in the future, Ethereum doesn’t necessarily follow proportionally. Before the spot ETF launch, I expected Ethereum to trade between $3,000 and $3,800. Post-launch, my range is $2,400 to $3,000. However, if Bitcoin reaches $100,000 in Q4 2024 or Q1 2025, that could push Ethereum above its ATH—but it may subsequently weaken against Bitcoin. Long-term, there are developments worth watching: you must believe BlackRock and Fink are actively building financial infrastructure on blockchains and tokenizing more assets. The extent and timing of Ethereum’s benefit from this remain uncertain.
I expect the ETH/BTC ratio to continue its downward trend, ranging between 0.035 and 0.06 over the next year. Although our sample size is small, we have consistently seen lower highs in ETH/BTC each cycle—so this should come as no surprise.
Join TechFlow official community to stay tuned
Telegram:https://t.me/TechFlowDaily
X (Twitter):https://x.com/TechFlowPost
X (Twitter) EN:https://x.com/BlockFlow_News