VanEck 2030 Ethereum Outlook and Allocation Report: Bull Case Target Up to $154,000
TechFlow Selected TechFlow Selected
VanEck 2030 Ethereum Outlook and Allocation Report: Bull Case Target Up to $154,000
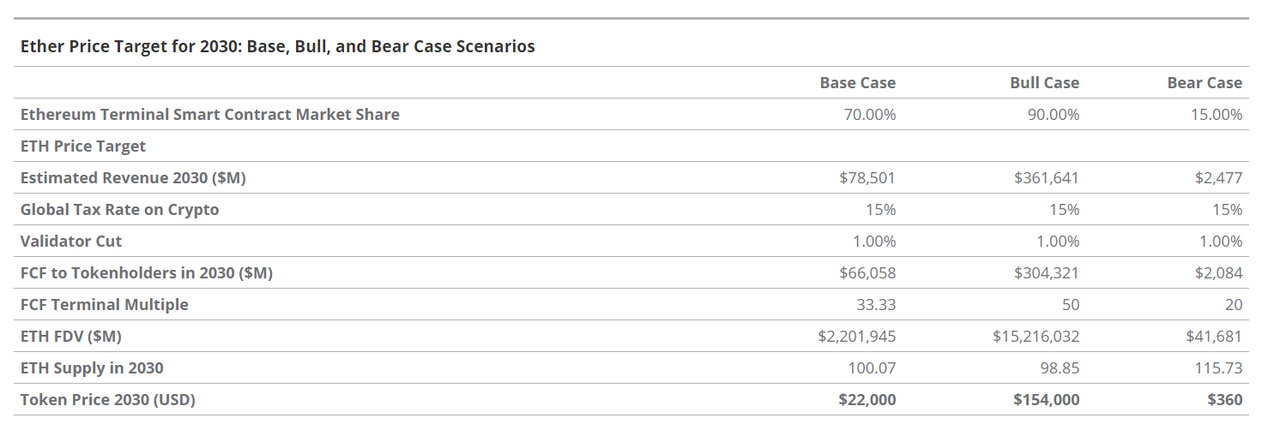
Base forecast predicts ETH will rise to $22,000 by 2030, potentially reaching $154,000 in an optimistic bull market scenario, while in a bear market it could drop as low as $360.
Authored by: Matthew Sigel, Patrick Bush, Denis Zinoviev, VanEck
Translated by: 1912212.eth, Foresight News
We anticipate that spot ETH ETFs will soon be approved for trading on U.S. securities exchanges. This milestone development will allow financial advisors and institutional investors to hold this asset under the custody of qualified custodians, benefiting from the pricing and liquidity advantages unique to ETFs. In response, we have updated our financial model and reassessed ETH’s fundamental investment case. We have also conducted a series of quantitative analyses on how ETH interacts with BTC within traditional 60/40 portfolios, focusing on trade-offs between risk and return.
Key takeaways from this article:
-
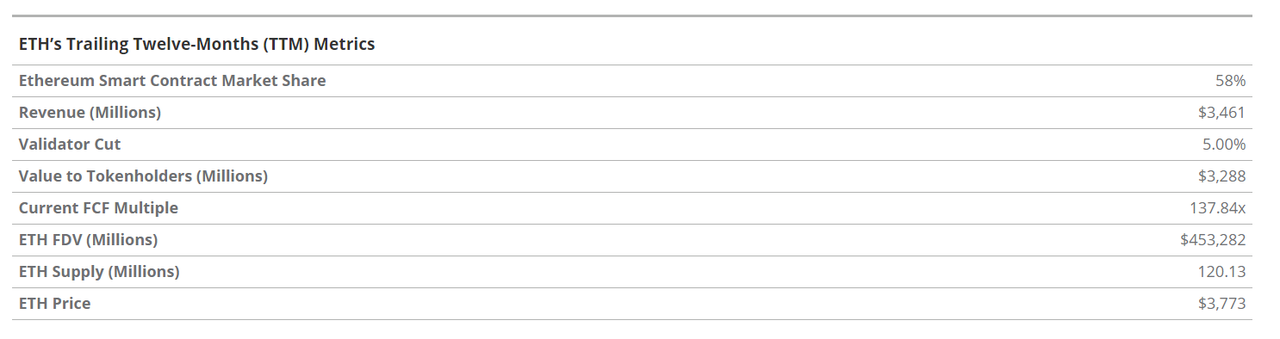
The Ethereum network may continue to rapidly gain market share from traditional financial market participants and an increasing number of large technology companies. If Ethereum maintains its dominance among smart contract platforms and achieves the growth outlined above, we believe its free cash flow (CFC—net ETH available after accounting for all network costs such as gas fees for transactions and smart contracts) could reach $66 billion by 2030, with a market capitalization of $2.2 trillion and a price per ETH of $22,000.
-
Adding a modest allocation to cryptocurrencies (up to 6%) in a traditional 60/40 portfolio can significantly improve the portfolio’s Sharpe ratio, with relatively minor impact on drawdowns. A near 70/30 allocation between Bitcoin and Ethereum in a pure-crypto portfolio offers optimal risk-adjusted returns.
Assessing Ethereum Investment
ETH is the native token of Ethereum, a novel asset class providing exposure to a high-growth, internet-native business system capable of disrupting existing financial services and major tech platforms like Google and Apple. Over the past 12 months, Ethereum has attracted approximately 20 million monthly active users, settled $4 trillion in value, and facilitated $5.5 trillion in stablecoin transfers. The platform hosts over $91.2 billion in stablecoins, $6.7 billion in tokenized off-chain assets, and $308 billion in digital assets. At the core of this financial system is the ETH token. Based on our updated fundamentals, we project ETH reaching $22,000 by 2030—a total return of 487% from current prices, representing a compound annual growth rate (CAGR) of 37.8%.
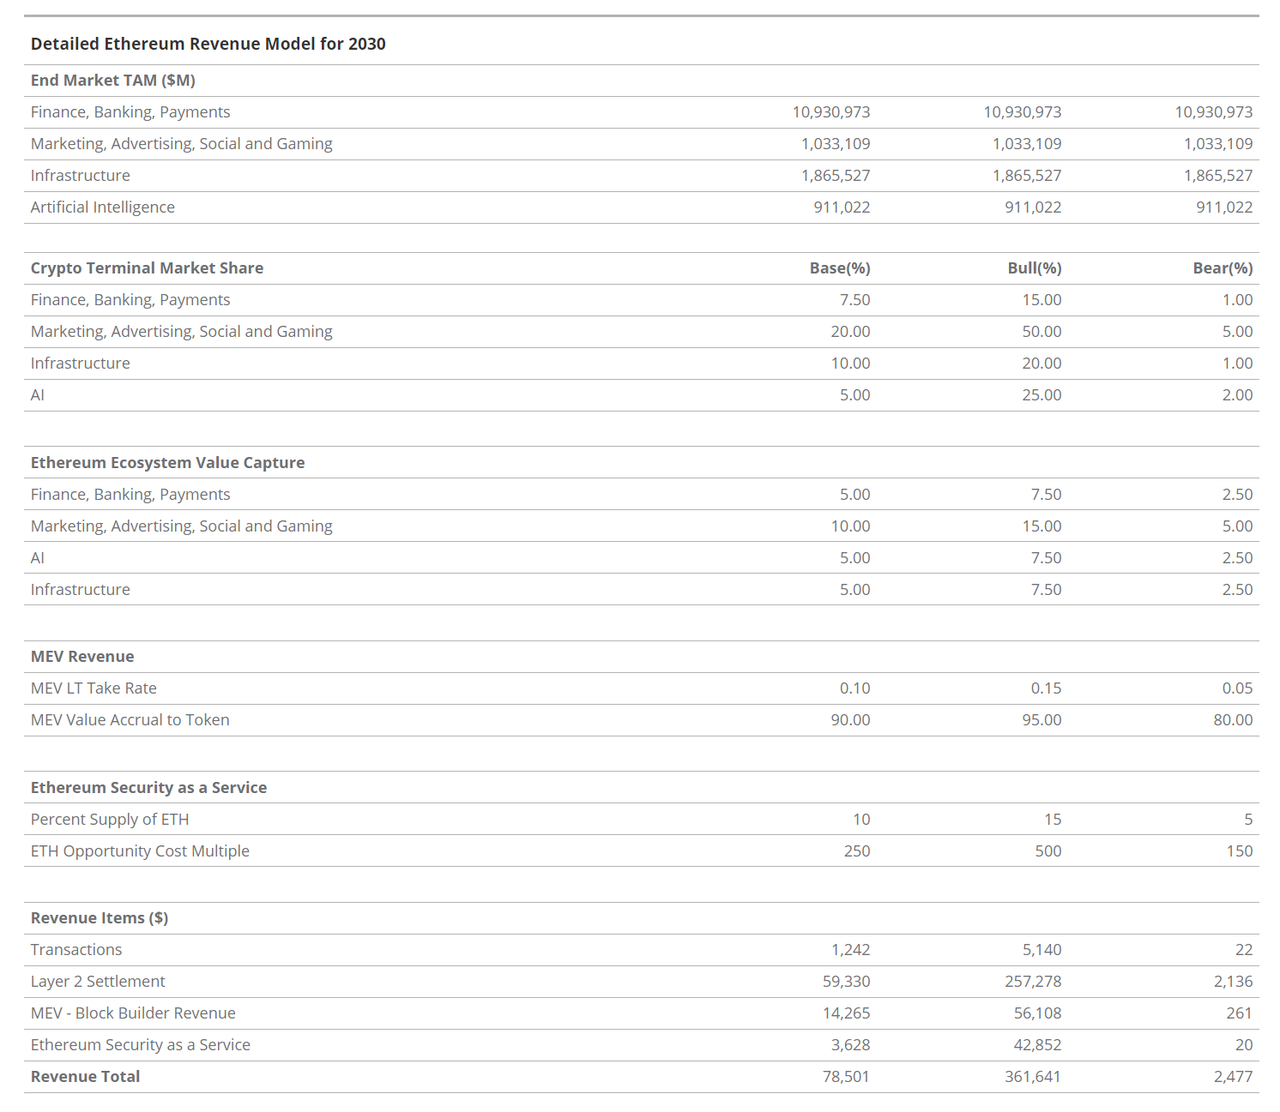
Our forecast for ETH’s valuation in 2030 is based on projected free cash flows of $66 billion attributable to the ETH token. We estimate a price-to-earnings (P/E) multiple of 33x for these cash flows. As Ethereum is an application platform, we begin by estimating the total addressable market (TAM) size of industries it could disrupt through blockchain applications. We estimate the combined annual revenue TAM across these verticals at $15 trillion.
-
Finance, Banking, and Payments (FBP) – $10.9 trillion
-
Marketing, Advertising, Social, and Gaming (MASG) – $1.1 trillion
-
Infrastructure (I) – $1.8 trillion
-
Artificial Intelligence (AI) – $1.4 trillion
Using this TAM data, we estimate Ethereum's potential market capture across these sectors: 7.5% for FBP, 20% for MASG, 10% for I, and 5% for AI. We then estimate the share of crypto applications built on Ethereum rather than other blockchains—our base case being 70%. We estimate the fee Ethereum charges application users, effectively a “revenue share” of 5–10%. We recently updated our ETH model from spring 2023 to include the AI end market, reflecting Ethereum’s significant potential in this domain. Other impactful adjustments include increased ETH supply burn, larger end-market capture, and higher adoption rates for underlying economic activity. These changes are justified by recent innovations making Ethereum more accessible and evolving political dynamics in the U.S.
We believe ETH is a revolutionary asset with few parallels in traditional finance. ETH can be seen as “digital oil,” as it is consumed through participation in activities on Ethereum. ETH can also be viewed as “programmable money,” because ETH and other Ethereum-based assets can be automatically financialized on Ethereum without intermediaries or censorship. Additionally, we consider ETH a “yield commodity,” as it earns ETH rewards when staked non-custodially to validators securing the Ethereum network. Finally, we see ETH as an “internet reserve currency,” serving as the foundational asset pricing all activity and most digital assets across the $1+ trillion Ethereum ecosystem and its 50+ connected blockchains.
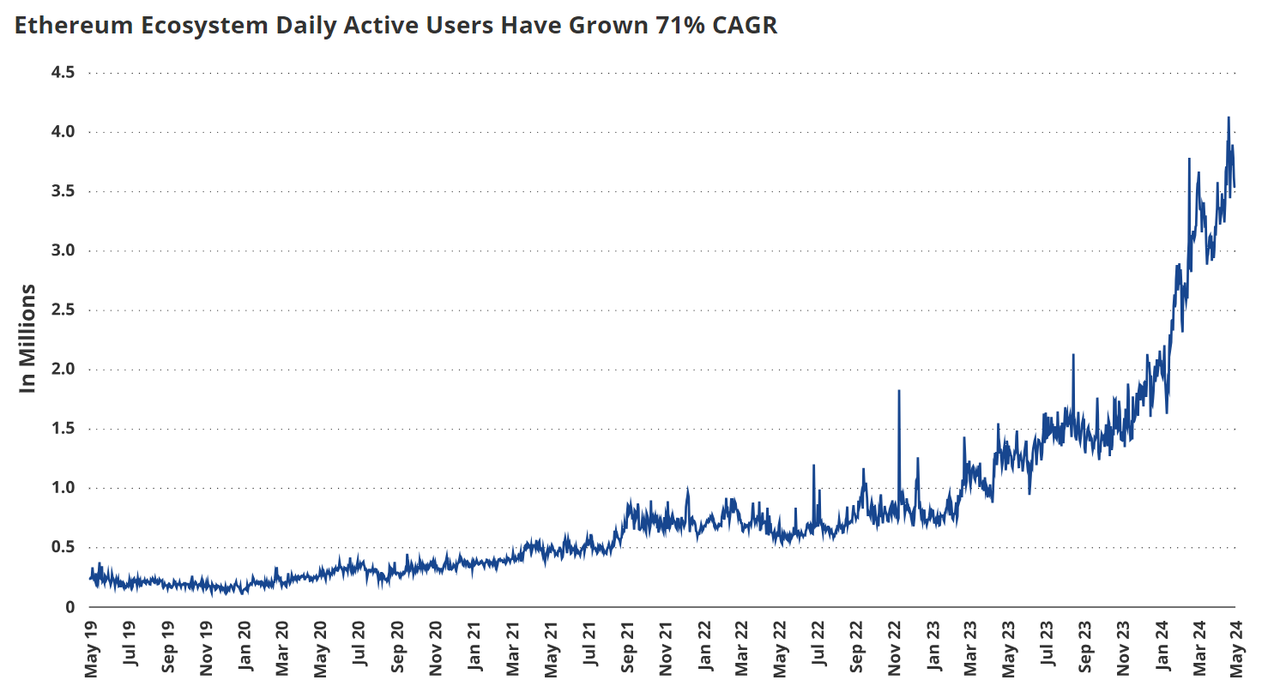
Regardless of classification, ETH benefits from Ethereum’s growing usage. Ethereum is a dynamic economic platform akin to a digital marketplace, whose user base has grown 1,500% since 2019, with revenue surging at a 161% CAGR. Over the past year, Ethereum generated $3.4 billion in revenue. Since ETH must be purchased to use Ethereum, all ETH holders benefit from demand-driven inflows. Moreover, 80% of this ETH revenue is used to buy back and burn circulating ETH, permanently removing it from supply—analogous to irreversible stock buybacks.
Over the past six months, 541,000 ETH worth $1.58 billion (0.4% of total supply) has been burned. Thus, ETH holders receive dual benefits from Ethereum’s activity: both user-driven ETH purchases and supply reduction via burning. ETH users can also earn approximately 3.5% annual yield by staking ETH to validator entities on the Ethereum network, which provide the collateral needed to operate the network.
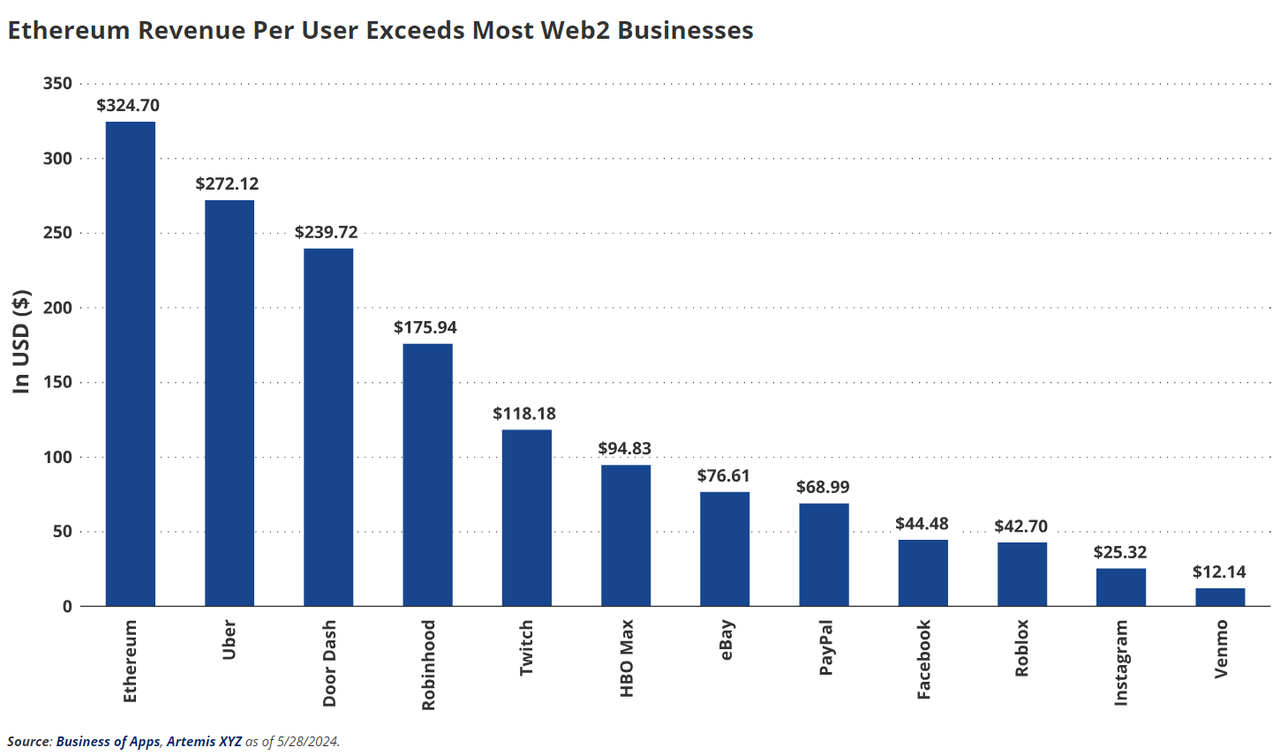
In terms of revenue, Ethereum ($3.4 billion) outperforms Web2 apps such as Etsy ($2.7 billion), Twitch ($2.6 billion), and Roblox ($2.7 billion). Ethereum’s monthly active users (20 million) exceed those of Instacart (14 million), Robinhood (10.6 million), and Vrbo (17.5 million). Furthermore, Ethereum’s average annual revenue per monthly active user is $172—comparable to Apple Music ($100), Netflix ($142), and significantly higher than Instagram ($25). We classify Ethereum as a platform business similar to Apple App Store or Google Play. However, Ethereum holds a significant advantage over Web2 platforms by offering unique value propositions unavailable in traditional systems.
One of the most compelling aspects of using Ethereum is the cost savings it provides for businesses and users. Apple and Google take around 30% of app hosting revenues, while Ethereum currently captures about 24% (14% for non-DeFi apps). Furthermore, we expect Ethereum’s take rate to drop to 5–10% within the next 18 months as activity shifts to cheaper Ethereum L2s (current take rate: 0.25%–3%). From a payments perspective, credit card processors and PayPal charge 1.94% on all transactions (2.9% for commercial transactions), while Visa charges 1.79%–2.43% or more.
Compared to data-centric social networks like Facebook, we believe Ethereum may offer entrepreneurs more powerful and profitable application opportunities. Ethereum allows permissionless deployment and open interoperability within public, open-source data. Thus, anyone can build applications leveraging critical data—including on-chain records of all user activity—as if Visa freely provided customer payment data. For example, the social app Farcaster currently generates $75.50 in monthly revenue per active user, compared to ~$44 for Facebook. More attractively, Farcaster’s open incentive structure results in superior engagement: users spend an average of 350 minutes daily, versus 31 minutes on Facebook.
As a result of Ethereum’s properties, some profits earned by big finance, big tech, and big data can be transferred to users in the form of consumer surplus. As more data becomes publicly available and commerce migrates away from expensive, closed financial rails, competitive moats will erode. This could lead to new business models built around low-margin economics powered by open source. Consumers and app builders will migrate to Ethereum. We believe that over the next 5–10 years, 7% to 20% of Web2/big finance revenues—trillions of dollars—could be displaced by systems like Ethereum, primarily flowing back to users and developers. Additionally, Ethereum’s unique ownership features enable censorship-resistant digital presence on social media and gaming apps. If government censorship of information intensifies, these capabilities will become increasingly valuable.
There is strong reason to believe public blockchains like Ethereum will become key backend infrastructure for AI applications. The surge in AI agents and their economies will require unrestricted value transfer, proof-of-personhood, and clearly defined data/model provenance—unique attributes available on blockchains but absent in existing tech infrastructure. We estimate the global TAM for AI productivity gains could reach $8.5 trillion by 2030. Assuming 66% enterprise adoption, 25% AI software value capture, and 72% non-hardware value capture, we project a potential TAM of $911 billion for crypto-AI synergy, with $45.5 billion in revenue for open-source AI apps and infrastructure, of which $1.2 billion could directly accrue to ETH holders.
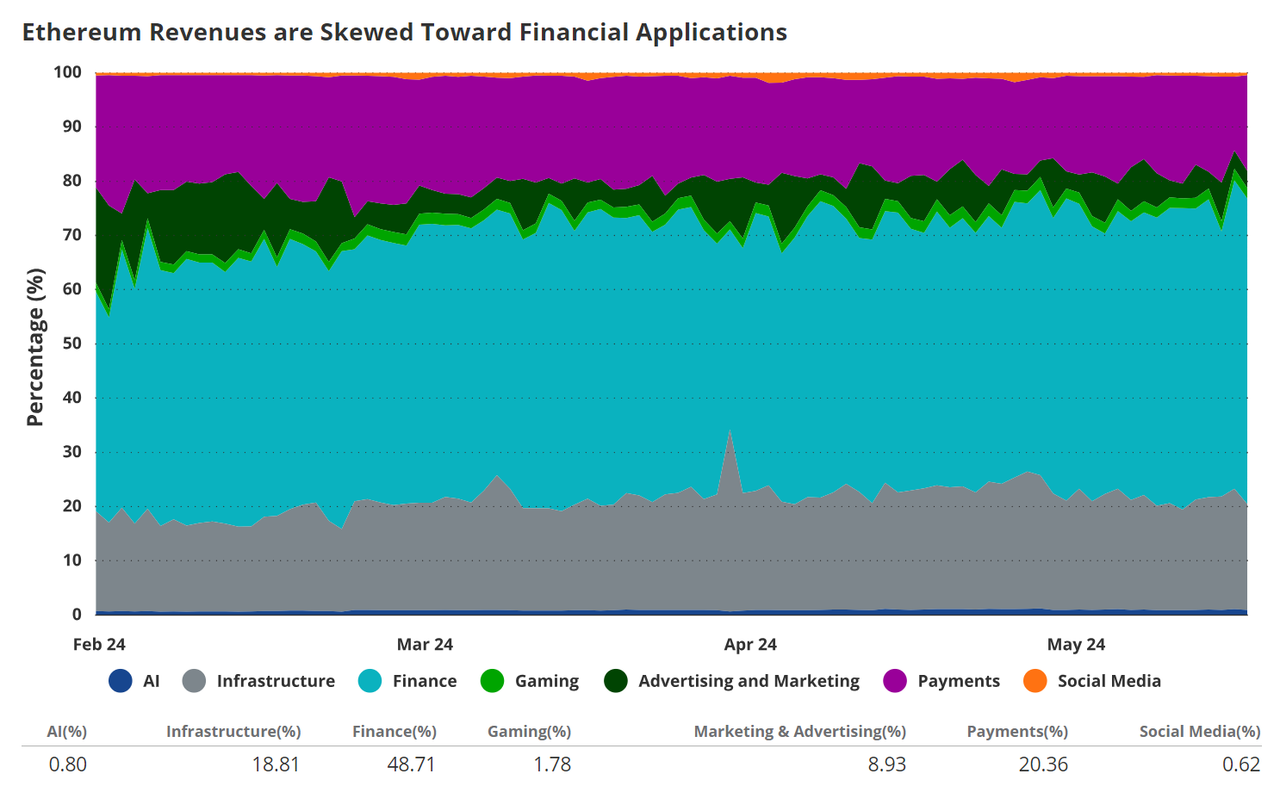
Currently, most activity on Ethereum is financial in nature. Decentralized exchanges and lending protocols account for 49% of Ethereum’s revenue, while simple value transfers make up 20%. These fall under the Finance, Banking, and Payments (FGP) category. Meanwhile, Infrastructure (I) accounts for the second-largest share at ~19%, related to decentralized operations and software serving dApps. Lastly, we categorize social media and NFT-related activity under Marketing, Advertising, Social, and Gaming (MASG), contributing 11% of revenue. Currently, AI plays a minimal role in generating revenue for Ethereum.
Ethereum’s revenue stems from the aforementioned end markets and includes transaction fees, Layer 2 settlements, block space ordering (MEV), and security-as-a-service. Transaction fees are paid by users (and future autonomous agents) to use applications or transfer value on Ethereum. Layer 2 settlements refer to revenue paid by Ethereum L2s to Ethereum for finalizing transactions. MEV refers to income generated from fees users pay for priority transaction ordering. Security-as-a-service involves using ETH as collateral to support permissionless applications requiring such value for operation. Over the past year, ~72% of Ethereum’s revenue came from transaction fees, ~19% from MEV, ~9% from L2 settlements, while security-as-a-service has not yet launched.
We believe Ethereum’s strongest value proposition lies in finance; therefore, we project 71% of its revenue will come from financial services (FGP) by 2030. Due to experimentation and the advantages of Ethereum’s open financial and data systems, we expect MASG to grow to 17%, slightly displacing Infrastructure, which will contribute 8%. Overall, AI will account for 2% of Ethereum’s revenue. However, if decentralized AI software realizes its full potential, AI’s revenue contribution could multiply significantly.
From a revenue stream perspective, we estimate individual mainnet transactions will account for only 1.5% of revenue. Layer 2 settlements—bundling transaction batches onto the mainnet—will grow significantly to ~76% of revenue, as we expect most activity to occur on Ethereum’s L2 blockchains, though much of the value will still accrue to Ethereum. Meanwhile, MEV will remain important at 18%, and security-as-a-service will become 4.5% of Ethereum’s revenue.
Bitcoin and Ether: Optimal Portfolio Allocation
Analysis Overview
We conducted a study assessing the impact of including BTC and ETH in a traditional 60/40 portfolio over the period from September 1, 2015, to April 30, 2024. The analysis was structured into five key components:
-
Optimal constrained allocation in a traditional 60/40 portfolio: We evaluated ideal weights for BTC and ETH within a 60% equities / 40% bonds portfolio, capping total crypto allocation at 6%. We analyzed 169 sample portfolios with incremental crypto exposure.
-
Drawdown and Sharpe ratio analysis: We examined drawdowns and Sharpe ratios across a subset of 16 representative portfolios to understand risk-return trade-offs. Adding a modest crypto allocation (up to 6%) significantly improves portfolio Sharpe ratios with relatively small impact on drawdowns. For investors with higher risk tolerance (annualized volatility up to ~20%), allocations up to 20% can further enhance portfolio risk/return. Between BTC and ETH, a roughly 70/30 weighting offers optimal risk-adjusted returns.
-
Optimal BTC and ETH allocation in a pure cryptocurrency portfolio: We tested every possible weight combination of BTC and ETH in a portfolio consisting solely of these two cryptos, aiming to maximize the Sharpe ratio and identify the ideal BTC/ETH weighting.
-
Efficient frontier calculation using optimal crypto portfolio: We studied the optimal BTC/ETH portfolio weights to add to a traditional 60/40 portfolio, maximizing returns at given volatility levels (13%–25%) to illustrate part of the efficient frontier relevant to broad investor portfolios.
-
Time dependency of efficient frontier results: We assessed whether different starting dates affect outcomes by repeating the analysis from Part 4, shifting the start date forward quarter by quarter, ensuring at least three years of returns in each window. This allowed us to generate 23 sets of results and eliminate time dependence as a variable.
1. Optimized Allocation in Traditional 60/40 Portfolio
The primary goal of this section is to determine the optimal BTC and ETH allocation within a traditional 60/40 portfolio, with a maximum total crypto weight of 6%. The analysis involved creating 169 model portfolios with incremental crypto exposure (up to 3% each for BTC and ETH).
Results show that a portfolio with 3% Bitcoin and 3% Ether (alongside 57% S&P 500 and 37% U.S. bonds) delivers the highest risk-adjusted return (per unit of standard deviation). In other words, allowing maximum crypto allocation within a conservative 6% cap achieves the best risk-adjusted performance.
Optimizing BTC/ETH Allocation in a 60/40 Portfolio for Risk-Adjusted Returns (September 1, 2015 – April 30, 2024)
2. Drawdown and Sharpe Ratio Analysis
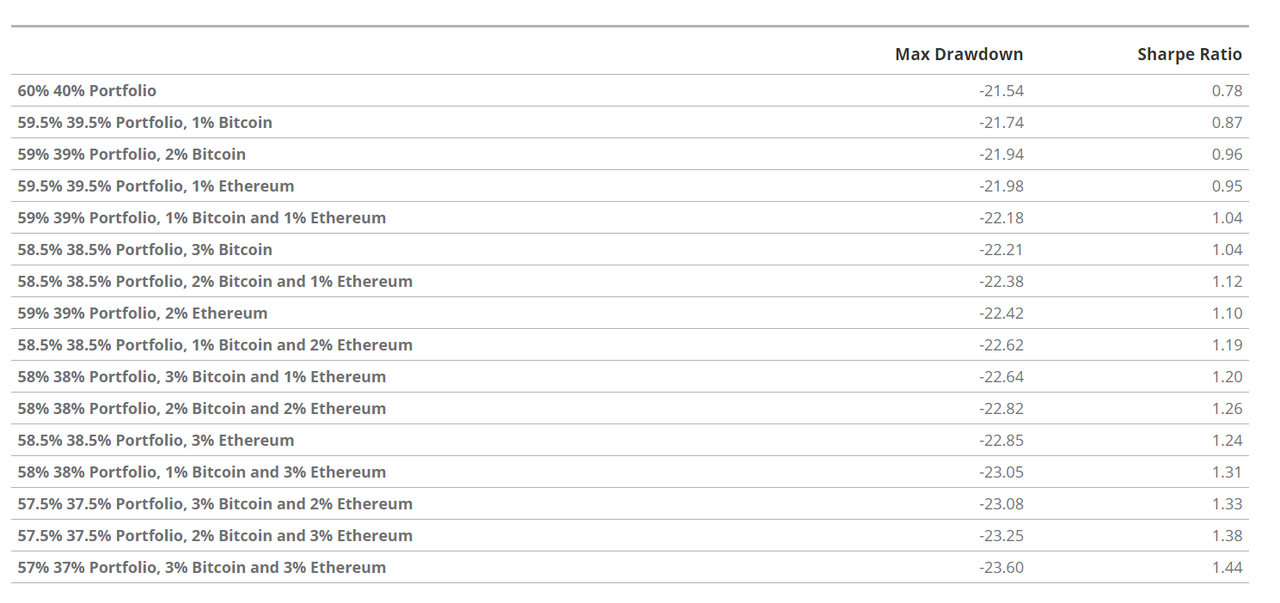
To assess risk-return trade-offs, we analyzed 16 representative 60/40 portfolios with gradually increasing crypto allocations up to 6%. Key findings include:
Sharpe Ratio Improvement: Portfolio Sharpe ratios increase significantly with higher crypto allocations.
Minimal Impact on Drawdowns: Maximum drawdowns increase only slightly, making higher crypto allocations an attractive trade-off for many investors.
Data on maximum drawdowns and Sharpe ratios shows that a 6% crypto allocation nearly doubles the Sharpe ratio compared to a plain 60/40 portfolio, with only a marginal increase in drawdown. This highlights a highly favorable risk-return profile when adding BTC and ETH to traditional portfolios.
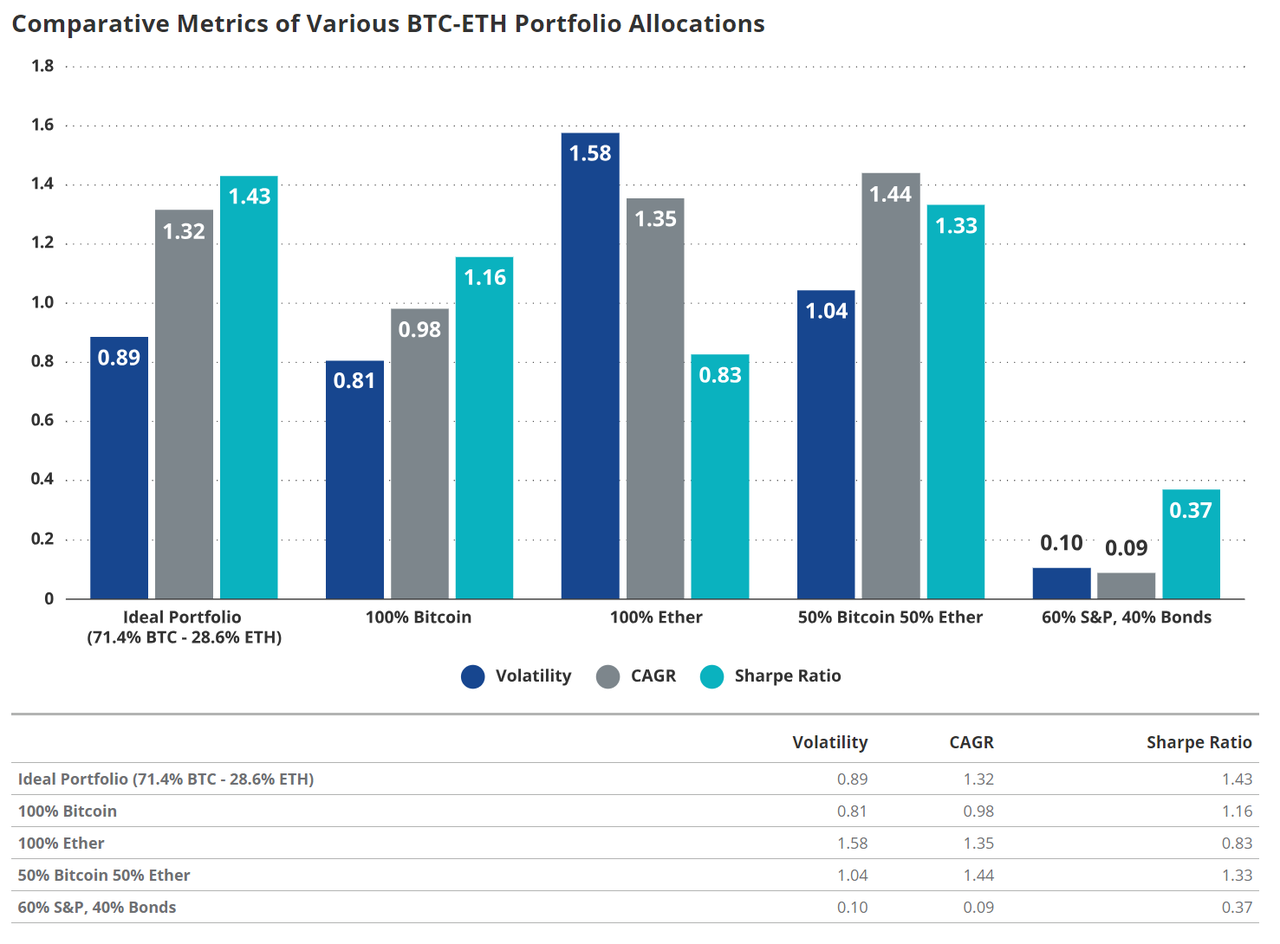
3. Optimal BTC and ETH Allocation in Crypto Portfolio
Focusing exclusively on BTC and ETH portfolios, we tested every possible weight combination to identify the one that maximizes the Sharpe ratio. The analysis reveals that the optimal allocation is 71.4% Bitcoin and 28.6% Ether. This configuration yields the highest Sharpe ratio, indicating optimal risk-adjusted returns for a pure crypto portfolio. The findings underscore the importance of holding both cryptos to maximize benefits. Even a simple 50/50 split shows strong advantages, reinforcing the value of diversification within the crypto asset class.
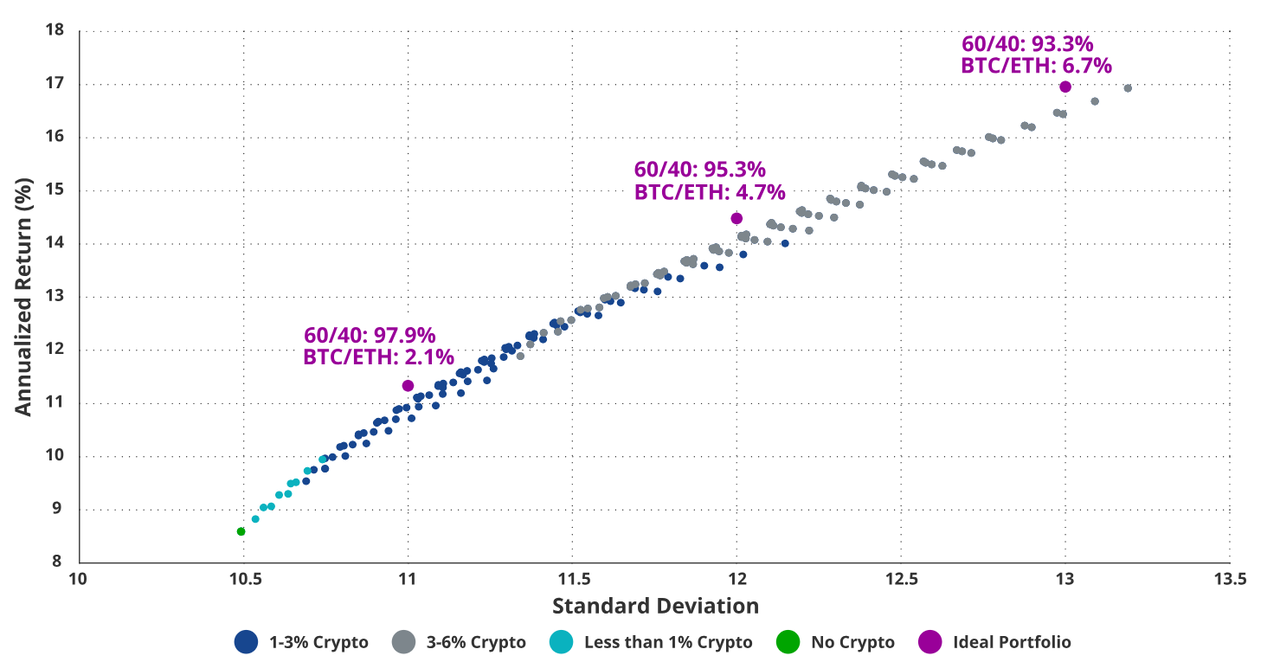
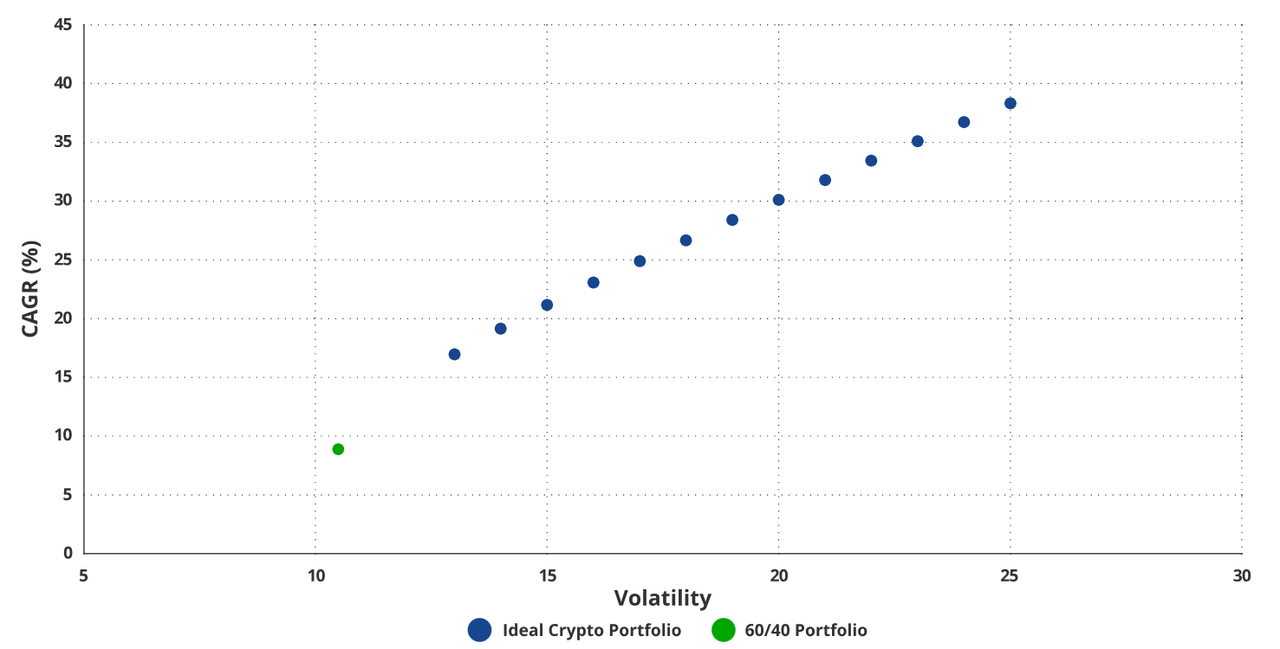
4. Efficient Frontier with Cryptocurrencies
To explore optimal crypto allocation without constraints while maintaining reasonable volatility, we studied the ideal crypto portfolio (28.6% ETH, 71.4% BTC) and determined its optimal weight when added to a traditional 60/40 portfolio. The goal was to maximize returns at given volatility levels (13%–25%), thereby constructing an efficient frontier relevant to typical investor risk profiles. The resulting scatter plot demonstrates that incorporating the optimal crypto portfolio into a traditional 60/40 significantly enhances returns across various risk levels.
Additional Volatility from Digital Assets Enhances Overall Returns
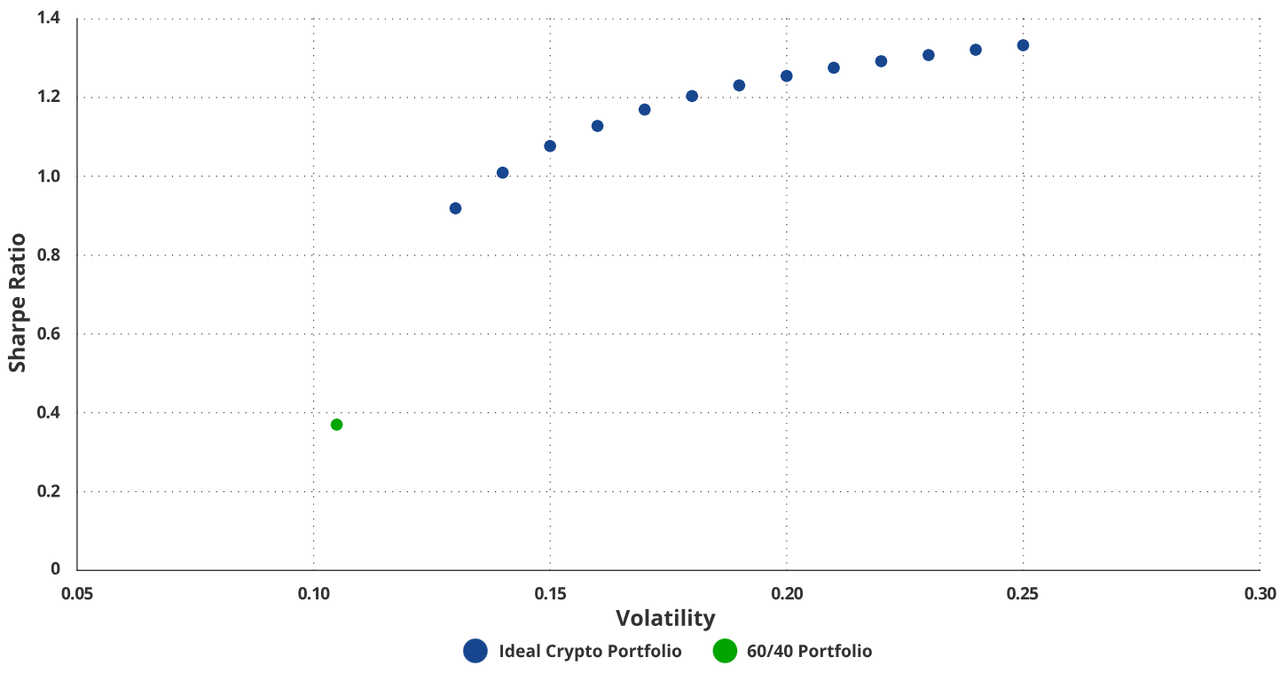
Sharpe Ratio of Hybrid Portfolios Plateaus at 22% Volatility
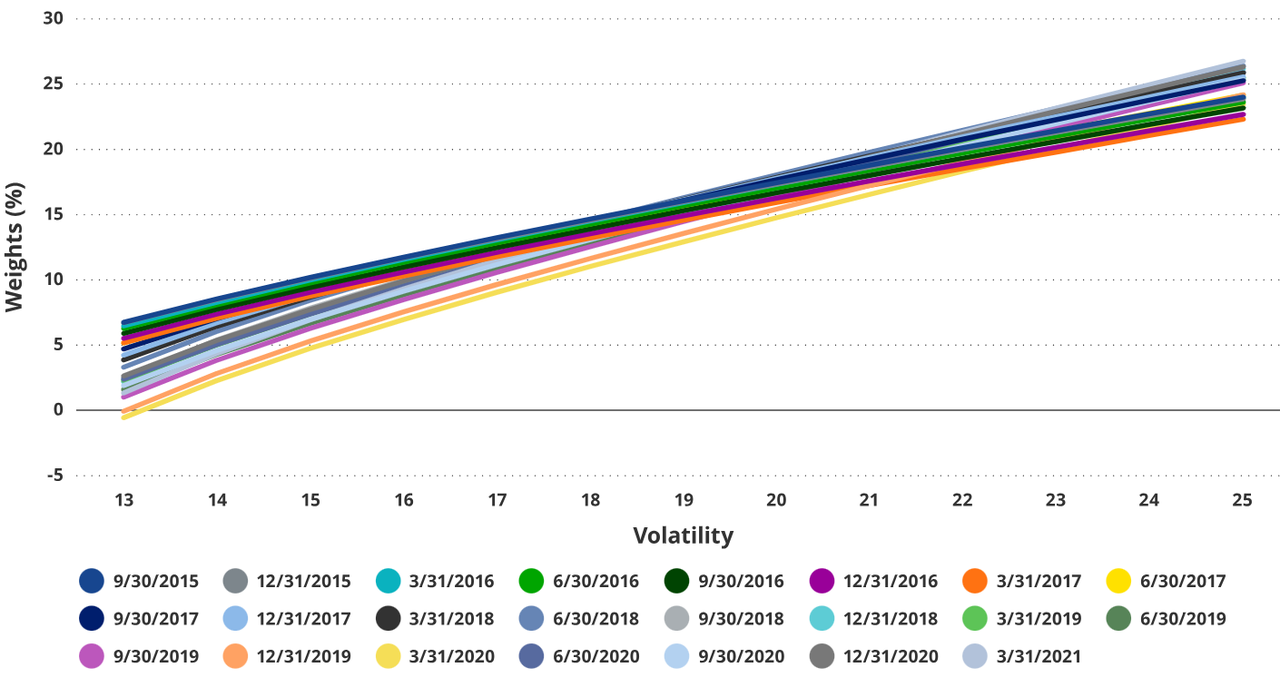
5. Time Dependency of Efficient Frontier Results
To test whether different start dates affect the risk/return profile of the ideal crypto-enhanced 60/40 portfolio, we repeated the analysis from Part 4, advancing the start date by one quarter at a time. Our only constraint was including at least three years of returns. This enabled us to generate 23 distinct result sets, effectively removing time dependence as a factor.
Our findings are:
-
The optimal weight of the ideal crypto portfolio increases with rising risk across all time periods.
Volatility-Based Weights for Time-Independent Portfolios
-
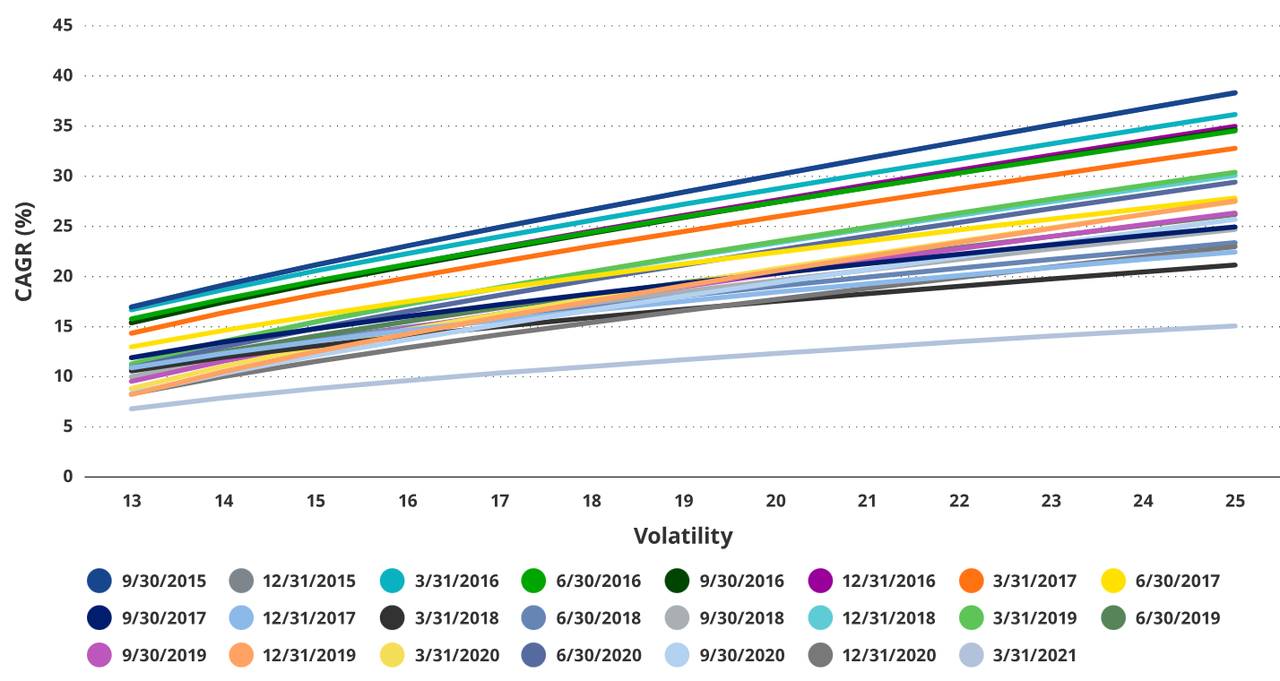
Higher crypto allocations enable higher compound annual growth rates across all periods.
Compound Annual Growth Rate by Volatility for Time-Independent Portfolios
-
Sharpe ratios generally increase with both volatility and crypto allocation.
Sharpe Ratio vs. Volatility for Time-Independent Portfolios
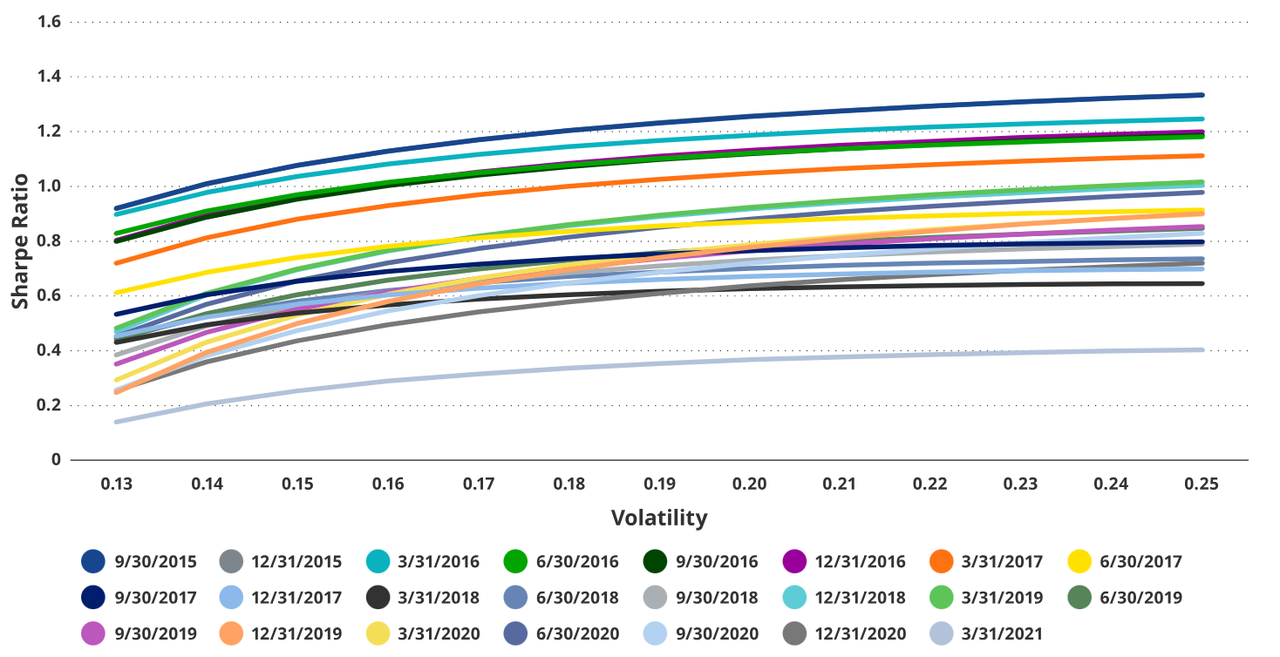
In short, the results from Study 4 are independent of the starting point, supporting the inclusion of a balanced mix of Ethereum (ETH) and Bitcoin (BTC) in portfolios, with total weights up to the 6% cap studied.
Risks of Investing in Ethereum
While ETH has a market capitalization exceeding $400 billion and is considered a mature smart contract platform, it is important to note that investing in ETH carries significant risks.
1. Dependence on Speculation
At this stage, Ethereum’s ecosystem heavily relies on speculation to generate revenue. If overall risk appetite declines, ETH may exhibit significant downside beta relative to the S&P 500 or Nasdaq Composite.
2. Regulatory Risk
Regulatory uncertainty remains a key risk. ETH or many assets within its ecosystem could be classified as securities. This could force numerous Ethereum-based projects to register with the U.S. Securities and Exchange Commission or face severe legal consequences.
Major financial firms employ extensive lobbying efforts globally and often place former employees in top government roles. These individuals may erect regulatory barriers unfavorable to disruptive technologies like Ethereum.
3. Interest Rate Risk
As a high-risk asset, ETH valuations could be significantly impacted by interest rate hikes or other restrictive global liquidity conditions compared to other asset classes.
4. Competition
The field of emerging smart contract platforms is intensely competitive. Despite Ethereum’s substantial lead, high-performance blockchains like Solana and Sui possess technological advantages and focus strongly on business development and user experience, potentially challenging Ethereum’s dominance in the long run.
5. Evolution of Financial Institutions
One of Ethereum’s greatest strengths is reducing financial system costs by eliminating many expensive aspects of the current system. If traditional financial institutions adopt cost-saving measures, they may retain their user base.
Existing financial firms could also launch competing blockchain-based smart contract platforms, limiting Ethereum’s long-term potential.
6. Geopolitical Risk
Control over money is one of the most critical domains of governmental power. Geopolitical events such as major regional wars or heightened tensions could prompt governments worldwide to suppress non-sovereign financial systems and currencies.
Conclusion
In summary, allocating a small portion of cryptocurrencies (up to 6%) to a traditional 60/40 portfolio can significantly improve the portfolio’s Sharpe ratio with relatively minor impact on maximum drawdowns. In a pure cryptocurrency portfolio, a near 70/30 allocation between Bitcoin and Ethereum provides optimal risk-adjusted returns.
Investors should consider their personal risk tolerance, but the data suggests that a balanced inclusion of BTC and ETH can deliver substantial return enhancements relative to the incremental risk introduced. These findings highlight the potential of cryptocurrencies to enhance portfolio performance in a controlled and measurable manner.
Join TechFlow official community to stay tuned
Telegram:https://t.me/TechFlowDaily
X (Twitter):https://x.com/TechFlowPost
X (Twitter) EN:https://x.com/BlockFlow_News