Bitcoin Spot ETF Two Months On: On-Chain Data Reveals BTC Supply and Demand Imbalance
TechFlow Selected TechFlow Selected
Bitcoin Spot ETF Two Months On: On-Chain Data Reveals BTC Supply and Demand Imbalance
This article provides a brief analysis of the BTC market from the perspectives of supply and demand as well as market distribution, leveraging on-chain data from OKLink, CryptoQuant, and Glassnode.
Author: Hedy Bi, OKLink Research Institute

At the beginning of March, the Federal Reserve (FED) released its semiannual monetary policy report. As market expectations for a rate cut in June rose, gold prices reached their highest level of 2024. Just one day later, BTC also hit a new all-time high in market capitalization. The approval of Bitcoin spot ETFs can be seen as a watershed moment. Two months on, financial forces are accelerating the maturation of the crypto market, making it increasingly complex.
However, as an "honest" indicator reflecting real market conditions, on-chain data shows a growing polarization among investors. As OKLink Research Institute previously stated in “One Day Before Approval of Bitcoin Spot ETF Applications: The U.S. Won’t Let Go Easily!”, “a new market is poised to emerge, while the existing market grows more resolute.”
This article combines on-chain data from OKLink, CryptoQuant, and Glassnode to briefly analyze the BTC market from the perspective of BTC supply-demand dynamics and market distribution.
1. Analyzing BTC Supply-Demand Status via On-Chain Data
From the supply side, according to CryptoQuant data at the time of writing, over 30 centralized exchanges are experiencing BTC outflows, with a total amount reaching approximately 71,934 BTC.
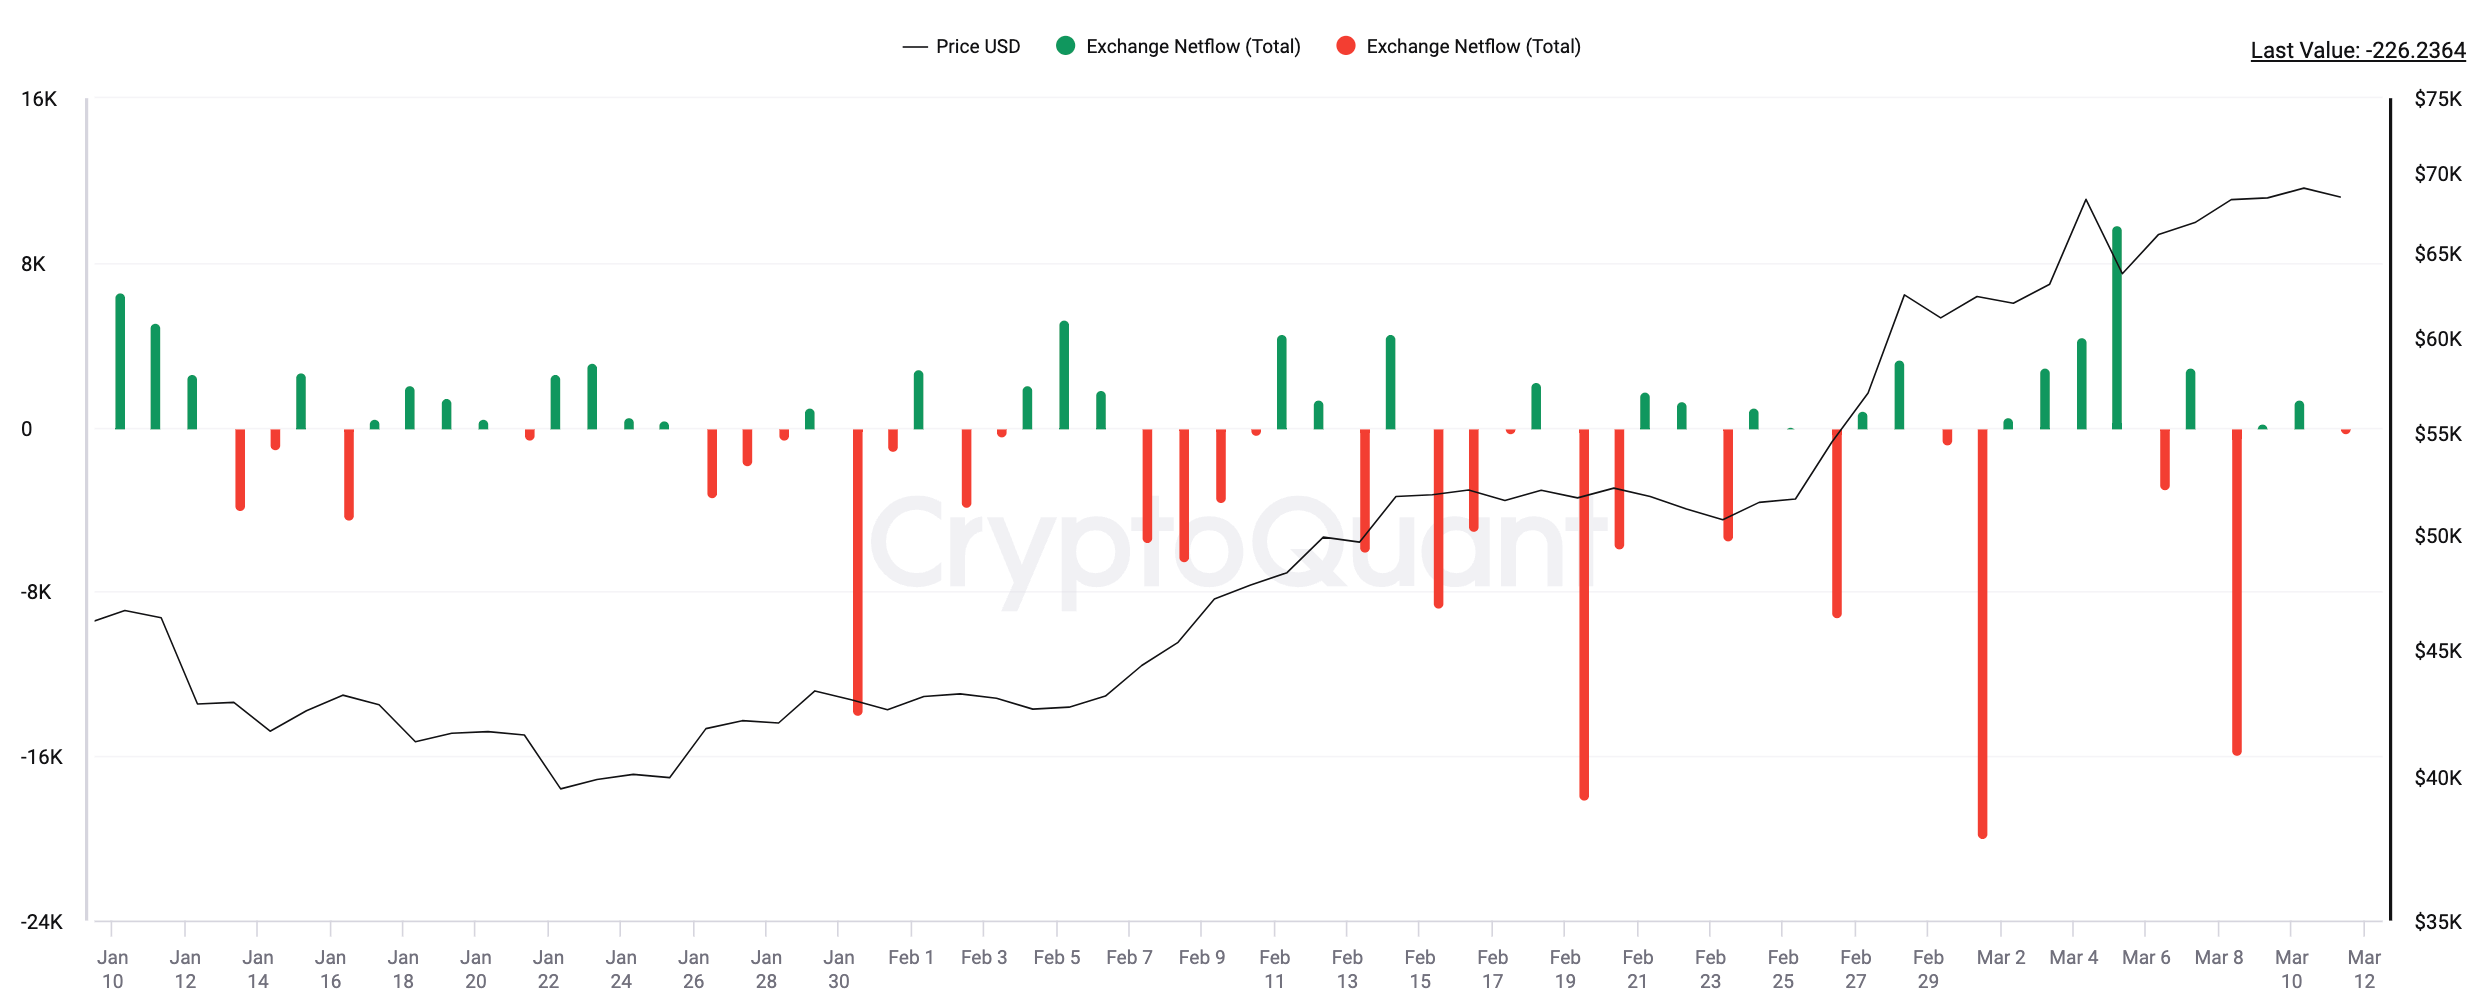
Figure: Net inflow/outflow of BTC from centralized exchanges since January 11, 2024 (data complete through March 10) (Unit: BTC)
Data source: CryptoQuant
Additionally, we observe continuous selling by miners, primarily rushing to liquidate before the next halving event. The upcoming mining reward halving will reduce block rewards from 6.25 BTC to 3.125 BTC. At the time of writing, wallets linked to cryptocurrency miners have seen a net outflow of approximately 8,530 BTC since the ETF approval. This means that the combined reduction in BTC supply from exchanges and miners totals about 80,464 BTC. We use net outflow figures here, which already account for the difference between miners’ actual mining output and their accumulated holdings.
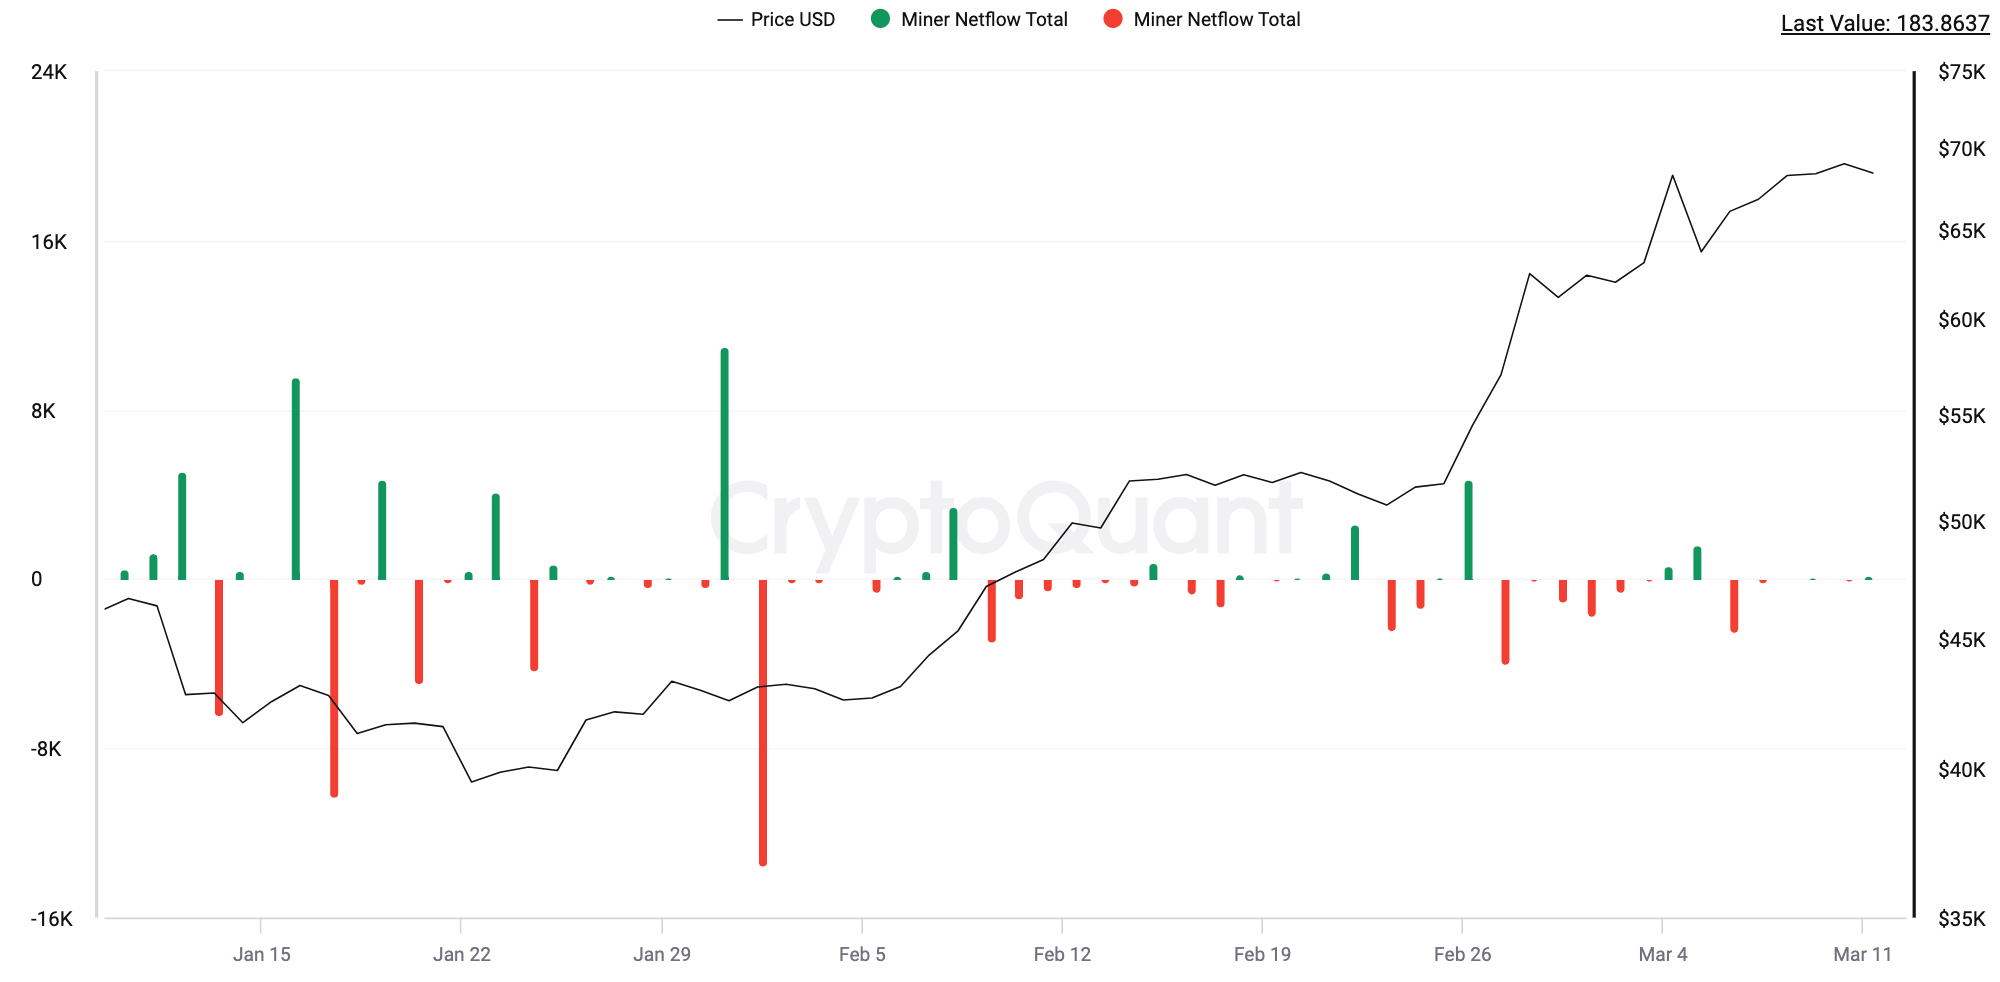
Figure: Net inflow/outflow of BTC from miner wallet addresses since January 11, 2024 (Unit: BTC)
Data source: CryptoQuant
On the demand side, despite ongoing discussions about Grayscale’s continued BTC sell-offs, due to discrepancies across data sources and variations in institutions' ETF reporting timelines, we estimate based on combined data from CryptoQuant and Farside that the cumulative capital inflow into the market via Bitcoin spot ETFs has reached $9.594 billion. Compared to when trading was first permitted, the net inflow volume reached approximately 176,396 BTC by the close of March 8. Just through the Bitcoin spot ETF channel alone, BTC has entered a state of supply shortage, creating a current deficit of over 95,000 BTC. However, the true source of BTC supply lies with miners. While other channels such as exchange outflows contribute, they are not sustainable long-term supply sources.
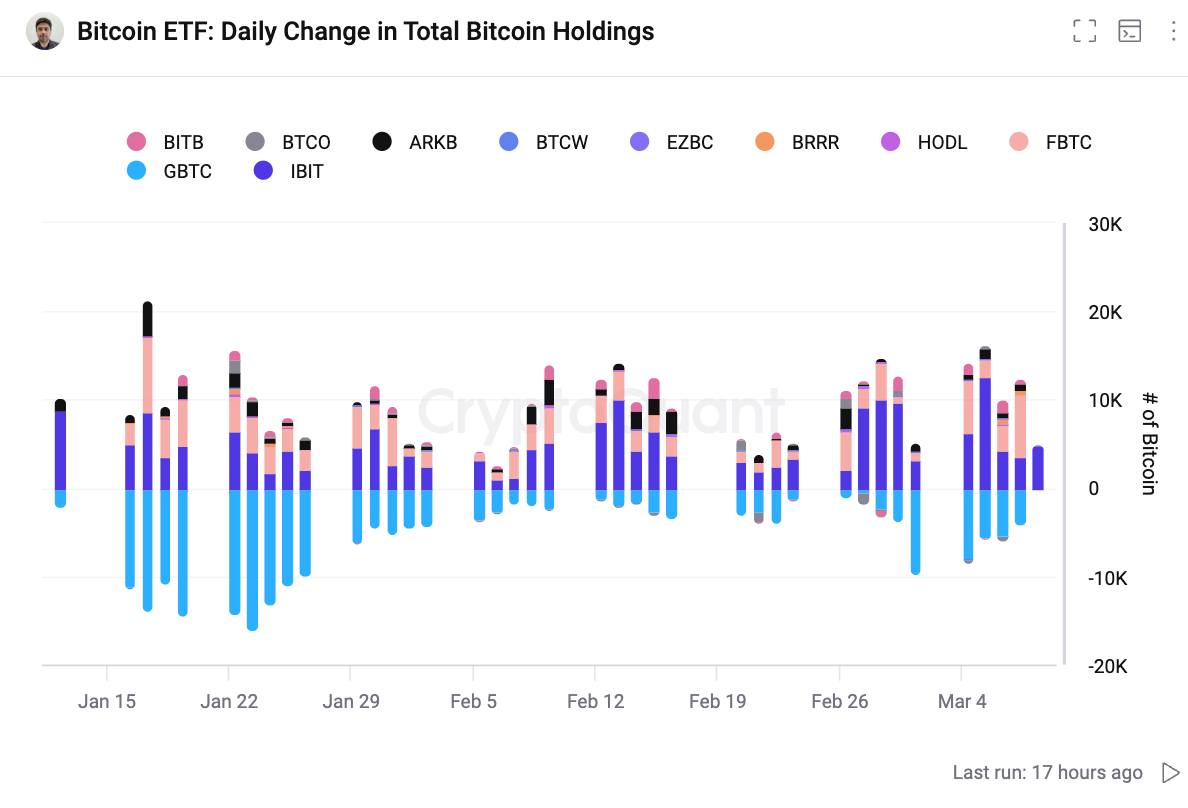
Figure: Net inflow/outflow of Bitcoin Spot ETFs since January 11, 2024 (Unit: BTC)
Data source: CryptoQuant
In about 44 days, the BTC halving will cut newly generated supply in half. According to BTC’s design, the block reward halves every 210,000 blocks until 2140, when block rewards reach zero and the full issuance of 21 million BTC is completed.
Moreover, this halving differs from previous ones due to an innovative development within the BTC ecosystem—inscriptions. According to Dune’s on-chain data, fees generated from this innovation have reached 6,290 BTC, contributing significantly to miner revenues. In the future, as innovative applications on BTC and Layer 2 solutions for scalability develop further, miner income will increase, reducing the pressure on miners to sell BTC to cover mining costs. This implies that supply-side dynamics differ from prior halvings: reduced selling pressure allows miners to hold rather than supply BTC to the market.
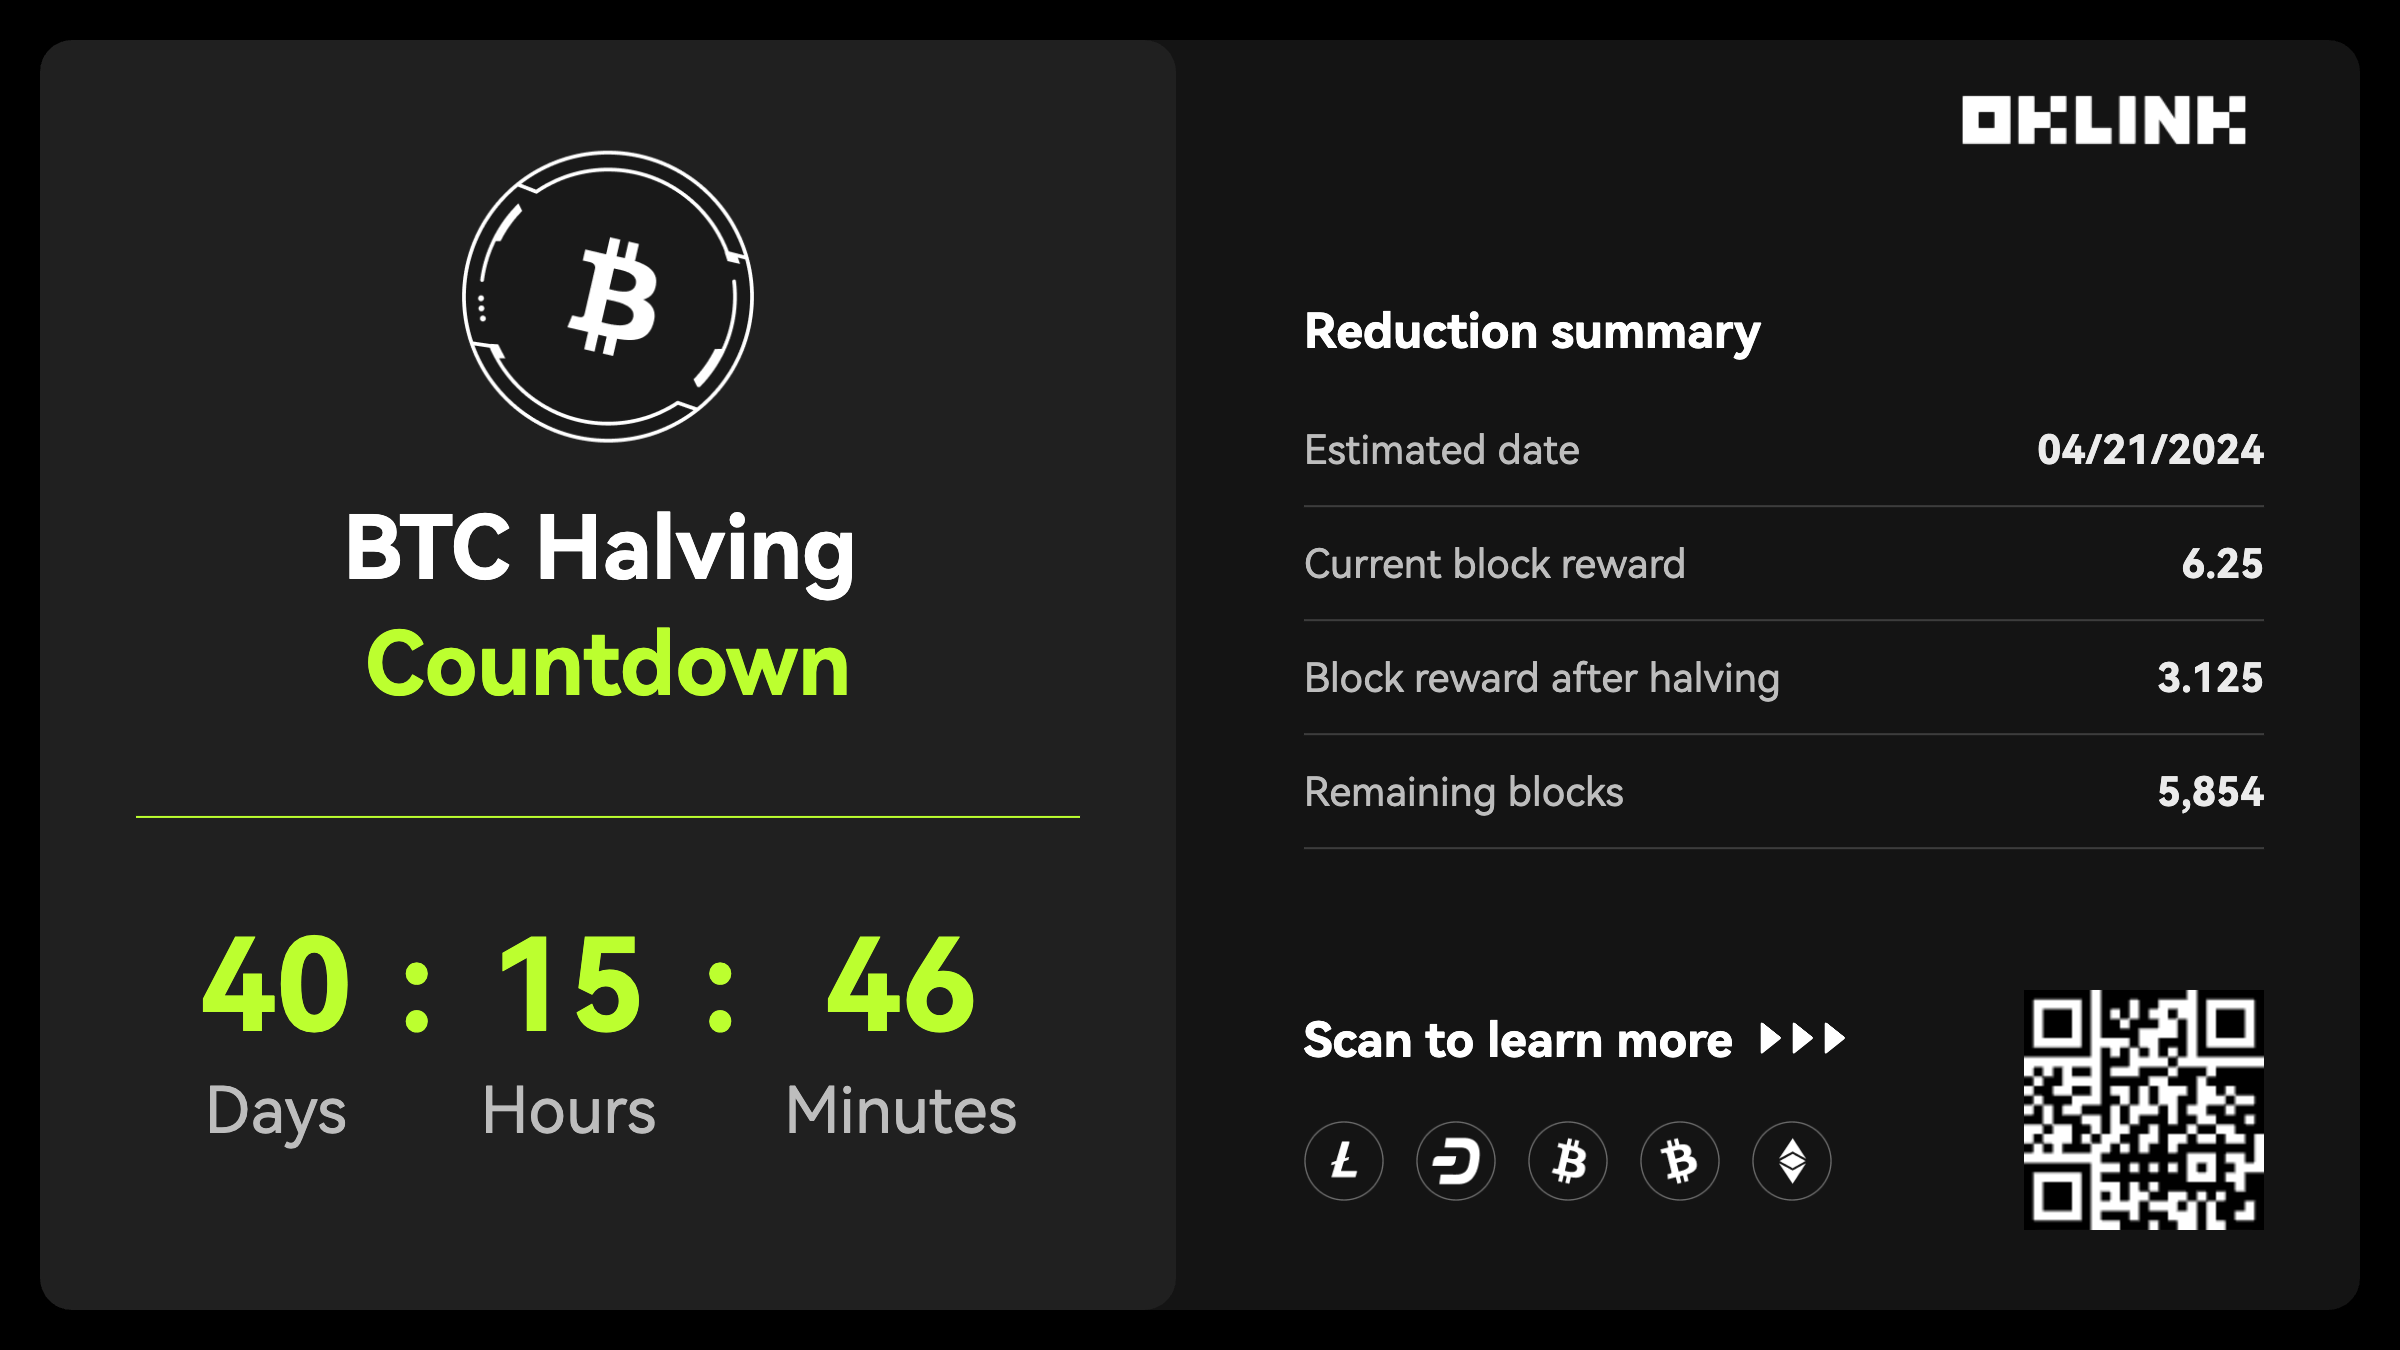
Figure: BTC Halving Overview as of noon, March 11
Data source:OKLink
2. BTC Market Distribution: Shifting On-Chain
If we assume most new investors are entering the market via Bitcoin spot ETFs, then non-zero on-chain addresses likely represent mostly existing investors. According to OKLink data, the number of non-zero addresses shows a clear upward trend, indicating increasing numbers of asset-holding addresses—not merely addresses created for interaction purposes—revealing signs of BTC movement.
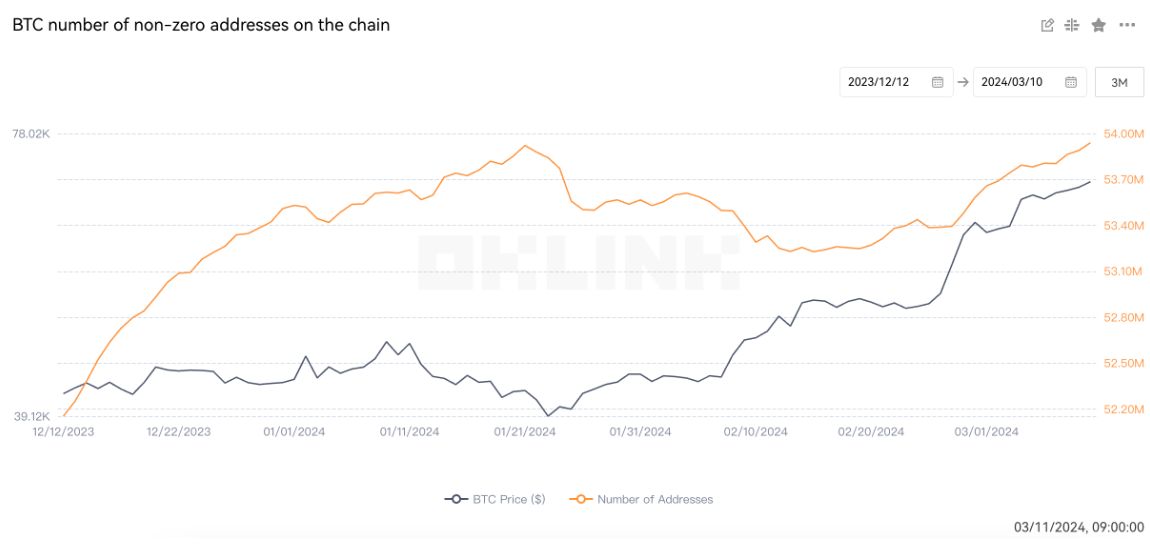
Figure: Number of wallets holding non-zero BTC assets over the past three months
Data source: OKLink
More detailed and specific asset movements can be viewed in real time on blockchain explorers, including large-value transfers. OKLink data shows that the frequency of large BTC transfers has increased in recent days.

Figure: Large-value asset transfers on the BTC blockchain explorer
Data source: OKLink
According to Glassnode, the amount of BTC transferred into long-term storage is increasing at a rate of 180,000 BTC per quarter—twice the amount of newly mined BTC. This shift toward viewing BTC as a long-term investment further tightens supply and could strengthen BTC’s price foundation as the halving approaches.
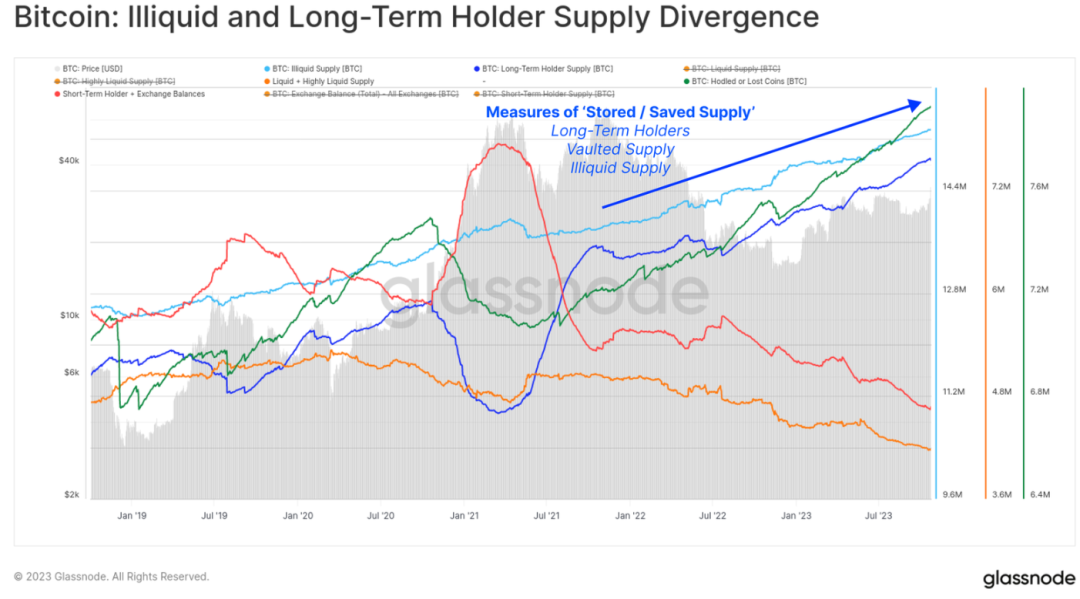
Figure: Divergence between illiquid supply and long-term holder supply
Data source: Glassnode
Long-term holders moving BTC on-chain show expansion trends in both address count and capital volume. According to a recent Glassnode report, the lock-up rate of BTC used for long-term investment has exceeded 200% of new supply. This indicates that even as new BTC continues to be mined, more BTC is being held by investors rather than sold or traded.
3. Versus Gold ETFs? Scarcity Remains Key
Beyond on-chain data showing BTC currently in a supply-constrained state, BTC’s scarcity reinforces this trend. Unlike fiat money whose supply depends on central banks, or precious metals like gold constrained by natural availability, BTC’s issuance rate and fixed cap of 21 million coins have been defined by its protocol since inception.
When discussing scarcity, gold inevitably comes to mind. Often compared to BTC, gold is considered a “supply-constrained” asset due to its high extraction costs and limited natural reserves. Especially during inflation or geopolitical turmoil, its scarcity becomes more pronounced, making it a classic example of a “fear trade.” Thus, gold’s historical market performance is frequently used to benchmark BTC market analysis.
Regarding ETF performance, since the first gold spot ETF was approved in 2004, gold prices have steadily risen, achieving a 346% gain within less than a decade. However, gold took a considerable time to achieve broad recognition. In contrast, BTC achieved spot ETF approval just 15 years after its creation. Despite rising market enthusiasm, we must acknowledge gold’s significant historical status in finance. In 1717, Britain adopted the gold standard, integrating gold into its monetary system as a core component.
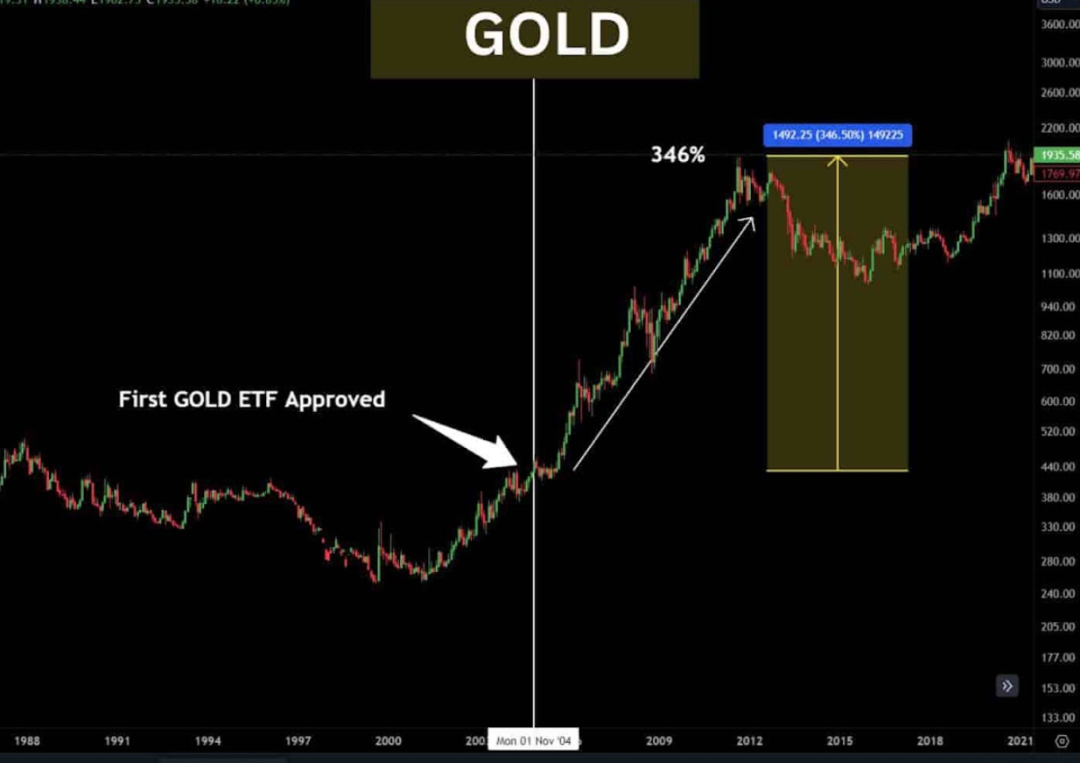
Figure: Comparison of gold prices before and after the launch of spot ETFs
Data source: Ash Crypto
When exploring BTC’s uniqueness as “digital gold,” beyond its material scarcity, its distinct role in financial systems deserves attention. BTC’s decentralized design enables ownership outside traditional financial systems and provides billions of unbanked individuals access to global finance.
As the BTC market evolves, its decentralized nature fosters diverse participation and deepens integration with traditional financial markets. There is a close relationship between market complexity and data accessibility. In this context, obtaining and analyzing on-chain data is far more convenient than accessing information in traditional financial markets. On-chain data originates from a global network of nodes and features a public ledger, enabling anyone to conduct real-time market analysis and statistics without relying on centralized institutions. This decentralization ensures data transparency, fairness, and resistance to single points of failure or tampering.
In an increasingly mature and complex crypto market, the availability of on-chain data analysis offers a significant advantage over traditional financial data. The more complex the market, the more prominent the advantages of on-chain data. Due to its unique characteristics, on-chain data will remain our closest window to market truth.
Further Reading:
One Day Before Approval of Bitcoin Spot ETF Applications: The U.S. Won’t Let Go Easily!
A Decade in the Making: Reflections After the U.S. Approves Bitcoin Spot ETFs
Learning from the U.S.: Exploring the Future Development of Hong Kong's Bitcoin Spot ETFs
Join TechFlow official community to stay tuned
Telegram:https://t.me/TechFlowDaily
X (Twitter):https://x.com/TechFlowPost
X (Twitter) EN:https://x.com/BlockFlow_News