Primary and Secondary Markets for Stablecoins
TechFlow Selected TechFlow Selected
Primary and Secondary Markets for Stablecoins
There are significant differences in the primary market for stablecoins during normal times versus crisis periods.
Authors: Cy Watsky, Jeffrey Allen, Hamzah Daud, Jochen Demuth, Daniel Little, Megan Rodden, Amber Seira
Translation: Block unicorn
Introduction
Stablecoins have become increasingly important in decentralized finance (DeFi) and the broader cryptocurrency market, leading to greater scrutiny of their unique role as dollar-denominated instruments operating on blockchain networks. Stablecoins attempt a mechanically complex function—maintaining a peg to the U.S. dollar even during periods of market volatility. However, in recent years, certain stablecoins have deviated from their dollar peg during times of stress. While each successive market event has revealed new and distinct risks associated with different stablecoin designs, many analyses continue to question the inherent stability (or instability) of various stablecoin architectures.
The events of March 2023 illustrate these shifts and challenges. On March 10, 2023, Circle, the issuer of the stablecoin USD Coin (USDC), announced it was unable to withdraw a portion of USDC reserves held at Silicon Valley Bank prior to regulatory seizure. The price of USDC decoupled significantly from the dollar, and as markets reacted to this news, other stablecoin markets also experienced significant volatility. The confluence of multiple factors makes the March events particularly compelling for researchers seeking to understand the complexities of the stablecoin market. This paper analyzes many of these factors, focusing on distinguishing between primary market and secondary market dynamics during stablecoin crises.
We begin by outlining how stablecoins are collateralized, issued in the primary market, and traded in the secondary market. We then turn to a case study of the March 2023 stablecoin market events, which shook the cryptocurrency market. We examine four stablecoins of interest, focusing on their differing technical designs, and detail the dynamics of primary issuance and secondary market trading. From this analysis, we derive several general insights into the nature of the stablecoin market during periods of stress.
Background
Stablecoins are a class of crypto assets designed to maintain a stable value relative to non-crypto reference assets. For the purposes of this note, we focus on U.S. dollar-pegged stablecoins—the vast majority of stablecoins traded in cryptocurrency markets. Unlike volatile crypto assets, which are often purchased purely for speculation, stablecoins can serve as (ideally) stable stores of value and mediums of exchange. The surge in stablecoins has led to widespread use across DeFi markets and services, facilitating trading on cryptocurrency exchanges and serving as an entry point into the crypto economy.
Stablecoin Design
Based on collateralization and issuance mechanisms, stablecoins are typically categorized into three types: fiat-backed, crypto-collateralized, and algorithmic (or uncollateralized) stablecoins. The way a stablecoin maintains its stable value affects its utility as a medium of exchange or store of value, as well as the degree of centralization (or decentralization) inherent in the product.
Fiat-backed stablecoins are supported by reserves of cash and cash equivalents such as deposits, Treasury bills, and commercial paper. Most fiat-backed stablecoins are centralized, meaning a single entity issues tokens on a public blockchain in a 1:1 ratio with fiat currency held off-chain. At a high level, the stablecoin issuer is responsible for ensuring that the number of tokens issued on-chain does not exceed the dollar value of fiat reserves held “off-chain.”
Crypto-collateralized stablecoins are backed by a basket of crypto assets—such as other stablecoins or cryptocurrencies like Bitcoin or Ether—so that each issued stablecoin holds at least one dollar’s worth of crypto assets as collateral. These are inherently more decentralized, with token issuance managed by self-executing smart contracts. Users deposit a certain amount of crypto assets, and in return, smart contracts mint a corresponding amount of stablecoin tokens at an over-collateralization ratio. If the value of the collateral falls below a certain threshold, a series of smart contract-enforced processes liquidate the collateral and remove excess stablecoins from circulation.
In many ways, algorithmic stablecoins are the most difficult category to define. They are often designed without collateral or with minimal backing, instead using smart contracts and various incentive structures to adjust the stablecoin’s supply in response to demand and thereby maintain the peg. Terra, the largest algorithmic stablecoin before its collapse in May 2022, represented a model where the stablecoin was “backed” by a crypto asset whose supply fluctuated directly with changes in stablecoin demand. As stablecoins exited circulation, the supply of the supporting crypto asset increased, lowering its price; conversely, new stablecoins were minted when demand rose. In this way, the crypto asset backing the algorithmic stablecoin is endogenous to the same system, unlike crypto-collateralized stablecoins, which are theoretically backed by unrelated external crypto assets. This design led to rapid and dramatic “death spirals” for several algorithmic stablecoins.
Stablecoins: Primary Market vs. Secondary Market
A stablecoin’s issuance and collateral design are the mechanisms through which issuers aim to assure consumers that each coin is worth one dollar by adjusting collateral or supply as needed. However, it is the secondary market that actually prices the asset and contributes to maintaining the dollar peg.
Fiat-backed stablecoin issuers typically only mint and redeem new stablecoins with institutional clients, meaning retail traders rely on secondary markets to acquire them. Therefore, not all stablecoin traders have access to the primary issuance mechanism, and those without access can only contribute to the peg via secondary market activity. In contrast, other stablecoins may have broader primary market participation. For example, DAI, a crypto-collateralized stablecoin issued via decentralized smart contracts, allows any Ethereum user to deposit collateral tokens in exchange for stablecoins.
The peg is also maintained through extensive trading on secondary markets such as DeFi platforms and centralized exchanges. Direct customers of stablecoin issuers can engage in arbitrage trades, profiting from discrepancies between primary market rates and secondary market prices, thus helping maintain the peg. Decentralized exchanges and liquidity pools provide additional arbitrage opportunities, such as stablecoin-specific automated market makers.
Market observers typically do not assess whether a stablecoin maintains its peg based on primary market activity, since issuers are unlikely to commit to redeeming stablecoins below one dollar. Instead, aggregated prices across exchanges are often the preferred source of pricing data, although market inefficiencies can make accurate valuation of stablecoins and other crypto assets challenging.
The economic literature behind stablecoin issuance and crypto markets is still grappling with fundamental questions, but emerging research offers insights into stablecoin stability and their role in crypto markets. Baur and Hoang (2021) and Grobys et al. (2021) provide evidence of stablecoins acting as hedges against Bitcoin volatility and argue that, as a result, stablecoin prices are not always perfectly stable due to spillovers from other crypto market fluctuations. Gorton et al. (2022) highlight the utility of stablecoins in providing leverage to traders in crypto markets and explain their ability to maintain stability. Several papers analyze the impact of new stablecoin issuance on other crypto markets, with evidence suggesting linkages between the primary market for stablecoins and secondary markets for both stablecoins and other crypto assets. Ante, Fiedler, and Strehle (2021) argue that on-chain issuance of new stablecoins correlates with abnormal returns in other crypto assets, while Saggu (2022) finds investor sentiment toward public announcements of new Tether minting events positively influences Bitcoin prices.
Perhaps most informative for our analysis is Lyons and Viswanath-Natraj (2023), who explore flows between the primary and secondary markets for stablecoins, arguing that “access to the primary market is crucial for the efficiency of arbitrage mechanisms” (p. 8). The authors find that changes in Tether’s design in 2019 and 2020, which expanded access to its primary market, reduced peg instability. Inspired by their approach, we consider the importance of the relationship between a stablecoin’s primary market and secondary market price deviations, adopting some of their methods. We extend this analytical framework to periods of market stress, highlighting mechanical differences among the primary markets of four stablecoins and activity in both decentralized and centralized secondary markets.
Case Study: The March 2023 Stablecoin Run
On March 10, 2023, Circle, the issuer of the stablecoin USD Coin (USDC), announced it could not withdraw $3.3 billion of USDC reserves (out of approximately $40 billion) held at Silicon Valley Bank prior to regulatory takeover. The price of USDC decoupled from the dollar in secondary markets, and as traders reacted to the news, other stablecoin markets also experienced significant volatility. In our case study, we examine the four largest stablecoins at the time: USDC, Tether (USDT), Binance USD (BUSD), and DAI.
Our analysis tracks activity across primary markets, decentralized secondary markets, and centralized secondary markets during the market turmoil, aiming to distinguish differences among stablecoins and reveal what can be observed from on-chain and off-chain data.
Technical Details: USDC, USDT, BUSD, DAI
USDC is a fiat-backed stablecoin issued by Circle. Like many fiat-backed stablecoins, only Circle’s direct clients—typically crypto exchanges, fintech firms, and institutional traders who go through an application and clearing process—have access to the USDC primary market. Most retail investors purchase stablecoins through intermediaries and trade them on secondary markets such as centralized and decentralized exchanges.
On March 11, Circle announced that “the issuance and redemption of USDC are subject to U.S. banking system business hours,” and that such “USDC liquidity operations will resume when banks reopen on Monday morning.” This statement implied restrictions on primary market operations, and subsequent updates suggested growing redemption backlogs. Our analysis examines visible on-chain activity in the USDC primary market, though we cannot infer the extent of off-chain backlogs. Exchanges that typically offer one-to-one trading between USDC and other stablecoins or between USDC and dollars subsequently suspended such trading, further cutting off exit routes for secondary market participants wishing to sell USDC.
BUSD is a fiat-backed stablecoin issued by Paxos. While its mechanical operation is similar to other fiat-backed stablecoins described here, it differs in several key aspects. First, regulators halted new issuance of BUSD in February 2023, meaning that during our analysis period, the BUSD primary market could only destroy tokens and reduce supply. Second, while BUSD is issued only on Ethereum, holdings are highly concentrated in wallets associated with Binance—over 85% of BUSD on Ethereum. Approximately one-third of BUSD is locked in Binance’s Ethereum wallet, representing tokens issued on the Binance Smart Chain (another blockchain). As a result, BUSD plays a much smaller role in decentralized markets based on Ethereum.
USDT is the largest stablecoin by market capitalization and is also fiat-backed, with its primary market restricted to a set of approved clients, typically corporate rather than retail traders. The USDT primary market is far more restrictive than that of USDC, reportedly requiring minimum minting amounts of $100,000 per on-chain transaction (Ehrlich and Bambysheva 2022). We will examine Tether’s primary market activity in more depth later. Notably, while USDC faced restrictions in both primary and secondary markets and BUSD issuance was halted by regulators, USDT did not face unusual technical constraints during the case study period.
Dai is a crypto-collateralized stablecoin, with issuance governed by a decentralized autonomous organization (DAO) called MakerDAO and implemented via smart contracts. Dai is issued exclusively on Ethereum, and any Ethereum user can access the smart contracts that issue tokens. These contracts vary by collateral type and mechanisms used to maintain collateral levels. For example, users can open a Maker Vault, deposit Ether (ETH) or other acceptable volatile crypto assets, and generate Dai at an over-collateralization ratio—for instance, $150 worth of ETH for $100 worth of Dai. Alternatively, the Dai Peg Stability Module allows users to deposit another stablecoin, such as USDC, in exchange for an equal amount of Dai. Thus, Dai is unique among the stablecoins we study in that its primary market is accessible to any Ethereum user with DeFi access, and it features multiple, mechanistically distinct primary issuance channels. The nature of the self-executing mechanisms controlling supply makes its primary market theoretically more active than others. Moreover, the fact that part of Dai’s collateral consists of USDC directly links the Dai market to changes in the USDC market.
Table 1 presents descriptive statistics for each stablecoin. Notably, USDC’s market cap decreased by approximately $10 billion during March 2023, while USDT’s increased by about $9 billion. Although DAI’s supply fluctuated throughout the month, its market cap changed little overall. BUSD’s market cap declined by over $2 billion. Additionally, USDT stands out in that, as of March 1, 2023, only 45% of its supply was issued on Ethereum, with the majority of non-Ethereum USDT issued on Tron.
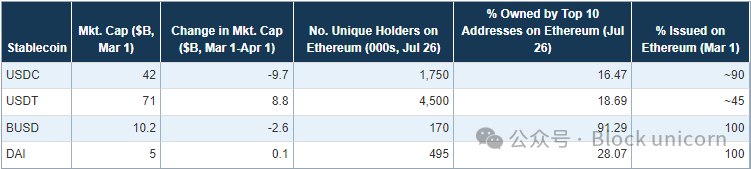
Table 1. Descriptive Statistics of Stablecoins (2023)
Secondary Market Trading Activity
Secondary markets for stablecoins provide the default source of pricing data for market observers. Figure 1 shows significant divergences in the prices of these four stablecoins in the days following the SVB collapse. USDC and DAI decoupled in strikingly similar patterns, falling below 90 cents and recovering at a similar pace over three days. Given that a stablecoin’s primary responsibility is to maintain its dollar peg, one might assume that similar price declines indicate comparable overall market conditions for both assets. However, as shown in Table 1, DAI’s market cap increased after the March events, while USDC’s shrank by nearly $10 billion. Conversely, while both BUSD and USDT traded at a premium, BUSD’s market cap contracted while USDT’s grew by $9 billion. Thus, pricing data alone fails to capture the full picture of market dynamics during the March events.
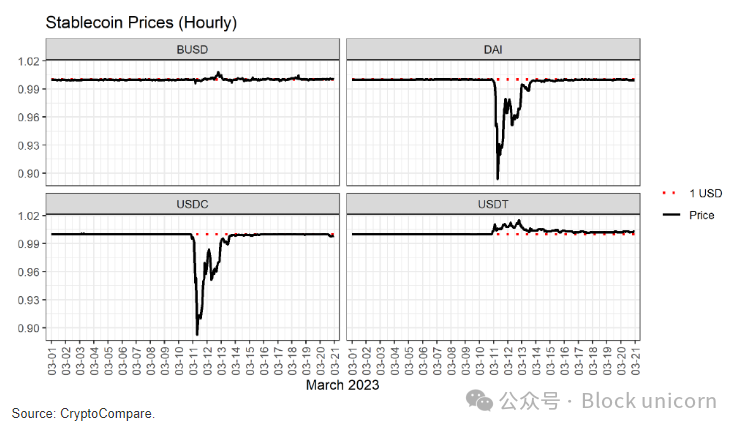
Figure 1. Hourly Stablecoin Prices on Secondary Markets (CryptoCompare)
Centralized exchanges (CEXs) remain the most popular venue for retail traders to trade crypto assets on secondary markets, but decentralized exchanges (DEXs) have grown increasingly popular over the past few years. At a high level, DEXs aim to perform similar functions for users: they act as markets for crypto asset trading. However, they differ in several key respects:
-
CEXs can serve as on- and off-ramps for fiat currencies. Users can trade fiat to buy cryptocurrencies and vice versa. In contrast, users cannot buy or sell stablecoins with fiat on DEXs. This limitation reinforces stablecoins’ dominance on decentralized exchanges as the sole dollar-like alternative to fiat in trading pairs.
-
CEXs operate using traditional market makers and limit order books, whereas DEXs use automated market makers, which may behave differently despite attempting broadly similar market-making functions.
-
Users must log into centralized systems to access CEXs, often sharing identifying information to comply with local "Know Your Customer" regulations. In contrast, DEXs run on permissionless smart contracts, making them theoretically more open. However, CEXs may resemble more traditional, intuitive systems for less experienced crypto traders, while DEXs require familiarity with DeFi applications.
These differences between exchange types may have contributed to divergent CEX and DEX activity during the March events. Figure 2 shows that both types of exchanges experienced surges in trading volume during the March events, but to different degrees. While DEX volume spiked to an all-time high exceeding $20 billion on March 11, CEX volume reached highs during the first half of 2023—ranging from $1 billion to $3 billion—but did not reach historically unprecedented levels. Moreover, the DEX volume peak preceded the rise in CEX volume and declined before CEX volume peaked. Nevertheless, these volume differences did not lead to significant pricing gaps between centralized and decentralized markets. Further investigation into the differences between CEXs and DEXs during stress periods would help clarify their respective roles in facilitating activity during stablecoin runs and the impact of mechanical differences between automated market makers and limit order books.
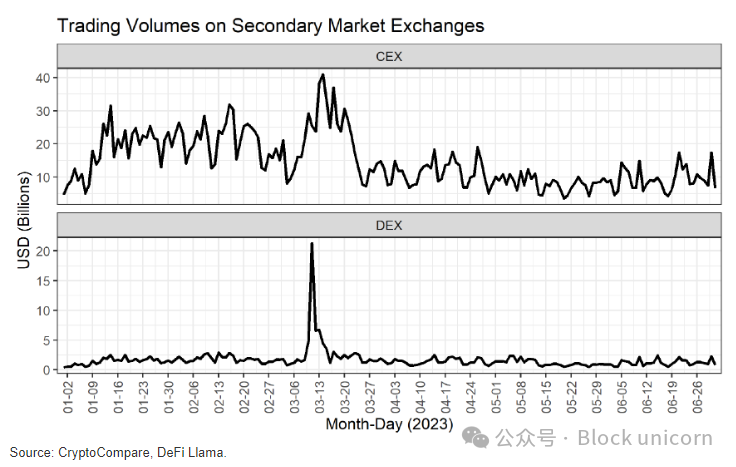
Figure 2. Daily Secondary Market Trading Volume in H1 2023
Increased secondary market activity ultimately transmits pressure to the stablecoin primary markets, as excessive selling pressure on de-pegged stablecoins and excessive demand for premium-trading stablecoins should theoretically trigger issuance or redemption in the primary market. We examine the data in the next section.
Primary Market
The public availability of data stored on the Ethereum blockchain allows us to directly observe the creation and destruction of stablecoins. Part of our rationale for conducting this analysis is to demonstrate what researchers can infer about stablecoin primary markets from blockchain data. We present this data in multiple ways but do not assert that any single method is paramount for understanding the nature of stablecoin primary markets. Descriptive analysis of on-chain issuance provides insightful complementarity to more widely cited secondary market data. We hope future research will challenge the theoretical foundations of the relationship between stablecoin primary and secondary markets.
We use Amazon Web Services’ public blockchain data to access on-chain data tracking changes in stablecoin supply on Ethereum. We track two sets of figures: the “minting” and “burning” of tokens on-chain, and inflows and outflows from treasury wallets associated with each fiat-backed stablecoin issuer. Token minting and burning simply describe increases or decreases in the total supply of tokens on Ethereum. Following Lyons and Viswanath-Natraj (2023), we measure “net flow” from the primary to the secondary market. Each of BUSD, USDT, and USDC has a treasury wallet holding newly minted tokens that have not yet been distributed to other parties. By subtracting net transfers into the treasury wallet from the net amount of tokens minted on-chain, we can track the net inflow of new funds from the primary to the secondary market. Since DAI is issued directly to holders via smart contracts, there is no treasury wallet mediating DAI’s initial on-chain distribution.
As context, Table 2 provides summary statistics comparing the primary markets of each stablecoin in 2022—well before the relevant event window. The table records the number and averages of mints, burns, and treasury wallet transactions over the year. Clear differences emerge in terms of frequency of primary market activity and average transaction size. In terms of transaction count and unique primary market participants, DAI and USDC exhibit far more active primary markets than BUSD and USDT. Additionally, on average, BUSD and USDT primary market transactions are larger in size than those of DAI and USDC. Clearly, tokens perceived as structurally and functionally similar (e.g., USDC and USDT) can have very different underlying primary market dynamics.
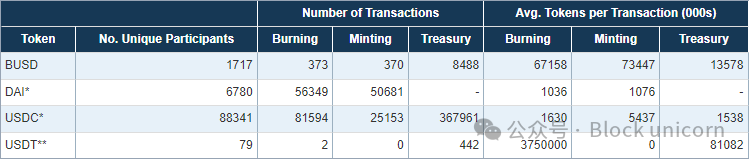
Table 2. Primary Market Activity for Ethereum-Based Stablecoins in 2022
As noted earlier, while on-chain activity for Dai, USDC, and BUSD is predominantly on Ethereum, most USDT tokens are issued on Tron. Data from the Tron blockchain accessed via Tronscan indicates that Tron’s primary market does not differ significantly from Ethereum’s, and the dynamics observed on Ethereum are not artifacts of missing Tron activity in our analysis.
Turning to primary market activity during the de-pegging event, Figure 3 plots the total number of tokens minted and burned for DAI and USDC across three comparable windows. March 10–15 marks the period between Circle’s announcement of the SVB fund freeze and its announcement of a “material clearing” of all accumulated redemption backlog. These dates roughly align with the period of abnormally high crypto market activity following the SVB collapse. Two equally long pre-de-peg windows are included for comparison. The figure reveals three notable observations. First, DAI experienced unusually high primary market activity during this period compared to normal volumes. Second, USDC’s burn activity was not abnormal during this window, but its minting activity was subdued. Third, DAI saw net issuance growth during the event window, while USDC experienced net outflows. Given that both stablecoins lost their peg during this time, future research could investigate the drivers of differences in net issuance during crises.
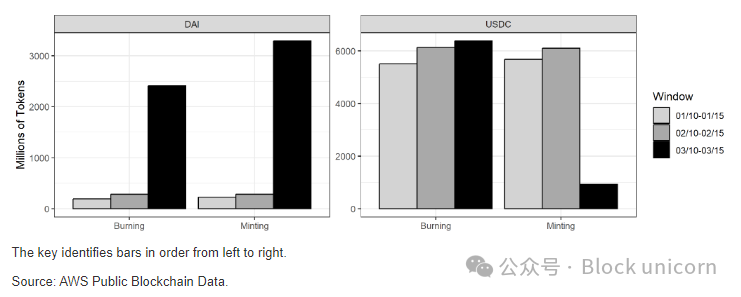
Figure 3. DAI and USDC Minting and Burning Activity Within Selected Windows on Ethereum
Delving deeper into USDC, Figure 4 plots the hourly number, value, and average size of mints and burns for the token during the event window of March 10–15. Here, we are particularly interested in primary market activity between Friday, March 10, and Monday, March 13, when Circle suspended and then resumed redemptions, respectively. By examining these transactions hour-by-hour, we can compare public statements from company officials with detailed primary market dynamics. Despite substantial burn transactions during this window, the total value and average size of transactions were limited.
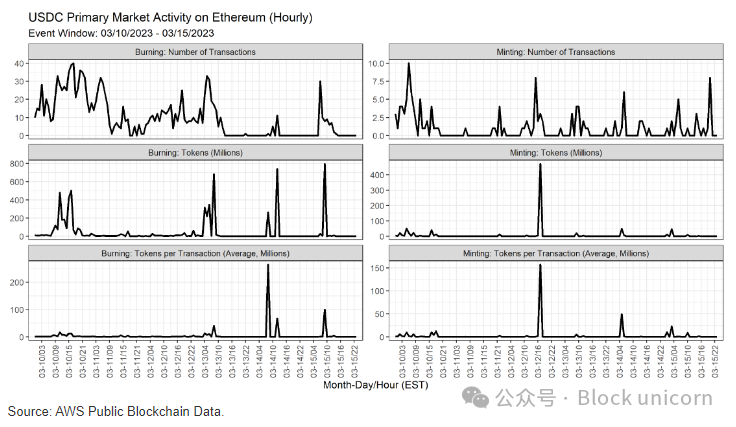
Figure 4. USDC Primary Market Activity on Ethereum During the De-Pegging Event
Figure 5 shows the daily “net flow” into secondary markets for all four stablecoins from March 1 to March 20. Prior to the de-pegging event window, BUSD experienced notable outflows for a period following the New York Department of Financial Services’ mid-February order halting new BUSD issuance. Figure 5 highlights that USDC experienced significant negative flow during the March de-pegging event compared to other stablecoins. On March 10, nearly $2 billion worth of USDC tokens were removed from secondary markets, net flows decreased over the weekend, and large outflows resumed on Monday, March 13. During the case study period, Dai also lost its peg, with net flows substantially decreasing. On March 11, inflows into secondary markets increased, followed by modest outflows over the subsequent week. Meanwhile, USDT was the only stablecoin to see net inflows into secondary markets in the week following the de-pegging event, possibly reflecting a flight to safety. Net inflows into secondary markets supplement our observations of secondary market activity during this period. While USDC’s selling pressure led to outflows from secondary markets, it is surprising that DAI saw net inflows into secondary markets despite its price moving similarly.

Figure 5. Net Flow from Primary to Secondary Markets
Overall, in analyzing on-chain data, we observe significant differences in primary market activity across the four stablecoins during the crisis. Our results suggest that relying solely on exchange pricing data fails to capture the full story of a stablecoin run. Our analysis raises several research questions and underscores that primary market behavior, shaped by a stablecoin’s technical characteristics, is crucial for understanding crisis dynamics.
Concluding Thoughts
After stablecoin market events, media coverage and analysis typically focus only on secondary market price deviations. Given that the literature on interpreting stablecoin market dynamics remains unresolved, our technical and empirical analysis offers several insights, indicating areas ripe for further exploration:
-
The primary function of stablecoins in crypto markets is to maintain value stability. Therefore, price declines may harm a stablecoin’s long-term performance, as historical patterns suggest. However, price declines alone are insufficient to explain long-term outcomes. Indeed, during the March events, USDC experienced a sharp price drop and subsequent market cap decline, while USDT traded at a premium before seeing its market cap rise. Yet BUSD traded at a premium while its market cap fell, and DAI dropped below its dollar peg but emerged with increased market cap. While obvious factors like regulators halting BUSD issuance contributed, further research is needed to assess other influencing factors. Why did DAI’s pricing on secondary markets resemble USDC so closely? How much did differing primary markets influence these stablecoins?
-
There are substantial differences in stablecoin primary markets during both normal and crisis periods. Even stablecoins that appear superficially similar—such as fiat-backed USDT and USDC—are distributed through primary markets with unique characteristics in terms of frequency, number of participants, and responsiveness to external shocks. The importance of these variations for price stability, run risk, and price recovery warrants further detailed investigation.
-
Our empirical analysis suggests that decentralized and centralized exchanges operate differently during crises, despite exhibiting very similar stablecoin pricing. This raises several questions: To what extent do mechanical differences between automated market makers and limit order books, the availability of fiat trading pairs, or other factors drive these differences? Which secondary markets serve as more reliable indicators of stablecoin market stress?
Our study aims to highlight several areas worthy of further exploration. Our findings raise more questions than answers. As stablecoins continue to play a critical role in crypto markets and DeFi, we believe the insights and questions raised in this paper merit further theoretical and empirical research.
Join TechFlow official community to stay tuned
Telegram:https://t.me/TechFlowDaily
X (Twitter):https://x.com/TechFlowPost
X (Twitter) EN:https://x.com/BlockFlow_News