CoinShares Mining Report: The Hidden Bitcoin Cycle Code Behind the Halving
TechFlow Selected TechFlow Selected
CoinShares Mining Report: The Hidden Bitcoin Cycle Code Behind the Halving
After the halving, even if Bitcoin's price remains above $40,000, only a few mining companies are expected to remain profitable.
Author: James Butterfill
Translation: Frank, Foresight News
Summary
-
Growth and sustainability concerns: The Bitcoin mining network grew by 90% in 2023, raising questions about its environmental sustainability and profitability, particularly regarding the efficiency of mining operations and energy costs;
-
Dynamics of mining difficulty and hash rate trends: Bitcoin's mining "difficulty" adjustment mechanism ensures inelastic changes in BTC supply, leading to higher-cost miners facing difficulties post-halving due to reduced immediate income. This article evaluates the average production cost per BTC after halving, estimating it at $37,856;
-
Improvements in mining network efficiency: Despite rising power demands, mining efficiency has significantly improved. Randomness data helps analyze different mining models’ efficiency. Currently, the Bitcoin network’s average efficiency is 34W/T, potentially dropping to 10W/T by mid-2026;
-
Bitcoin mining and environmental impact: Bitcoin mining often utilizes stranded resources in remote areas. Daniel Batten notes that approximately 53% of Bitcoin mining now uses sustainable energy, significantly reducing emissions from flared natural gas—a major environmental issue;
-
Post-halving financial analysis for miners: After the 2024 halving, miner production costs and profit structures will shift. This analysis focuses on listed mining firms' varying cost structures and their vulnerability to the Bitcoin halving;
-
Conclusion and miner positioning: Most miners face challenges from high SG&A costs and must reduce expenses to remain profitable. Even with Bitcoin prices above $40,000, only a few mining companies are expected to remain profitable.
Growth of the Bitcoin Mining Network
The Bitcoin mining network has experienced rapid growth, with hash rate increasing by 104% in 2023. This rapid expansion raises sustainability concerns both environmentally and in terms of the network's profitability. In this article, we aim to address these two issues.
Below is our estimation of each miner’s average Bitcoin production cost following the halving, highlighting an average cost of $37,856 per BTC.
While Bitcoin mining shares some similarities with traditional mining—both consume energy to generate valuable assets—the comparison largely ends there. A unique self-regulating mechanism in Bitcoin mining known as “difficulty” adjustment ensures BTC supply remains strictly inelastic:
At some point during the Bitcoin mining cycle, miners on the upper end of the cost curve begin to be affected, and hash rate starts to decline—as price increases fail to offset rising mining difficulty.
Regardless of whether there are 2 or 2 million miners on the network, the number of Bitcoins left to mine remains unchanged until the next scheduled halving event. This means that if collective network hash rate increases significantly, mining difficulty adjusts upward to maintain a stable BTC production rate, thereby squeezing out higher-cost miners.
Therefore, our analysis focuses on the differing cost structures of publicly traded mining firms and those most vulnerable to the latest halving in April 2024.
To predict future hash rate trends, our best approach is analyzing historical patterns. Qualitative reasoning suggests hash rate growth may be partially driven by Bitcoin’s price: positive price outlooks could encourage miners to increase hash rate, expecting profitability—but this depends heavily on assumptions about future prices.
Historical data shows mining activity does increase around halving events; however, due to exponential growth, identifying clear cycles is challenging. We have done some work in this area. Since hash rate is often volatile, using deviations from historical trend lines produces more accurate results than purely qualitative methods.
A key issue is that most trend lines incorporate future information, meaning today’s visible trend would have looked different in the past. Thus, the most reliable method involves calculating an out-of-sample trend line unaffected by future developments.
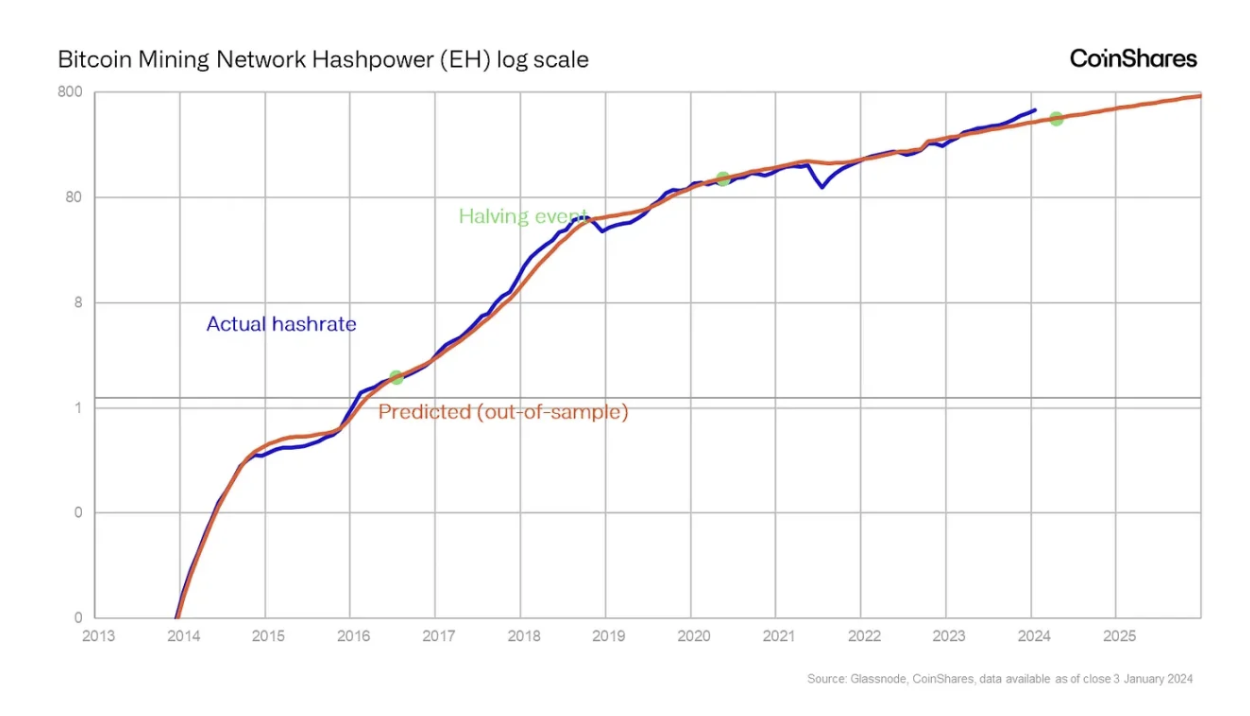
Data reveals an interesting recurring pattern between halving cycles, indicating thatfrom a historical perspective, current peak hash rates are not unusual at corresponding points in the cycle. The chart below more clearly illustrates this cyclical nature.
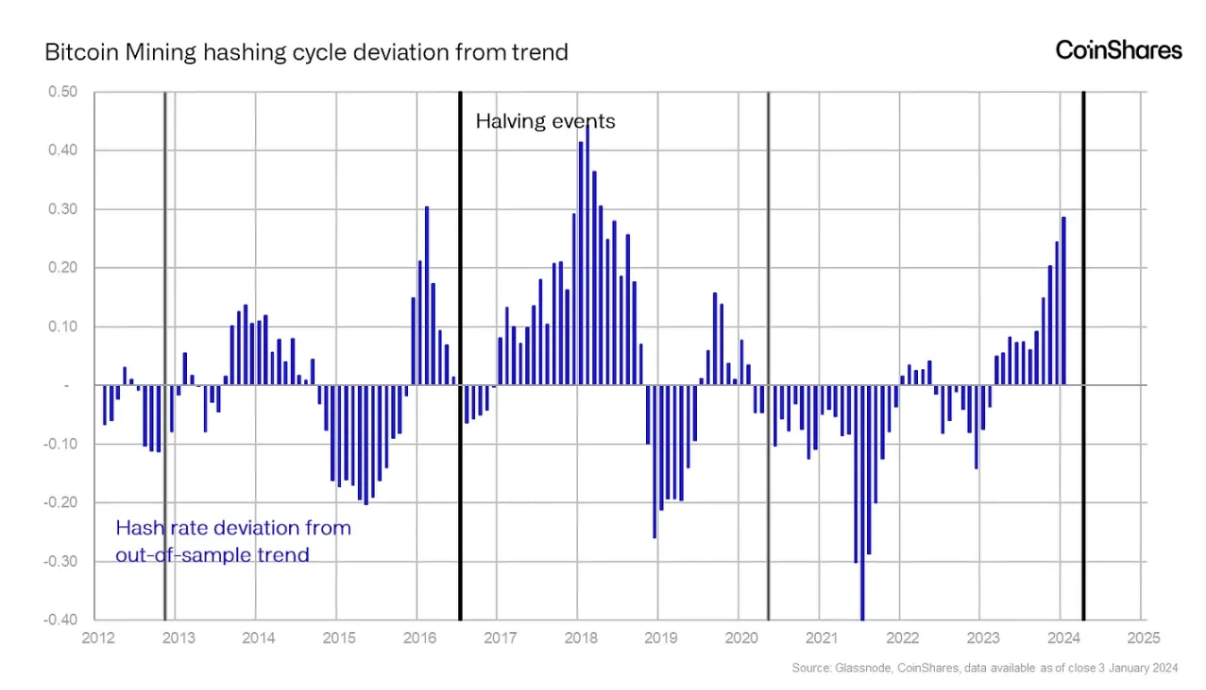
Since the first Bitcoin halving in 2012, followed by those in 2016 and 2020, a pattern has emerged wherehash rate typically falls about 9% below trend for roughly six months after each halving. The 2020 case was exceptional: due to China’s mining ban, this period was greatly extended, resulting in a 42% drop below trend.
Nonetheless, the typical pattern involvesan initial decline in hash rate, followed by a recovery midway through the cycle, then a surge in activity about a year before the next halving.
This cycle makes sense: To stay competitive ahead of the halving, miners increase capital expenditures, pushing hash rate well above trend. After the halving, miners’ immediate income drops, affecting their capital spending cycle. The current cycle follows this pattern. Notably,hash rate growth peaks typically occur about four months before the halving, possibly due to a “Bitcoin boom” causing mining difficulty to spike, forcing higher-cost miners and older equipment out of operation. Current mining difficulty is at historic highs and aligns with previously observed “relative” peaks within cycles.
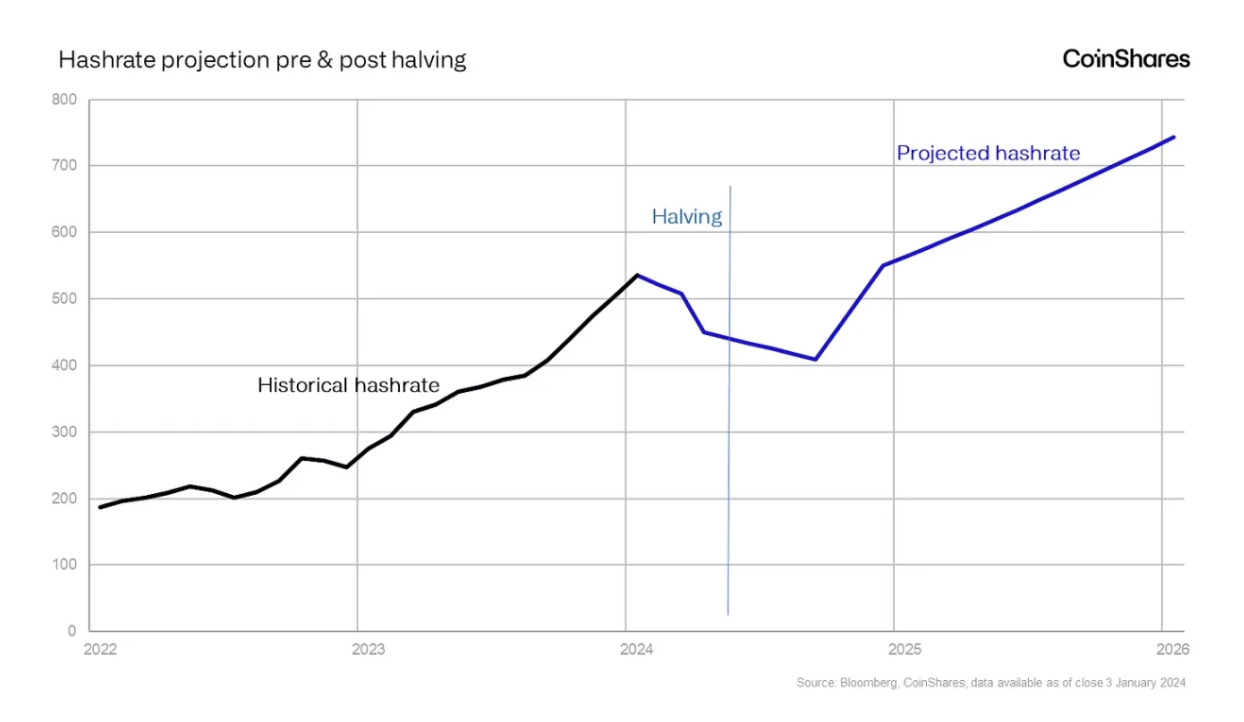
What lies ahead for Bitcoin hash rate? Guided by historical trends, we might expecthash rate to revert to around 450 EH/s by the time of the April 2024 halving. Six months later, it could fall further to 410 EH/s. Thereafter, according to trend projections, hash rate could sharply rise to about 550 EH/s by the end of 2024.
This halving may eliminate higher-cost miners at the top of the cost curve, giving those with ample liquidity opportunities to purchase mining hardware at discounted prices. This scenario largely depends on whether prices rise above the average production cost per miner, andmay require either a significant price drop or a sharp decline in transaction fees, such as reduced usage of Ordinals.
Improving Mining Network Efficiency
Currently, a wide variety of mining equipment is used for Bitcoin, spanning various power consumption levels, computational power, and resulting efficiency metrics. Historically, this diversity made determining overall mining efficiency challenging.
CoinMetrics’ Karim Helmy conducted notable research using randomness data for hardware fingerprinting. Without delving too deeply into technical details, we find that each mining model leaves a unique “vapor trail” on the Bitcoin blockchain—akin to contrails left by aircraft at high altitude—which can be analyzed to determine the distribution of different mining models across the network.
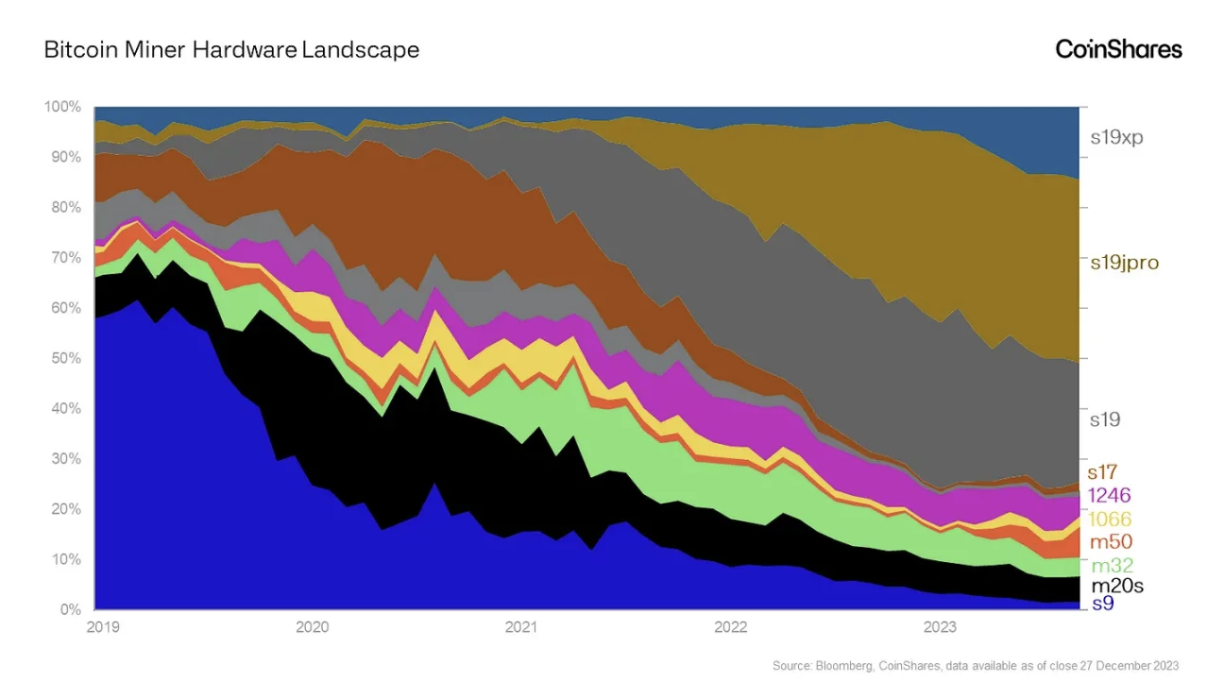
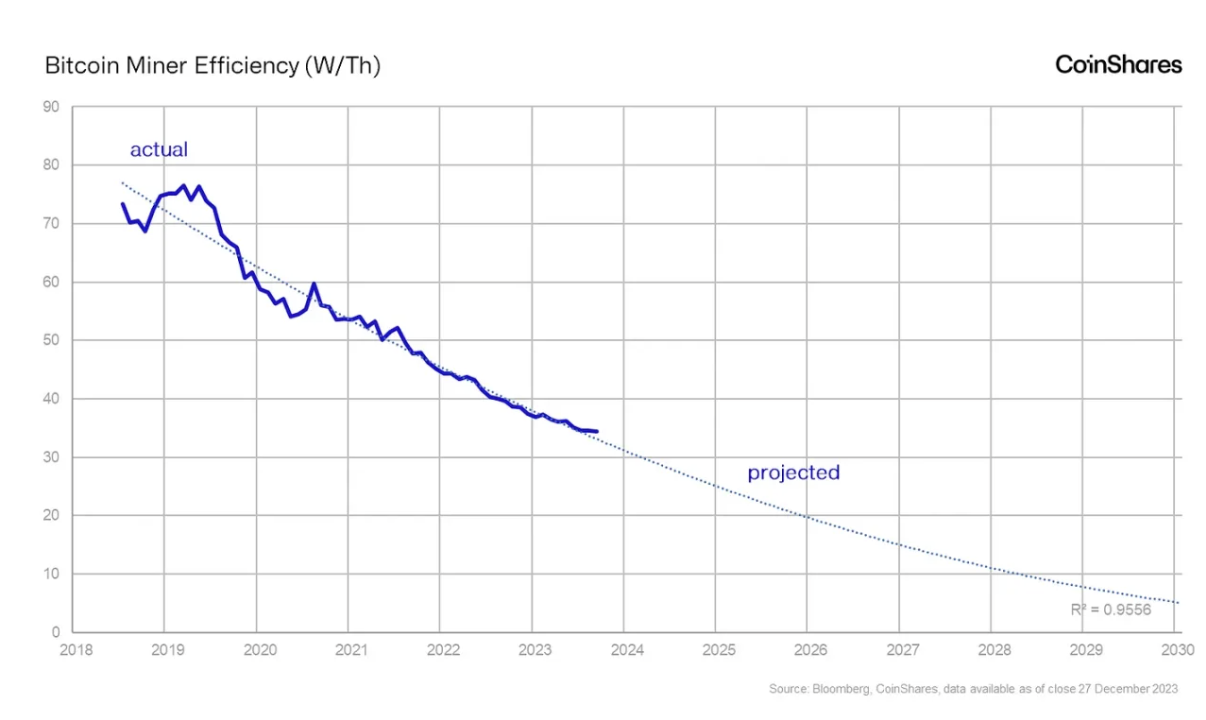
Since each mining model’s efficiency is measured in W/T, the overall efficiency of the entire Bitcoin mining network can be calculated. Given this trend is relatively linear, future trajectories can also be predicted.
Currently, the Bitcoin mining network has a weighted average efficiency of 34W/T, with an 8% improvement just in 2023 alone. Over the past three years, overall efficiency has improved by 28%.
Based on these trends, by mid-2026, as chip designs continue improving and more efficient mining hardware comes online,the overall efficiency level of the Bitcoin mining network could drop to around 10W/T.
Bitcoin miners consistently pursue the cheapest available energy, leading them to utilize stranded power—electricity that cannot be easily sold to existing grids.
This often involves renewable energy projects in remote locations, leading to increasing use of sustainable energy in Bitcoin mining. According to Daniel Batten’s estimates,approximately 53% of electricity consumed by Bitcoin mining currently comes from sustainable sources—surpassing the financial sector, which uses only about 40% sustainable energy, as Batten notes.
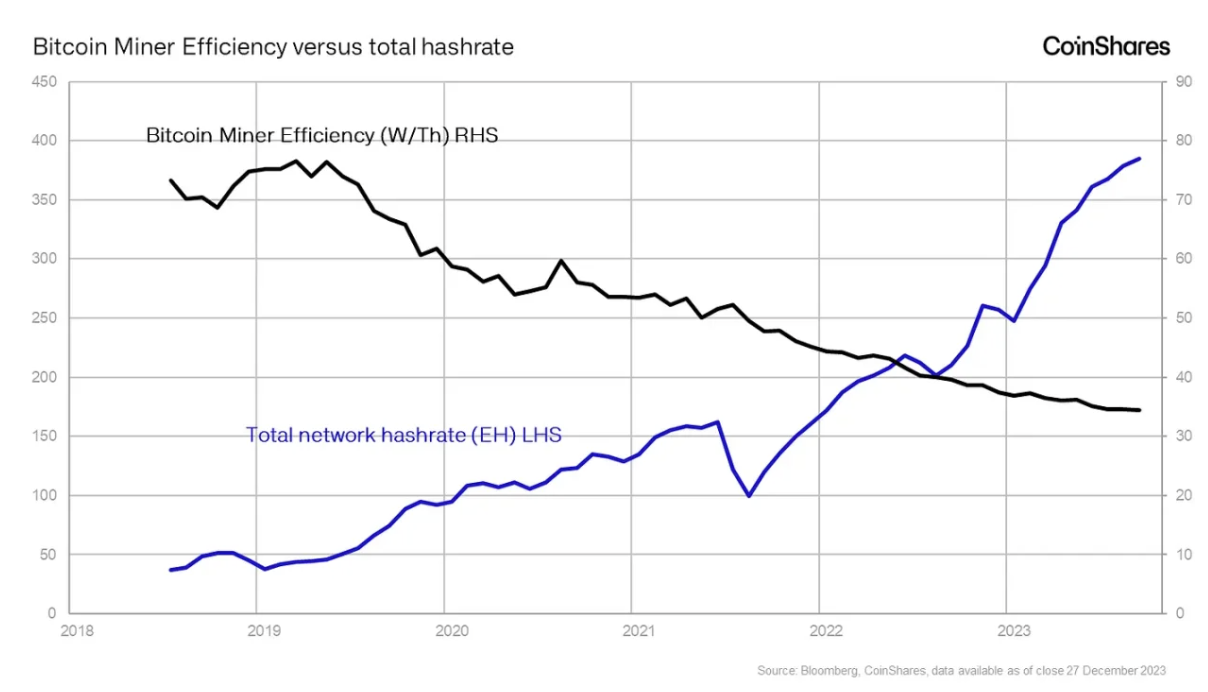
Despite recent significant hash rate increases, network efficiency continues to improve—a striking contrast.
The granularity of CoinMetrics’ randomness data reaches new levels, enabling us to estimate annual electricity costs, closely matching estimates from Cambridge University.
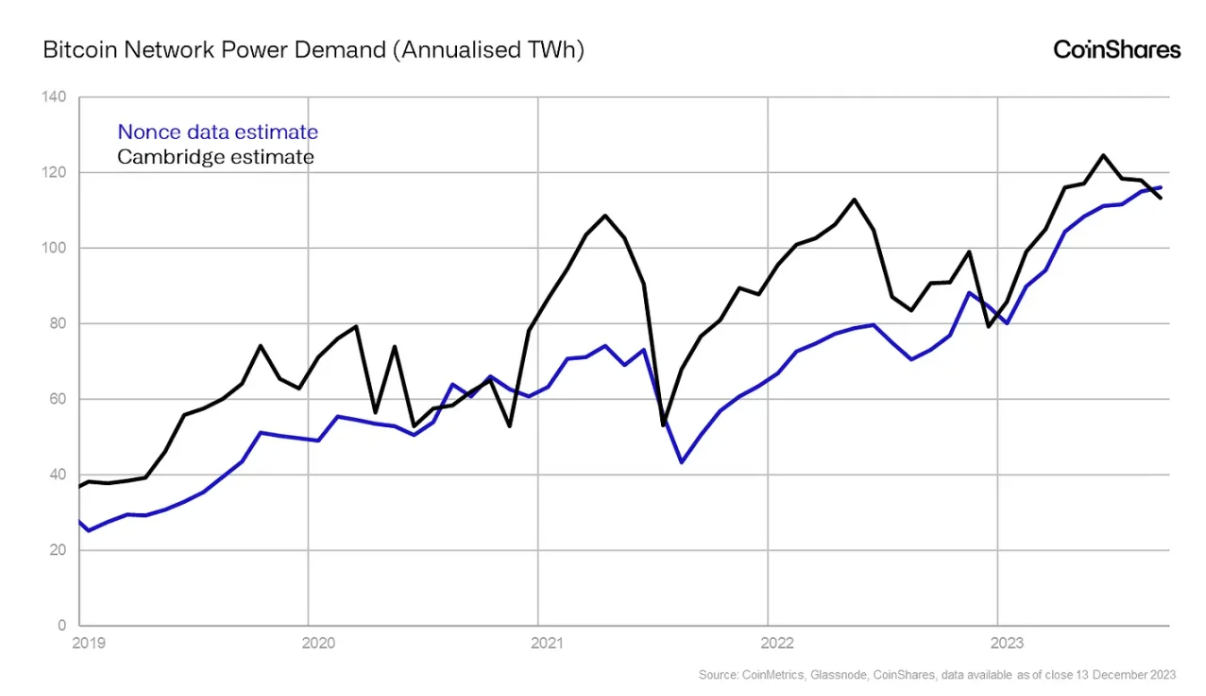
Data highlights that although the entire Bitcoin network’s mining efficiency has significantly improved, annual electricity demand for mining has reached a record high of 115 TWh—an increase of 44% in 2023. However, due to continuously improving mining efficiency, this rise in electricity demand is relatively moderate compared to hash rate growth.
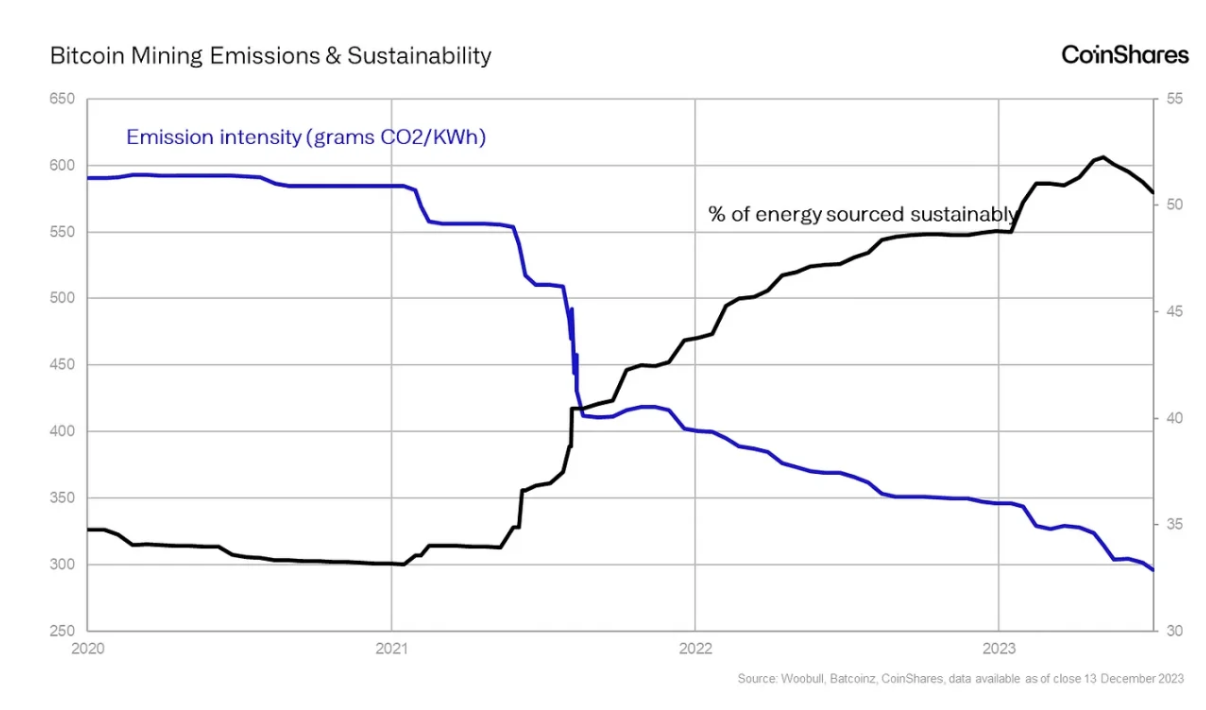
Daniel Batten’s research on the mining industry’s emission intensity shows that despite some data sources being difficult to track, CO₂ emissions have indeed declined significantly:
Since 2021, the mining industry’s CO₂ emissions have dropped from nearly 600 grams of CO₂ per kWh to just 299 grams per kWh. This reduction may be attributed to a substantial increase in sustainable energy use—from 33% in 2021 to 52% today.
This trend is partially reflected in Texas grid fuel mix—where Bitcoin mining occupies a significant share. IEEFA data shows renewables increased from 20% of total energy output in 2017 to 31% in 2023.
Bitcoin Helps Reduce Carbon Emissions
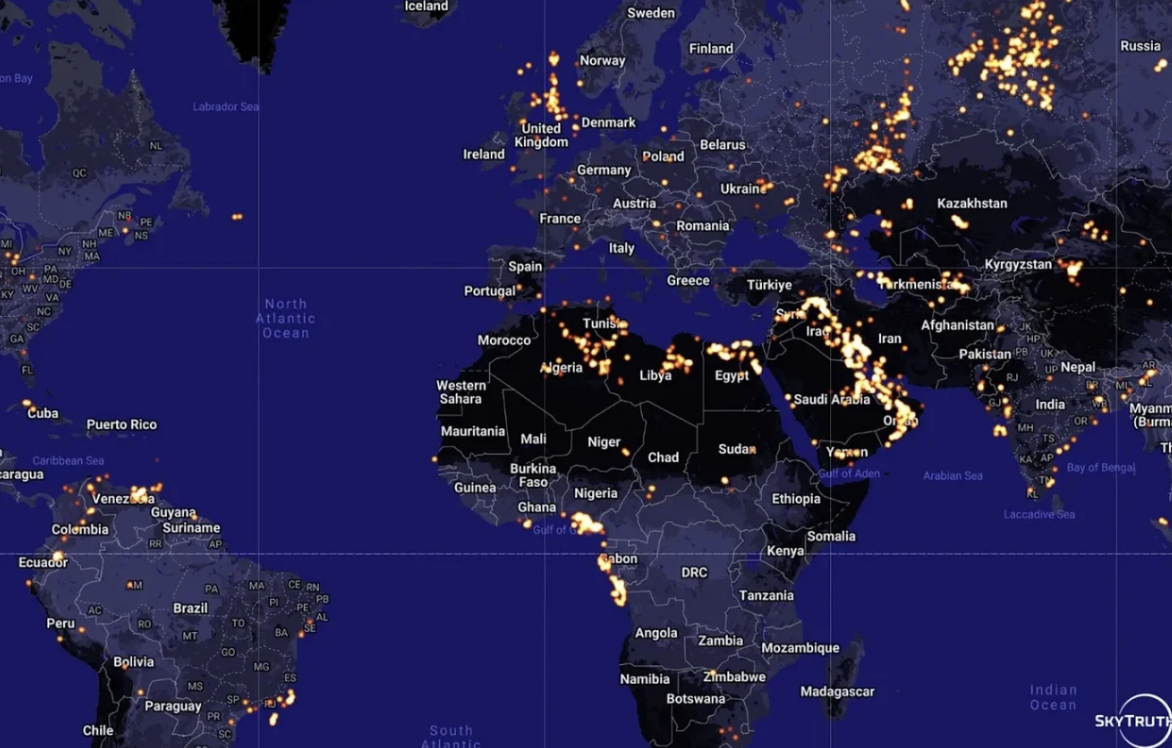
As recently highlighted in a BBC report, gas flaring is becoming an increasingly serious problem. The report draws attention to oil drilling activities in the Gulf region and the associated practice of flaring excess natural gas, posing greater threats to millions of people than previously recognized.
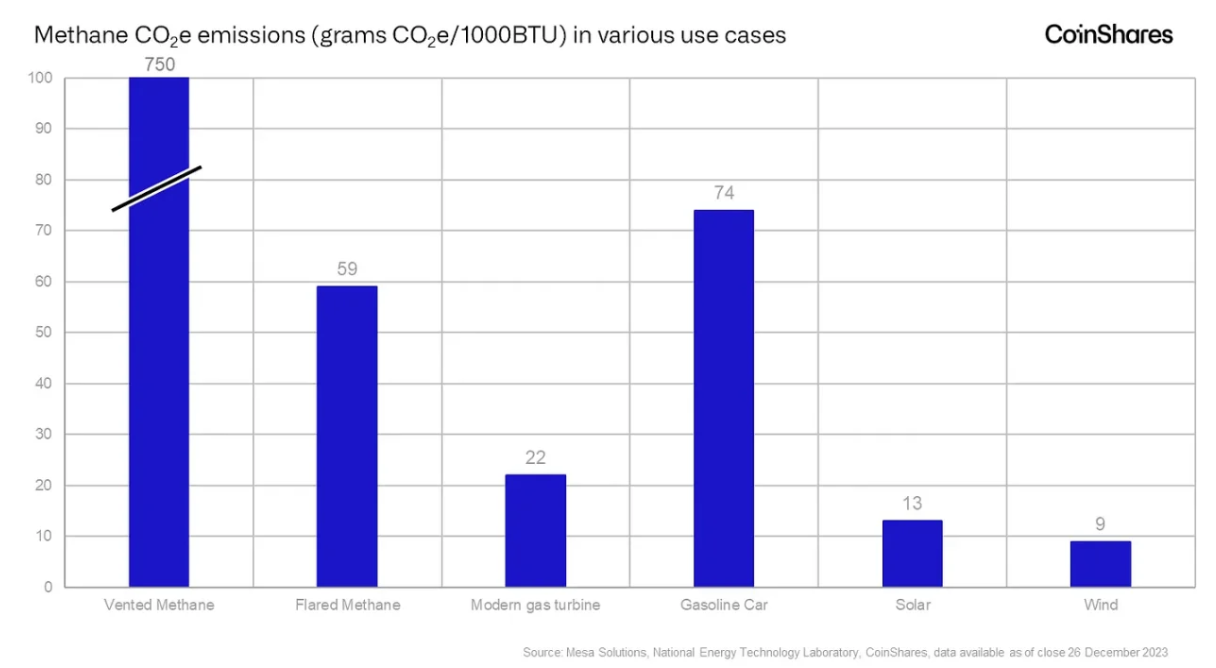
Mesa Solutions states that while flaring is less harmful to the environment than direct venting—reducing CO₂ equivalent emissions by 92%—its widespread use remains concerning. SkyTruth’s imagery vividly demonstrates the global scale of this issue, with yellow dots clearly marking flaring sites.
The World Bank estimates that globally, about 139 billion cubic meters of natural gas were flared in 2022—an amount equivalent to the combined natural gas consumption of Central and South America. According to Mesa Solutions, conventional methane flaring emits 59 grams of CO₂e per 1000 BTU.
In contrast, modern turbine generators emit only 22 grams of CO₂e per 1000 BTU, representing a 63% reduction in emissions and making them three times less polluting than gasoline-powered vehicles.
The main challenge with waste gas flaring is that the involved energy cannot be economically stored or transported, so it is often flared—this typically occurs in remote areas disconnected from grids or pipelines, where we believe Bitcoin mining can drastically reduce flaring-related emissions. This is because mining hardware and necessary generators can be containerized and operated in such remote off-grid locations.
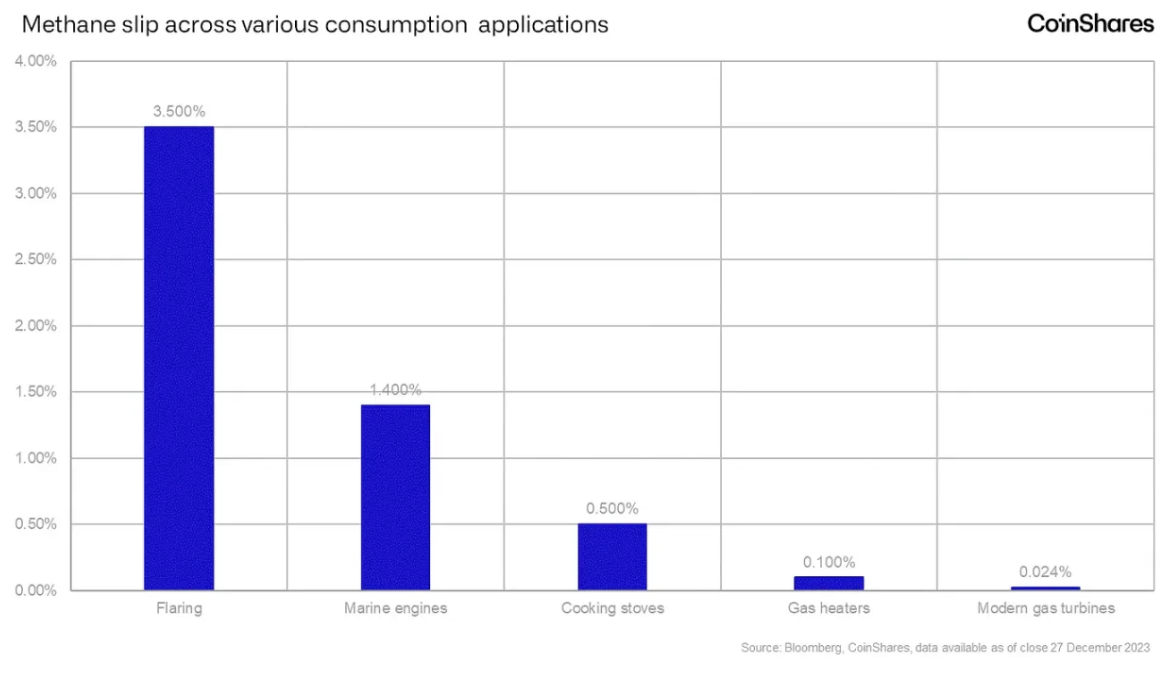
Moreover, flaring often leads to higher methane leakage rates—occurring when small amounts of natural gas fail to burn completely and escape into the atmosphere, especially common under windy conditions. In contrast, turbines are known to have among the lowest methane leakage rates, significantly reducing the risk of such incidents.
Currently, gas flaring emits approximately 406 million tons of CO₂ annually; however,if all currently flared natural gas were used for Bitcoin mining, these emissions could be reduced to about 152 million tons of CO₂. Given that global flaring accounts for 1.1% of global CO₂ emissions, Bitcoin mining could reduce flaring emissions to just 0.41% of global emissions.
To date, only about 120 megawatts (MW) of Bitcoin mining capacity is known to utilize wasted natural gas energy. Therefore, if Bitcoin mining expands its use of this wasted gas, it holds enormous potential to significantly reduce global CO₂ emissions.
Impact of Halving on Bitcoin Miners
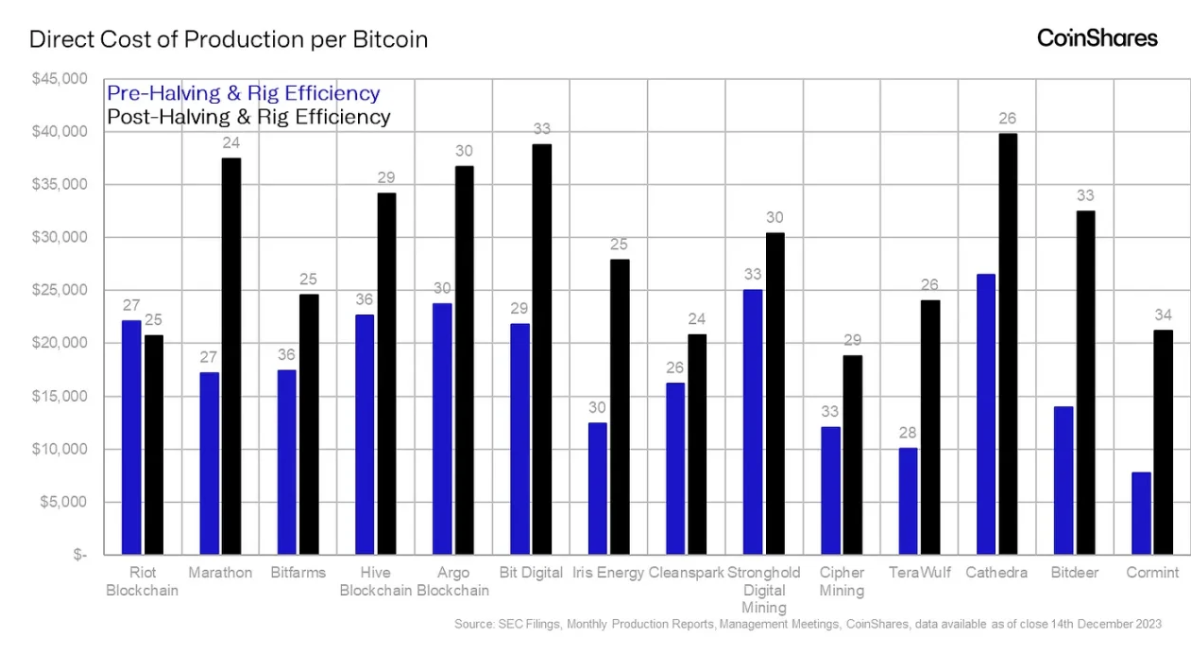
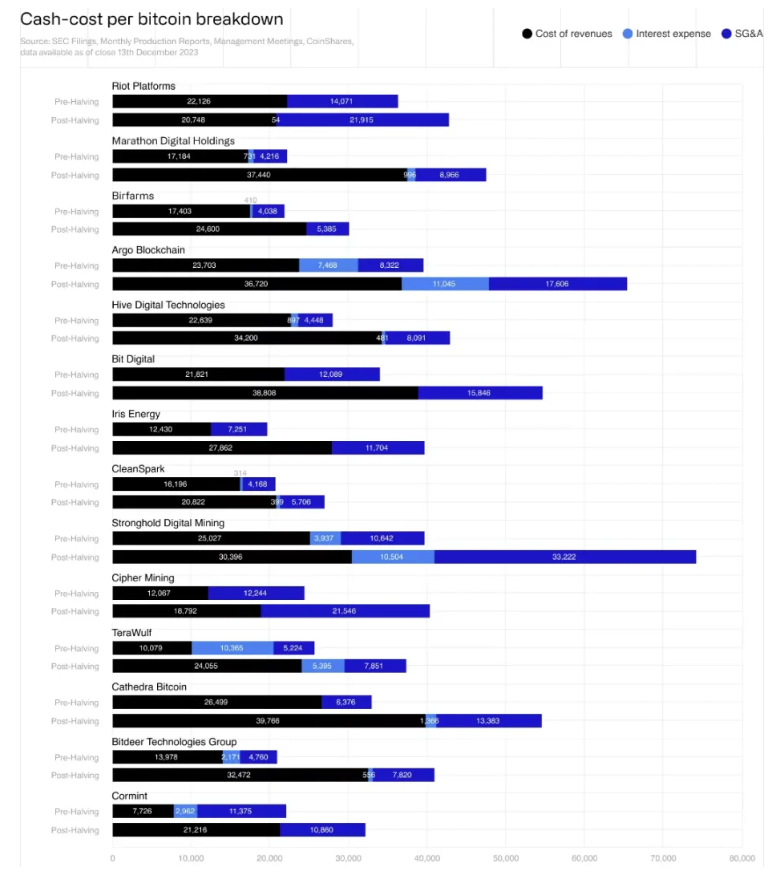
In this research paper, we estimate the weighted average Bitcoin production cost and cash cost for Q3 2023—at approximately $16,800 and $25,000 per Bitcoin, respectively.
After the halving event in April 2024, these costs are expected to rise to $27,900 and $37,800, respectively. Due to its efficient cost structure and long-term planning, Riot appears best positioned to withstand these changes. Based on our analysis of financial statements from public and private mining firms—and assuming a Bitcoin price of $40,000—we find that most miners will face challenges primarily stemming from bloated selling, general, and administrative (SG&A) expenses.
Methodology
Our Q3 2023 financial analysis employs an adjusted consolidated income statement approach. This standardized method applies to the mining operations of 14 mining firms, 13 of which are publicly listed entities, collectively accounting for 19% of all Bitcoin mining hash rate as of December 2023, and about 25% post-halving (at a network hash rate of 450 EH/s).
Our Q3 2023 data primarily comes from SEC filings, website production reports, or estimates when necessary.
Our methodology includes:
-
Cost of revenue represents self-mining revenue costs, primarily electricity costs;
-
SG&A excludes non-cash expenses such as stock-based compensation and one-time payments;
-
Interest expense considers only debt interest, excluding lease costs or other financing charges;
After the halving event, direct costs to reach production and operational breakeven rise sharply to $27,900 and $37,800, respectively—driven by the halved block reward. Our revenue and expenditure forecasting methods are as follows:
-
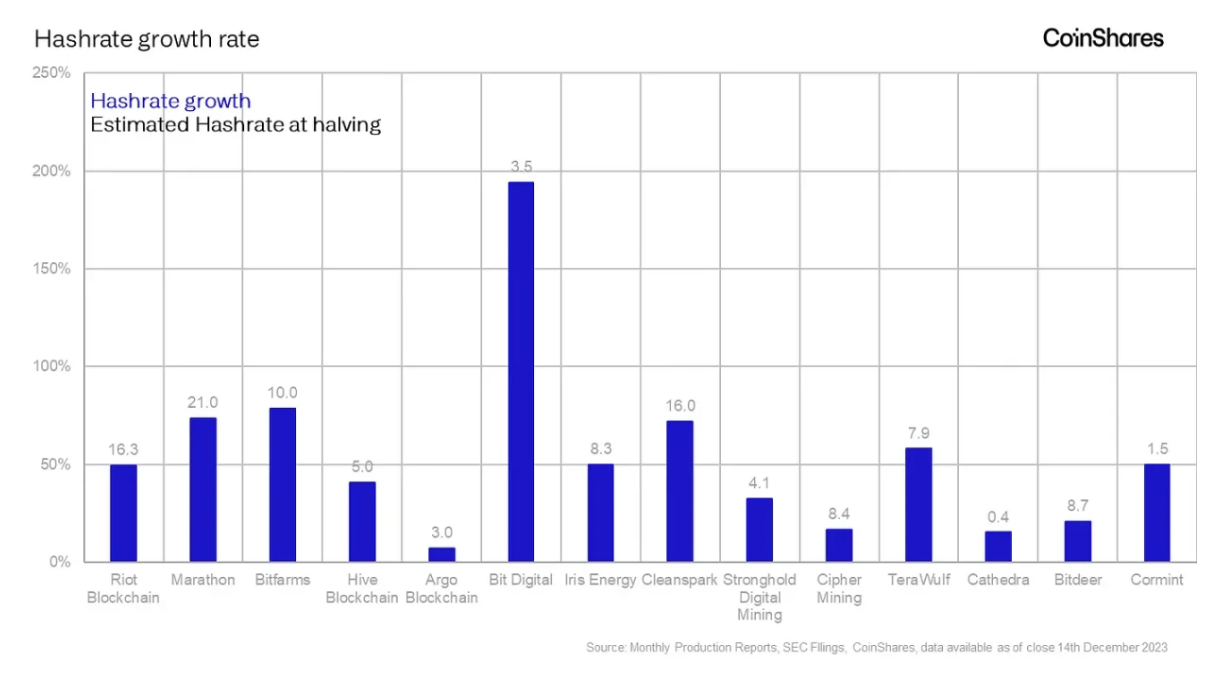
Hash rate market share is determined by each company’s disclosed pre-computed hash rate, expressed as a percentage of our estimated 450 EH/s at halving—about 10% lower than 500 EH/s;
-
Production costs are calculated using a bottom-up approach, incorporating mining hardware efficiency, electricity costs, kilowatt-hours used (assuming stable utilization from Q3 2023), and quantity of mined Bitcoin;
-
SG&A expenses are assumed consistent with Q3 2023 levels, as corporate expenses are not expected to change significantly due to the halving;
-
Interest expenses are determined by multiplying the sum of outstanding principal by prevailing interest rates;
-
Our comprehensive methodology ensures standardized and comparable financial analysis before and after the halving, effectively guiding our operational decisions;
Miner Hash Rate
On average every ten minutes, the Bitcoin network generates a block when miners correctly compute (guess) a hash value (a pseudo-random 64-character alphanumeric string), which the rest of the network then verifies. Miners with more hash rate (more machines, hence greater computing power) control a larger share of the network’s total hash rate, giving them a higher chance of generating a block and receiving the block reward (currently 6.25 BTC, but halving to 3.125 BTC around April 2024) plus transaction fees.
Miners are essentially engaged in an arms race to buy and deploy as many machines as possible.
The more mining machines a miner uses for self-mining, the larger the required data center (measured in megawatts). This massive capital expenditure is mostly funded through cash, equity, or debt, with the latter potentially harming miners’ total production costs via higher interest expenses and exposing mining firms to risks during periods of low Bitcoin prices.
For example, according to Q3 2023 filings, Core Scientific underwent bankruptcy liquidation at the end of 2022, while Mawson failed to repay its Marshall loan—examples that are not isolated.
Bitcoin Production
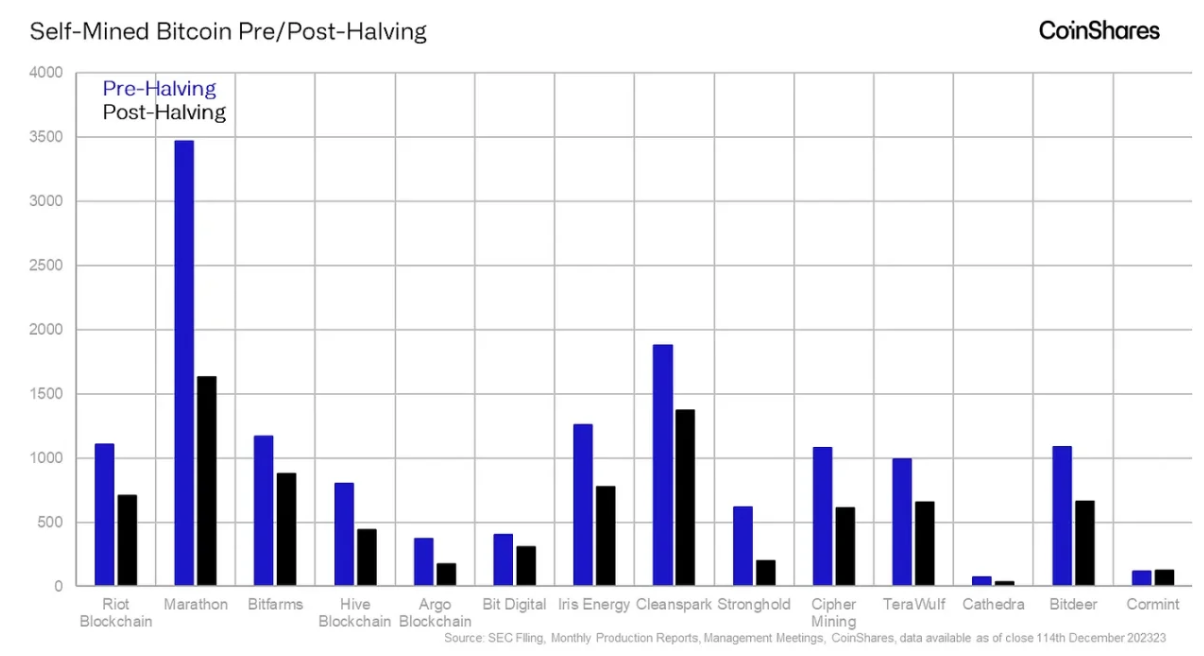
The quantity of produced Bitcoin is an integral part of each miner’s unit economics and cost structure. For miners to achieve the same Bitcoin output as before the halving, they would need to double their hash rate share—a highly challenging feat given the network’s compound annual hash rate growth of about 53% over the past three years—or the amount of fees collected per block must fully compensate for the halved block reward.
Electricity Costs
A Bitcoin miner’s cost structure is a function of two inputs: energy and equipment. The listed miners we track consume electricity at an average of 4.5 cents per kWh. This energy is purchased wholesale, most likely on spot or futures markets, or negotiated through Power Purchase Agreements (PPAs) with energy suppliers—contracts that usually offer fixed energy prices but often include “take-or-pay” clauses (Foresight News note: the buyer commits to purchasing and paying for a minimum annual electricity volume as agreed in the PPA, regardless of actual need).
In contrast, miners have greater control over their mining hardware fleets and can reduce energy expenses by investing in more efficient machines, allowing each unit of hardware to consume less electricity per unit of hash rate.
Among the listed miners we track, the entire fleet’s efficiency is expected to improve from 29W/T to 26W/T at the time of the halving. Recent machine purchases by CleanSpark and Iris Energy illustrate how miners upgrade their fleets to improve efficiency (i.e., lower W/T):
They acquired 4.4 EH/s and 1.4 EH/s of Bitmain Antminer S21 miners, respectively, with an efficiency ratio of 17.5W/T, priced at approximately $14/TH.
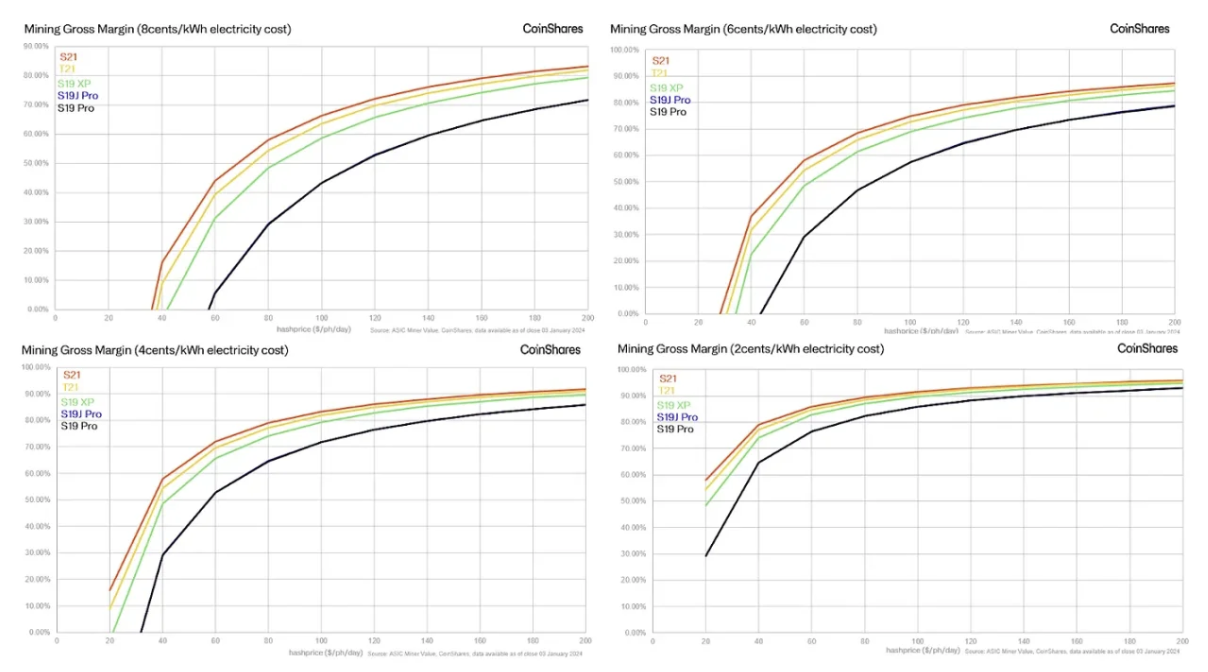
The matrix below shows that although the T21 is a newer model,the S21 outperforms all other miner types across all electricity and hash rate price scenarios due to higher hash rate (impacting revenue) and lower power consumption (impacting costs).
The chart below illustrates changes in miner efficiency before and after the halving. Note that although most mining firms are improving their overall fleet efficiency (W/T), their direct cost structures are not necessarily improving. This is because, as previously noted, miners must increase power and energy consumption to mine the same amount of Bitcoin.
Before and after the halving, the weighted average share of electricity costs in the cash cost structure per Bitcoin is approximately 68% and 71%, respectively, with the slight increase mainly attributable to modest rises in scale and energy prices.
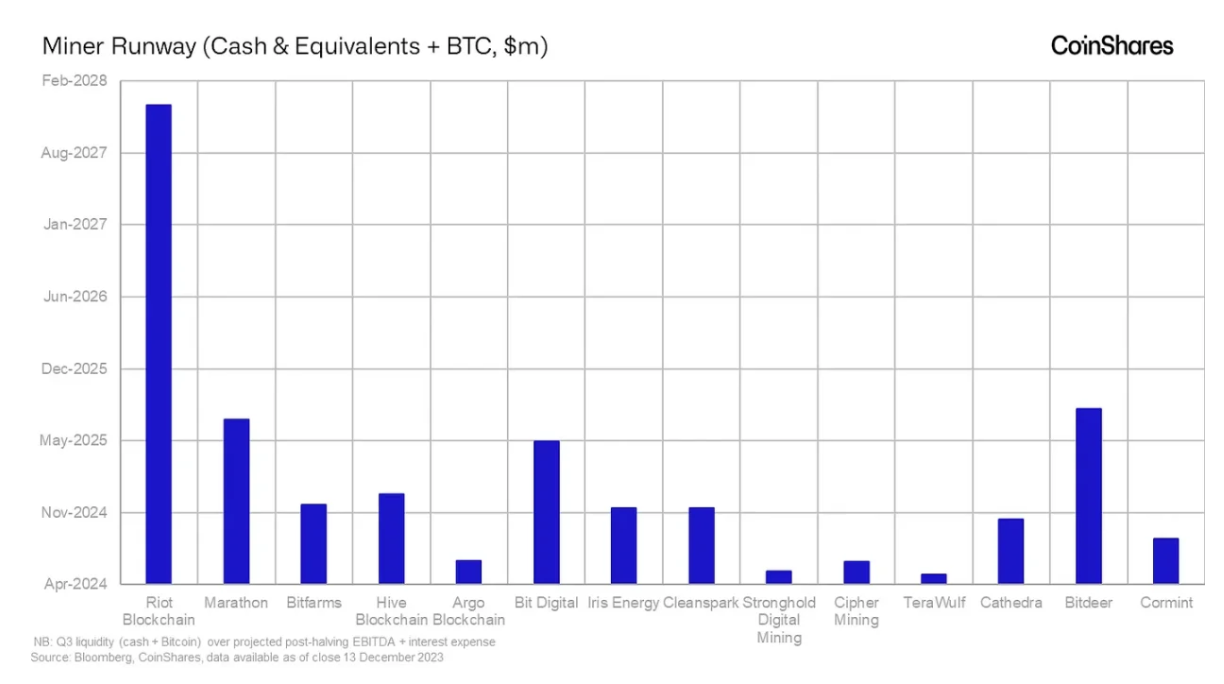
Miner Survival Cycle
We define survival cycle as the number of days a miner can cover cash operating expenses using cash and Bitcoin reserves. There is no standard treasury management strategy across the industry. Some accumulate output as much as possible—known as “HODL”—while others choose to sell Bitcoin immediately upon mining.
Well-capitalized mining firms with large Bitcoin balances may gain higher premiums during bull markets—such as Riot. However, short survival cycles combined with high cash costs expose miners like Stronghold to risks during Bitcoin price downturns.
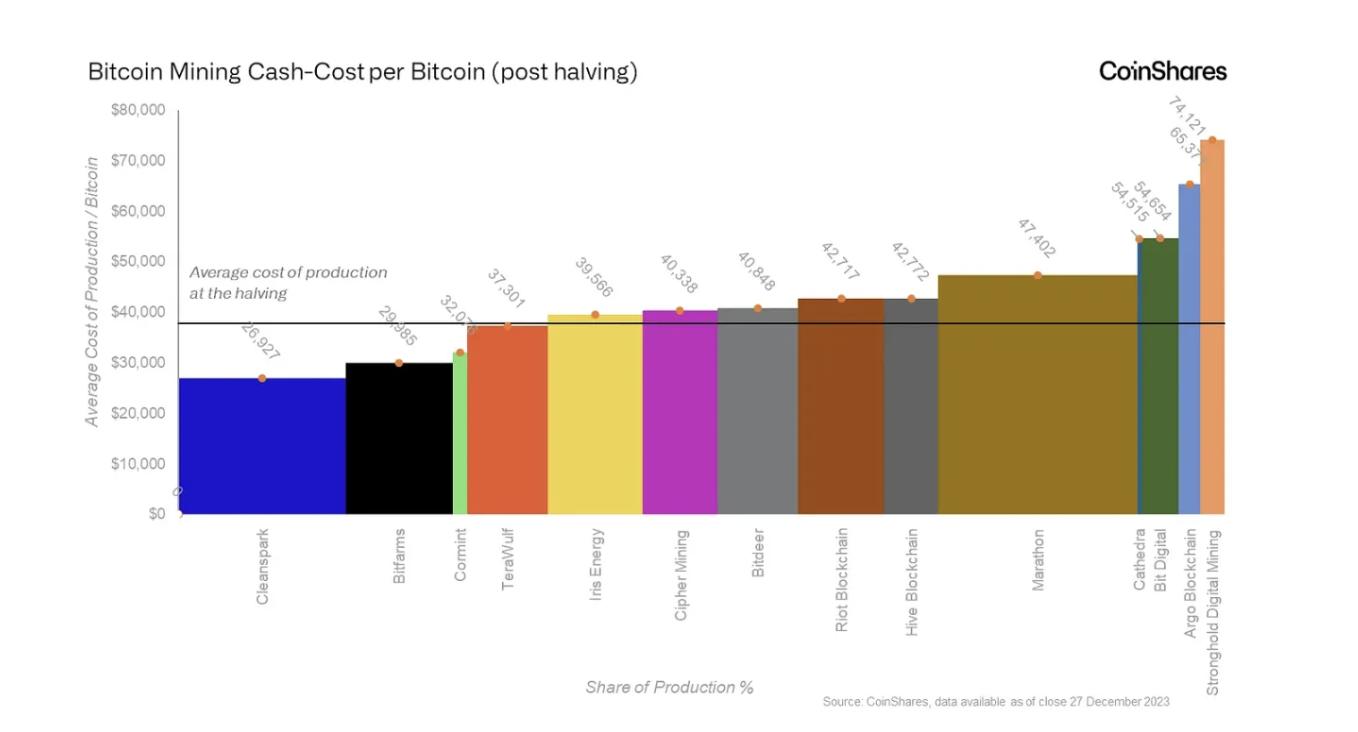
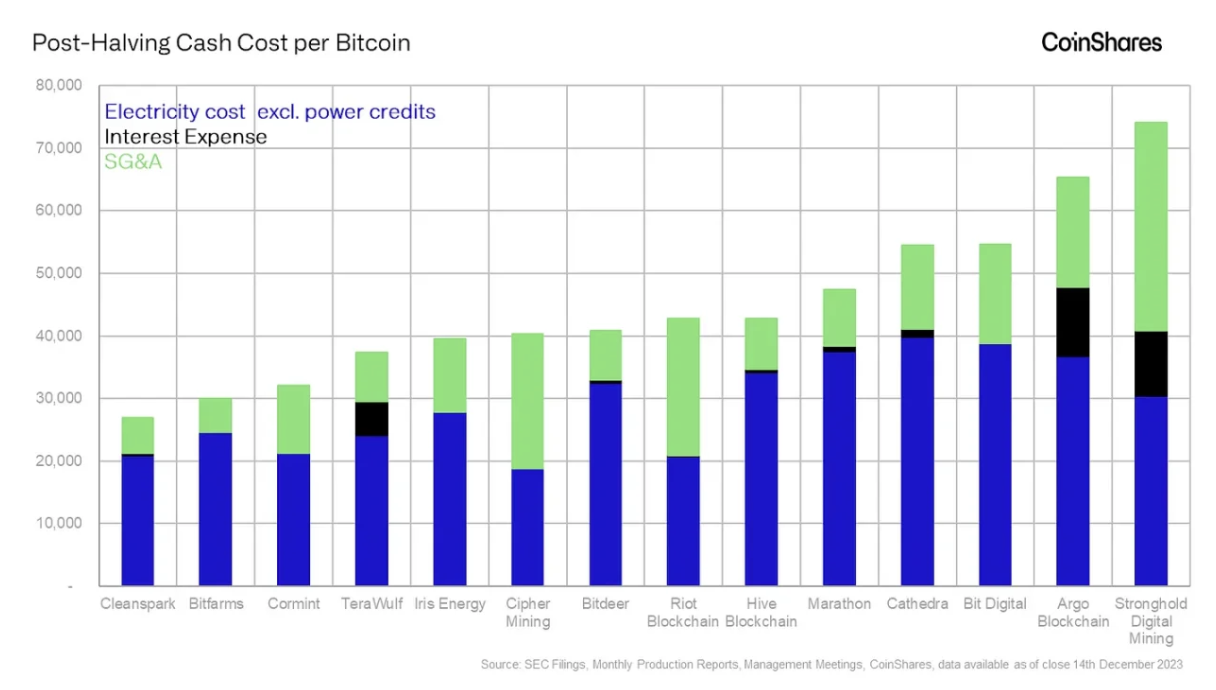
Cash Production Cost
According to the chart below, we believe Riot, TeraWulf, and Cleanspark are best positioned entering the halving. A major challenge for mining firms is high SG&A costs. For miners to break even, the halving may force them to cut sales and administrative expenses; otherwise, they may continue losing money and be forced to liquidate their HODL balances and other liquid assets.
Note: Data for Iris Energy and Cormint is based on Q2 2023 filings, management calls, and monthly production reports.
Conclusion
Our analysis indicates that Riot appears best equipped to handle the complexities of the halving event, primarily due to its cost structure and long survival cycle. Much of the pain miners will experience may stem from high SG&A expenses, which may need to be cut to maintain profitability.
Overall, unless Bitcoin price remains above $40,000, we believe only Bitfarms, Iris, CleanSpark, TeraWulf, and Cormint will remain profitable. All other mining firms may erode their margins, eventually forcing further stock dilution as they likely raise equity or convert debt.
Join TechFlow official community to stay tuned
Telegram:https://t.me/TechFlowDaily
X (Twitter):https://x.com/TechFlowPost
X (Twitter) EN:https://x.com/BlockFlow_News